Comprehensive Financial Report: Tesco PLC Ratio Analysis and Valuation
VerifiedAdded on 2023/01/12
|18
|2915
|2
Report
AI Summary
This report provides a comprehensive financial analysis of Tesco PLC, including a detailed examination of its financial performance through ratio analysis, comparing it with competitors like Sainsbury's and Morrisons. The analysis covers profitability, liquidity, and investor ratios, highlighting Tesco's strengths and weaknesses. Furthermore, the report includes company valuation using asset-based valuation, dividend valuation model, and P/E ratio, offering insights into the company's intrinsic value. Finally, the report calculates the cost of debt for convertible bonds, providing a holistic view of Tesco's financial health and capital structure. Desklib offers a platform to access this and many other solved assignments for students.

FINANCE
Paraphrase This Document
Need a fresh take? Get an instant paraphrase of this document with our AI Paraphraser
Contents
INTRODUCTION.......................................................................................................................................3
MAIN BODY..............................................................................................................................................3
2.1 Financial analysis..................................................................................................................................3
2.2 Company Valuation...............................................................................................................................9
2.3 Capital structure...................................................................................................................................15
CONCLUSION.........................................................................................................................................17
REFERENCES..........................................................................................................................................18
INTRODUCTION
The financing is a vital function for organizations, since it plays an important part in the
operation of different businesses. Without sufficient funding accessible an organization cannot
imagine maintaining itself in a competitive market (Hiferding, 2019). Thus financing as a whole
is just as critical for corporations as blood for humans. With the aid of financial statements such
as income accounts, cash flow etc, different types of ratios are used in project report to analyzes
Tesco's financial results. In accordance with the financial results of the firm, the issue of
shareholders' is contrasted with the profitable business. In addition, valuation of above plc is also
done by help of prepared financial statements as well as calculations are done in accordance of
given scenario in last part.
MAIN BODY
2.1 Financial analysis
(a) Analysis of financial performance of Tesco by comparing with its competitors.
Ratio analysis- The ratio analyzes are the analysis of line items in a company's financial
statements. Ratio analyzes are used to measure a variety of company challenges, such as their
competitiveness, operating performance, and productivity. This kind of analysis is valuable for
investors beyond a firm since the financial records are the main source of knowledge for an
entity (Fracassi, 2017). Analysis of ties between firms is less helpful because they have greater
access to comprehensive market details regarding the company. In order to sort out issues of
stakeholder, Tesco’s financial ratios are compared with its competitors which are Sainsbury’s
and Morrisons plc. Herein, below comparison among these plc is done below in such manner:
1. Profitability ratio
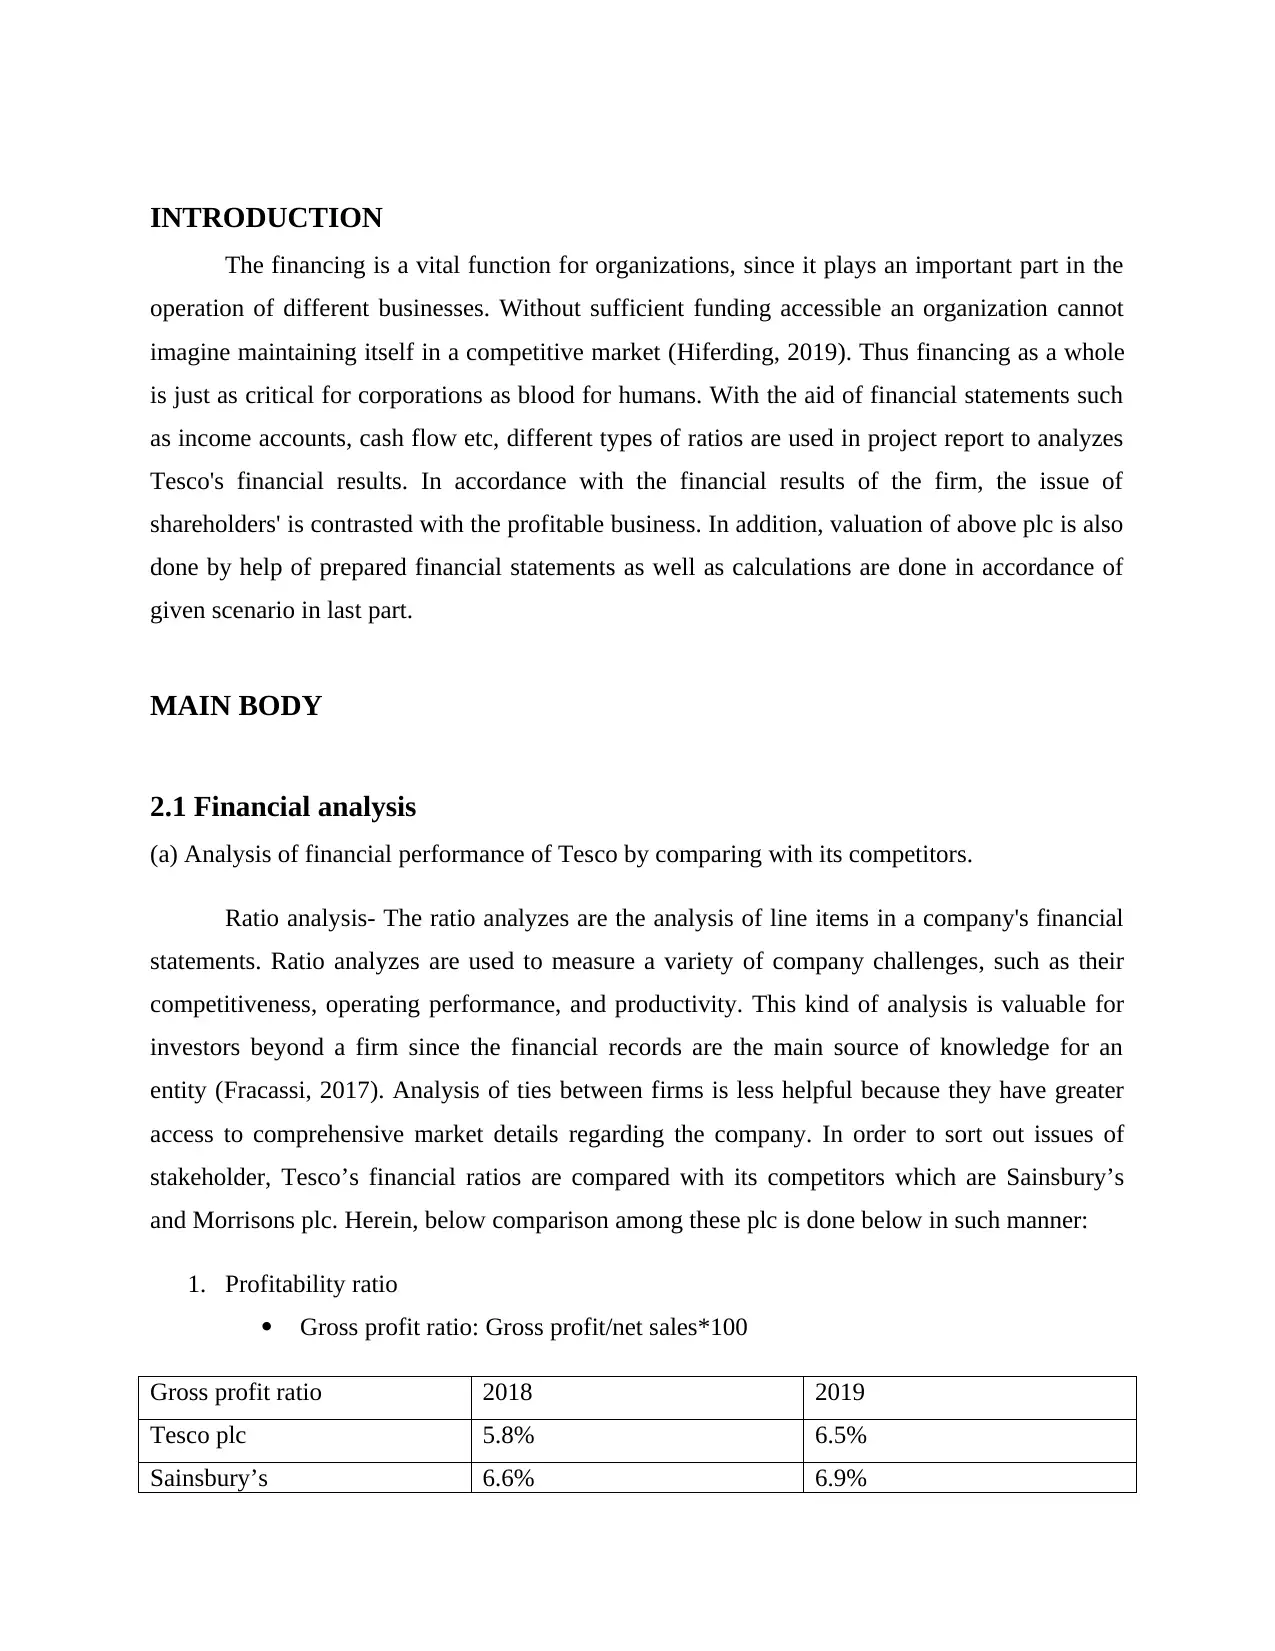
Gross profit ratio: Gross profit/net sales*100
Gross profit ratio 2018 2019
Tesco plc 5.8% 6.5%
Sainsbury’s 6.6% 6.9%
The financing is a vital function for organizations, since it plays an important part in the
operation of different businesses. Without sufficient funding accessible an organization cannot
imagine maintaining itself in a competitive market (Hiferding, 2019). Thus financing as a whole
is just as critical for corporations as blood for humans. With the aid of financial statements such
as income accounts, cash flow etc, different types of ratios are used in project report to analyzes
Tesco's financial results. In accordance with the financial results of the firm, the issue of
shareholders' is contrasted with the profitable business. In addition, valuation of above plc is also
done by help of prepared financial statements as well as calculations are done in accordance of
given scenario in last part.
MAIN BODY
2.1 Financial analysis
(a) Analysis of financial performance of Tesco by comparing with its competitors.
Ratio analysis- The ratio analyzes are the analysis of line items in a company's financial
statements. Ratio analyzes are used to measure a variety of company challenges, such as their
competitiveness, operating performance, and productivity. This kind of analysis is valuable for
investors beyond a firm since the financial records are the main source of knowledge for an
entity (Fracassi, 2017). Analysis of ties between firms is less helpful because they have greater
access to comprehensive market details regarding the company. In order to sort out issues of
stakeholder, Tesco’s financial ratios are compared with its competitors which are Sainsbury’s
and Morrisons plc. Herein, below comparison among these plc is done below in such manner:
1. Profitability ratio
Gross profit ratio: Gross profit/net sales*100
Gross profit ratio 2018 2019
Tesco plc 5.8% 6.5%
Sainsbury’s 6.6% 6.9%
⊘ This is a preview!⊘
Do you want full access?
Subscribe today to unlock all pages.
Trusted by 1+ million students worldwide
Morrisons 3.7% 3.4%
Tesco plc Sainsbury’s Morrisons
0.00%
1.00%
2.00%
3.00%
4.00%
5.00%
6.00%
7.00%
8.00%
5.80%
6.60%
3.70%
6.50% 6.90%
3.40% 2018
2019
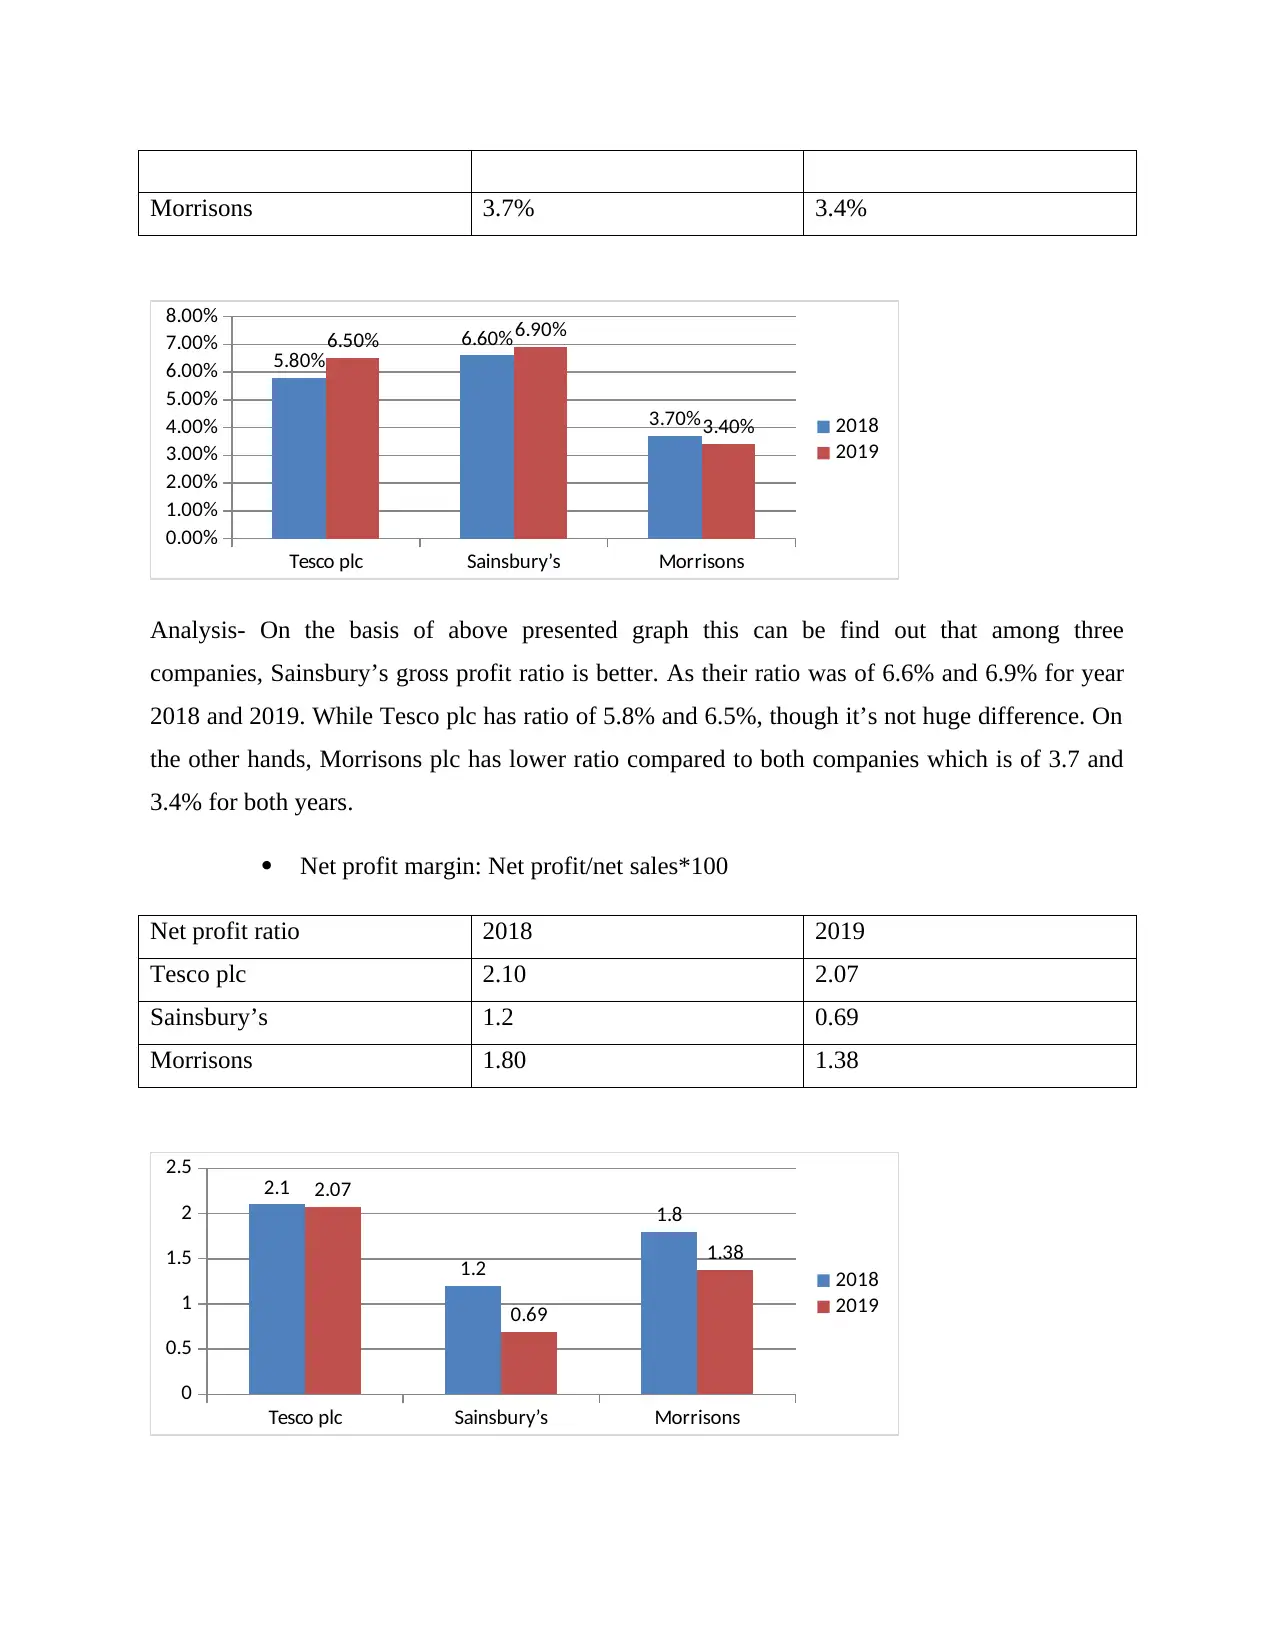
Analysis- On the basis of above presented graph this can be find out that among three
companies, Sainsbury’s gross profit ratio is better. As their ratio was of 6.6% and 6.9% for year
2018 and 2019. While Tesco plc has ratio of 5.8% and 6.5%, though it’s not huge difference. On
the other hands, Morrisons plc has lower ratio compared to both companies which is of 3.7 and
3.4% for both years.
Net profit margin: Net profit/net sales*100
Net profit ratio 2018 2019
Tesco plc 2.10 2.07
Sainsbury’s 1.2 0.69
Morrisons 1.80 1.38
Tesco plc Sainsbury’s Morrisons
0
0.5
1
1.5
2
2.5 2.1
1.2
1.8
2.07
0.69
1.38
2018
2019
Tesco plc Sainsbury’s Morrisons
0.00%
1.00%
2.00%
3.00%
4.00%
5.00%
6.00%
7.00%
8.00%
5.80%
6.60%
3.70%
6.50% 6.90%
3.40% 2018
2019
Analysis- On the basis of above presented graph this can be find out that among three
companies, Sainsbury’s gross profit ratio is better. As their ratio was of 6.6% and 6.9% for year
2018 and 2019. While Tesco plc has ratio of 5.8% and 6.5%, though it’s not huge difference. On
the other hands, Morrisons plc has lower ratio compared to both companies which is of 3.7 and
3.4% for both years.
Net profit margin: Net profit/net sales*100
Net profit ratio 2018 2019
Tesco plc 2.10 2.07
Sainsbury’s 1.2 0.69
Morrisons 1.80 1.38
Tesco plc Sainsbury’s Morrisons
0
0.5
1
1.5
2
2.5 2.1
1.2
1.8
2.07
0.69
1.38
2018
2019
Paraphrase This Document
Need a fresh take? Get an instant paraphrase of this document with our AI Paraphraser
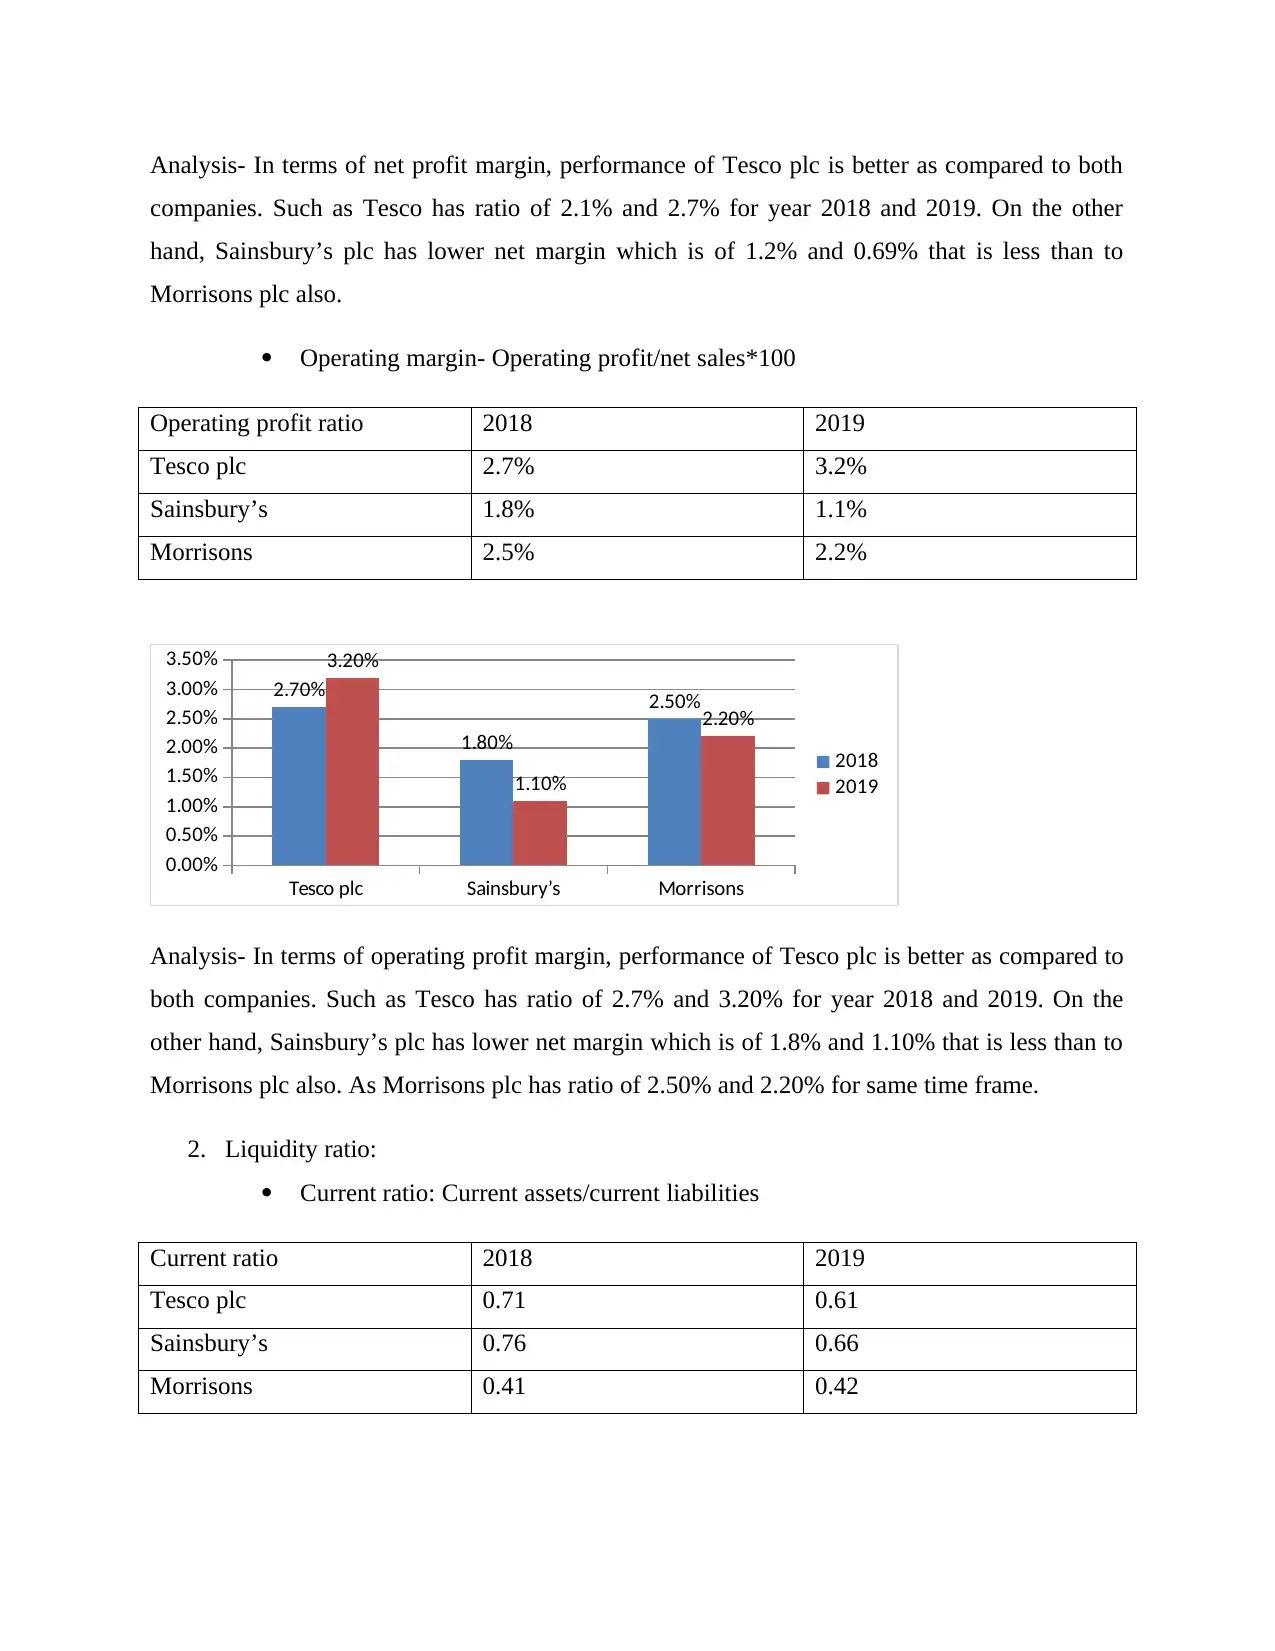
Analysis- In terms of net profit margin, performance of Tesco plc is better as compared to both
companies. Such as Tesco has ratio of 2.1% and 2.7% for year 2018 and 2019. On the other
hand, Sainsbury’s plc has lower net margin which is of 1.2% and 0.69% that is less than to
Morrisons plc also.
Operating margin- Operating profit/net sales*100
Operating profit ratio 2018 2019
Tesco plc 2.7% 3.2%
Sainsbury’s 1.8% 1.1%
Morrisons 2.5% 2.2%
Tesco plc Sainsbury’s Morrisons
0.00%
0.50%
1.00%
1.50%
2.00%
2.50%
3.00%
3.50%
2.70%
1.80%
2.50%
3.20%
1.10%
2.20%
2018
2019
Analysis- In terms of operating profit margin, performance of Tesco plc is better as compared to
both companies. Such as Tesco has ratio of 2.7% and 3.20% for year 2018 and 2019. On the
other hand, Sainsbury’s plc has lower net margin which is of 1.8% and 1.10% that is less than to
Morrisons plc also. As Morrisons plc has ratio of 2.50% and 2.20% for same time frame.
2. Liquidity ratio:
Current ratio: Current assets/current liabilities
Current ratio 2018 2019
Tesco plc 0.71 0.61
Sainsbury’s 0.76 0.66
Morrisons 0.41 0.42
Tesco plc Sainsbury’s Morrisons
0
0.1
0.2
0.3
0.4
0.5
0.6
0.7
0.8 0.71 0.76
0.41
0.61 0.66
0.42 2018
2019
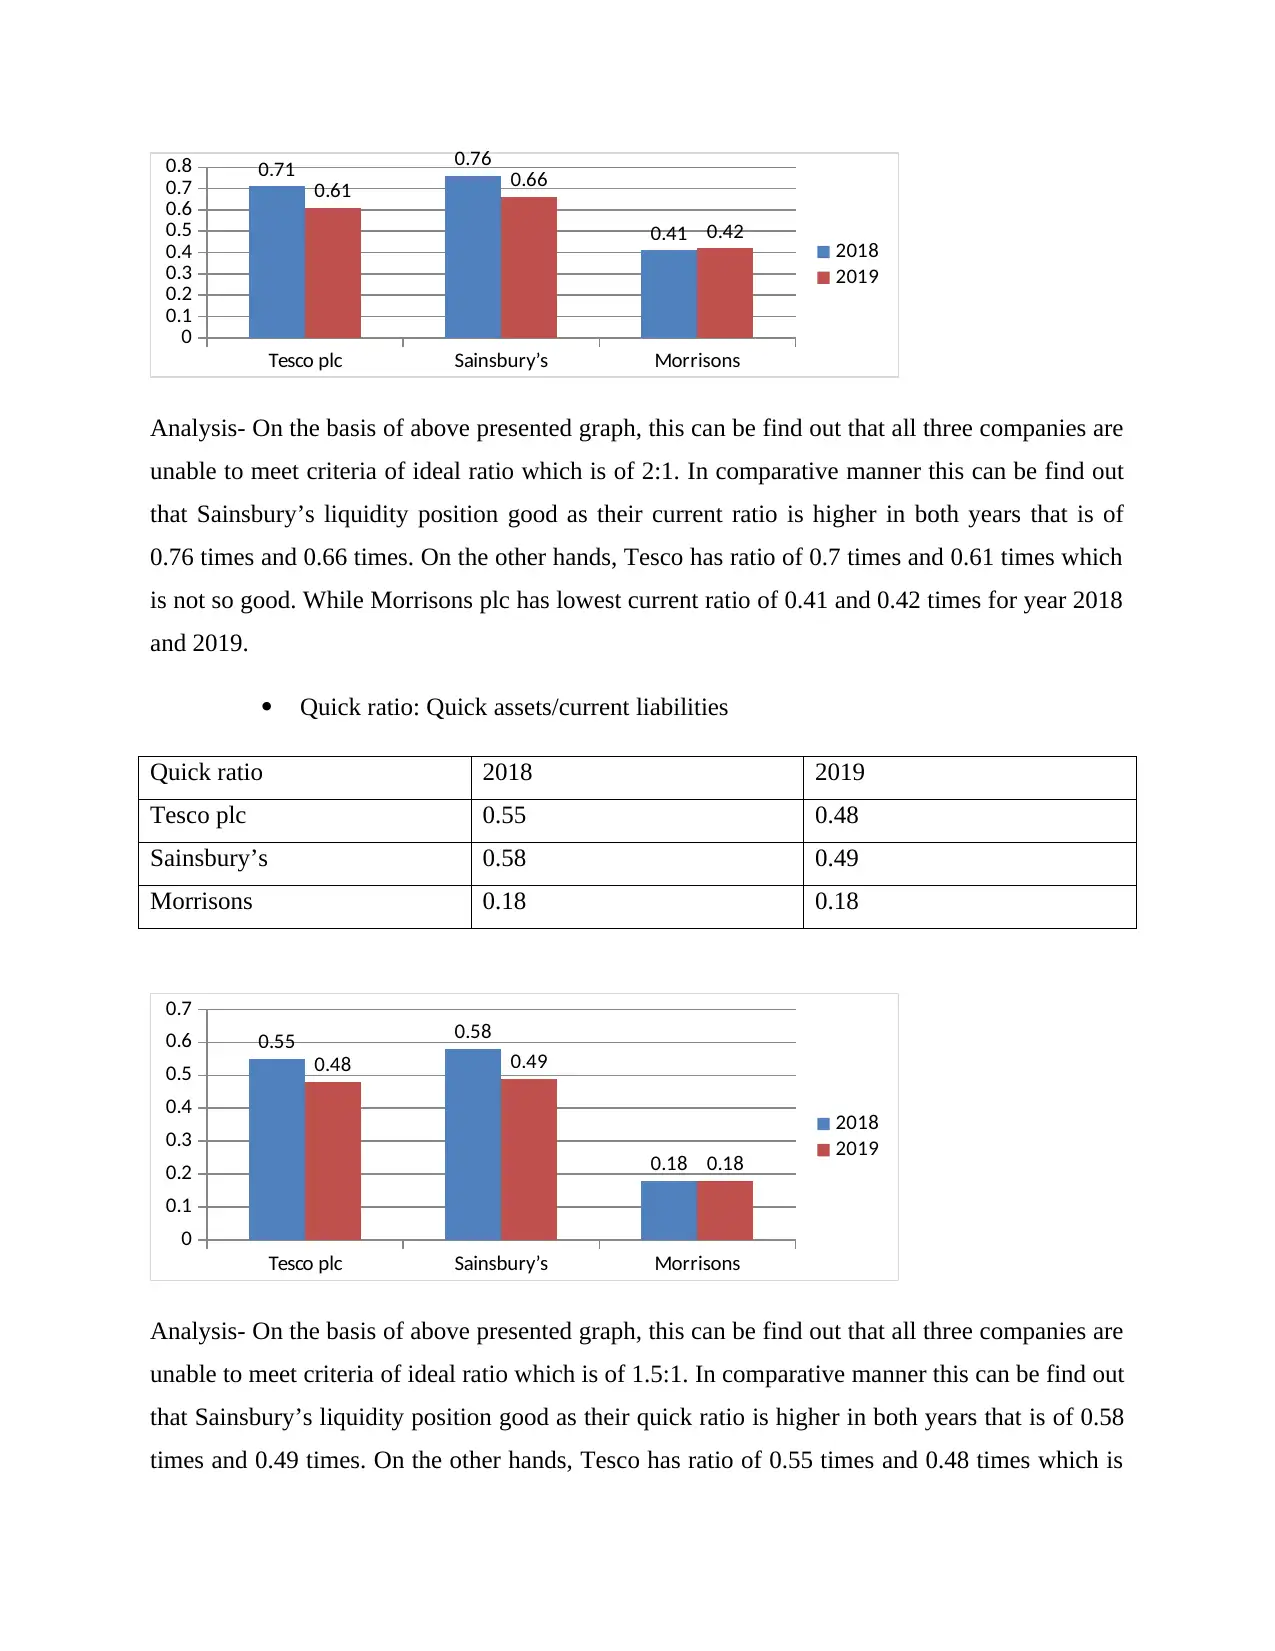
Analysis- On the basis of above presented graph, this can be find out that all three companies are
unable to meet criteria of ideal ratio which is of 2:1. In comparative manner this can be find out
that Sainsbury’s liquidity position good as their current ratio is higher in both years that is of
0.76 times and 0.66 times. On the other hands, Tesco has ratio of 0.7 times and 0.61 times which
is not so good. While Morrisons plc has lowest current ratio of 0.41 and 0.42 times for year 2018
and 2019.
Quick ratio: Quick assets/current liabilities
Quick ratio 2018 2019
Tesco plc 0.55 0.48
Sainsbury’s 0.58 0.49
Morrisons 0.18 0.18
Tesco plc Sainsbury’s Morrisons
0
0.1
0.2
0.3
0.4
0.5
0.6
0.7
0.55 0.58
0.18
0.48 0.49
0.18
2018
2019
Analysis- On the basis of above presented graph, this can be find out that all three companies are
unable to meet criteria of ideal ratio which is of 1.5:1. In comparative manner this can be find out
that Sainsbury’s liquidity position good as their quick ratio is higher in both years that is of 0.58
times and 0.49 times. On the other hands, Tesco has ratio of 0.55 times and 0.48 times which is
0
0.1
0.2
0.3
0.4
0.5
0.6
0.7
0.8 0.71 0.76
0.41
0.61 0.66
0.42 2018
2019
Analysis- On the basis of above presented graph, this can be find out that all three companies are
unable to meet criteria of ideal ratio which is of 2:1. In comparative manner this can be find out
that Sainsbury’s liquidity position good as their current ratio is higher in both years that is of
0.76 times and 0.66 times. On the other hands, Tesco has ratio of 0.7 times and 0.61 times which
is not so good. While Morrisons plc has lowest current ratio of 0.41 and 0.42 times for year 2018
and 2019.
Quick ratio: Quick assets/current liabilities
Quick ratio 2018 2019
Tesco plc 0.55 0.48
Sainsbury’s 0.58 0.49
Morrisons 0.18 0.18
Tesco plc Sainsbury’s Morrisons
0
0.1
0.2
0.3
0.4
0.5
0.6
0.7
0.55 0.58
0.18
0.48 0.49
0.18
2018
2019
Analysis- On the basis of above presented graph, this can be find out that all three companies are
unable to meet criteria of ideal ratio which is of 1.5:1. In comparative manner this can be find out
that Sainsbury’s liquidity position good as their quick ratio is higher in both years that is of 0.58
times and 0.49 times. On the other hands, Tesco has ratio of 0.55 times and 0.48 times which is
⊘ This is a preview!⊘
Do you want full access?
Subscribe today to unlock all pages.
Trusted by 1+ million students worldwide
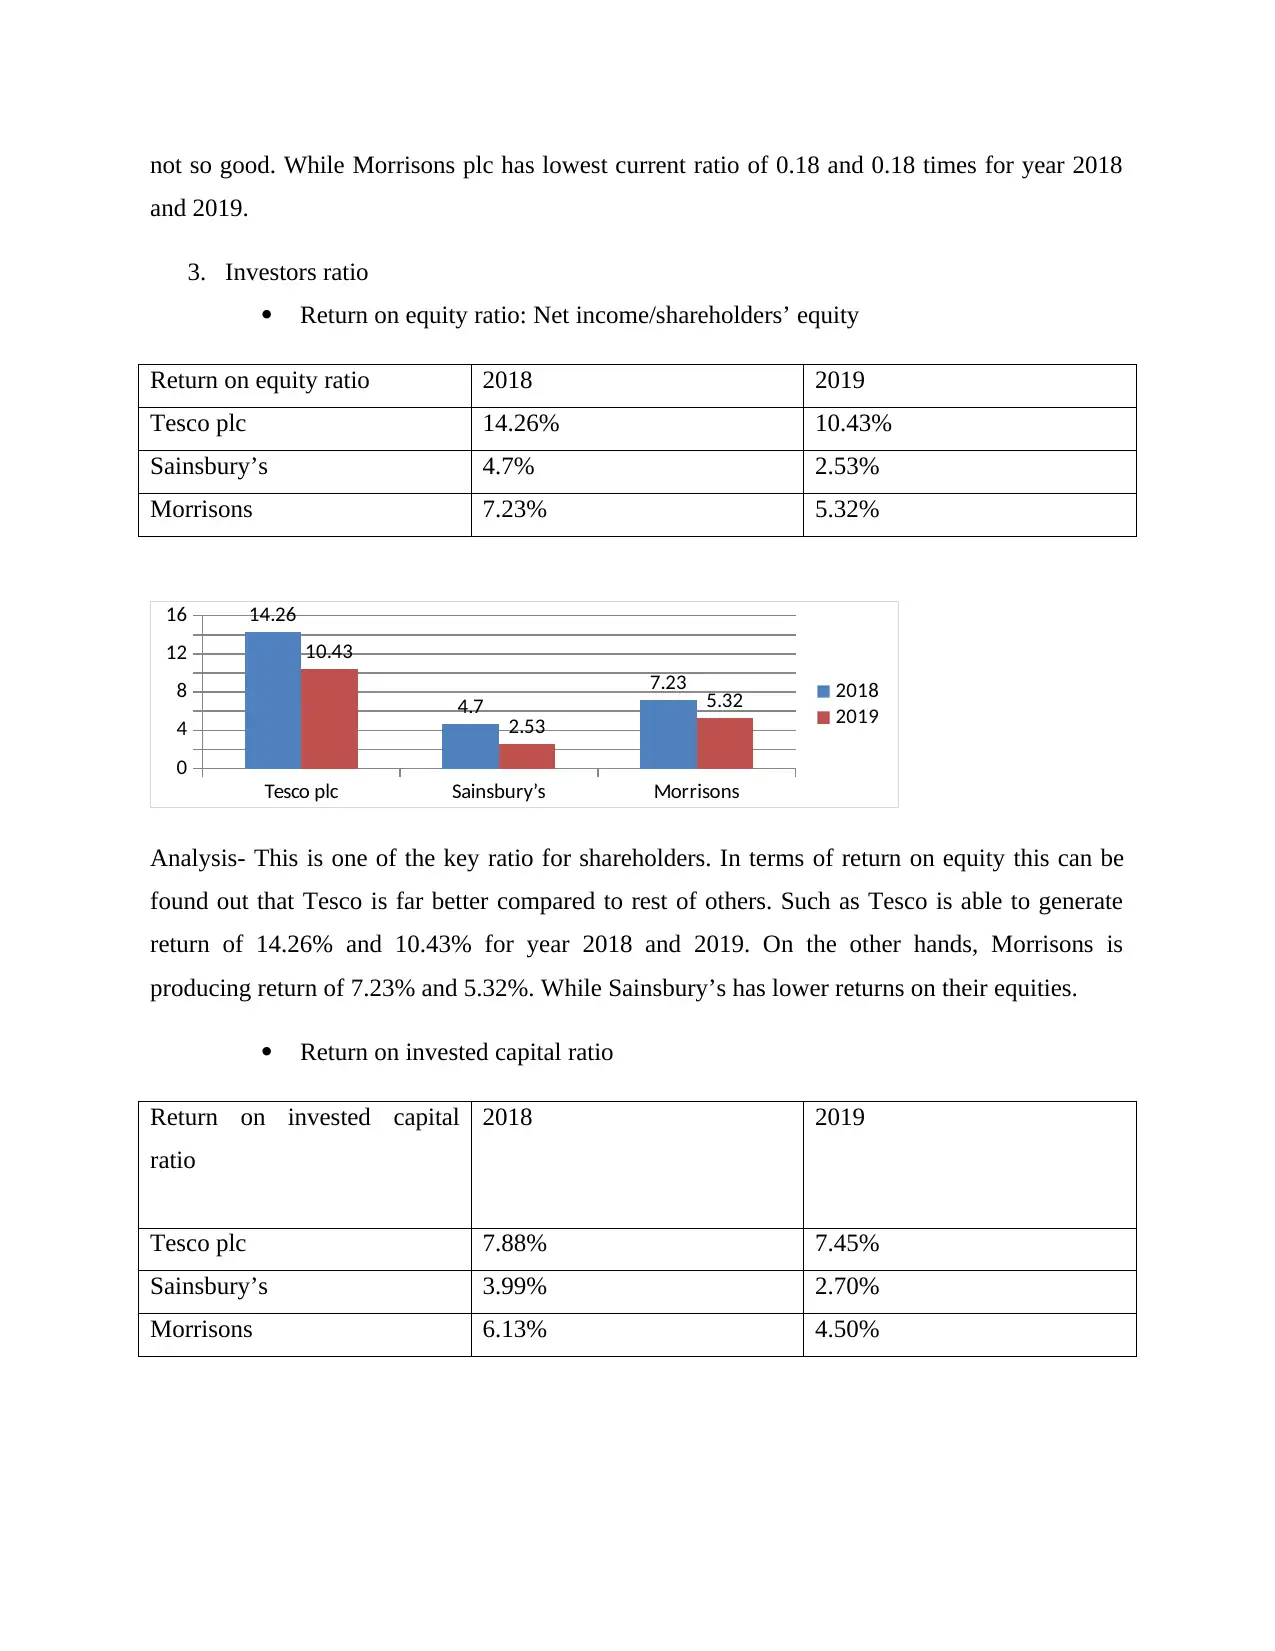
not so good. While Morrisons plc has lowest current ratio of 0.18 and 0.18 times for year 2018
and 2019.
3. Investors ratio
Return on equity ratio: Net income/shareholders’ equity
Return on equity ratio 2018 2019
Tesco plc 14.26% 10.43%
Sainsbury’s 4.7% 2.53%
Morrisons 7.23% 5.32%
Tesco plc Sainsbury’s Morrisons
0
4
8
12
16 14.26
4.7
7.23
10.43
2.53
5.32 2018
2019
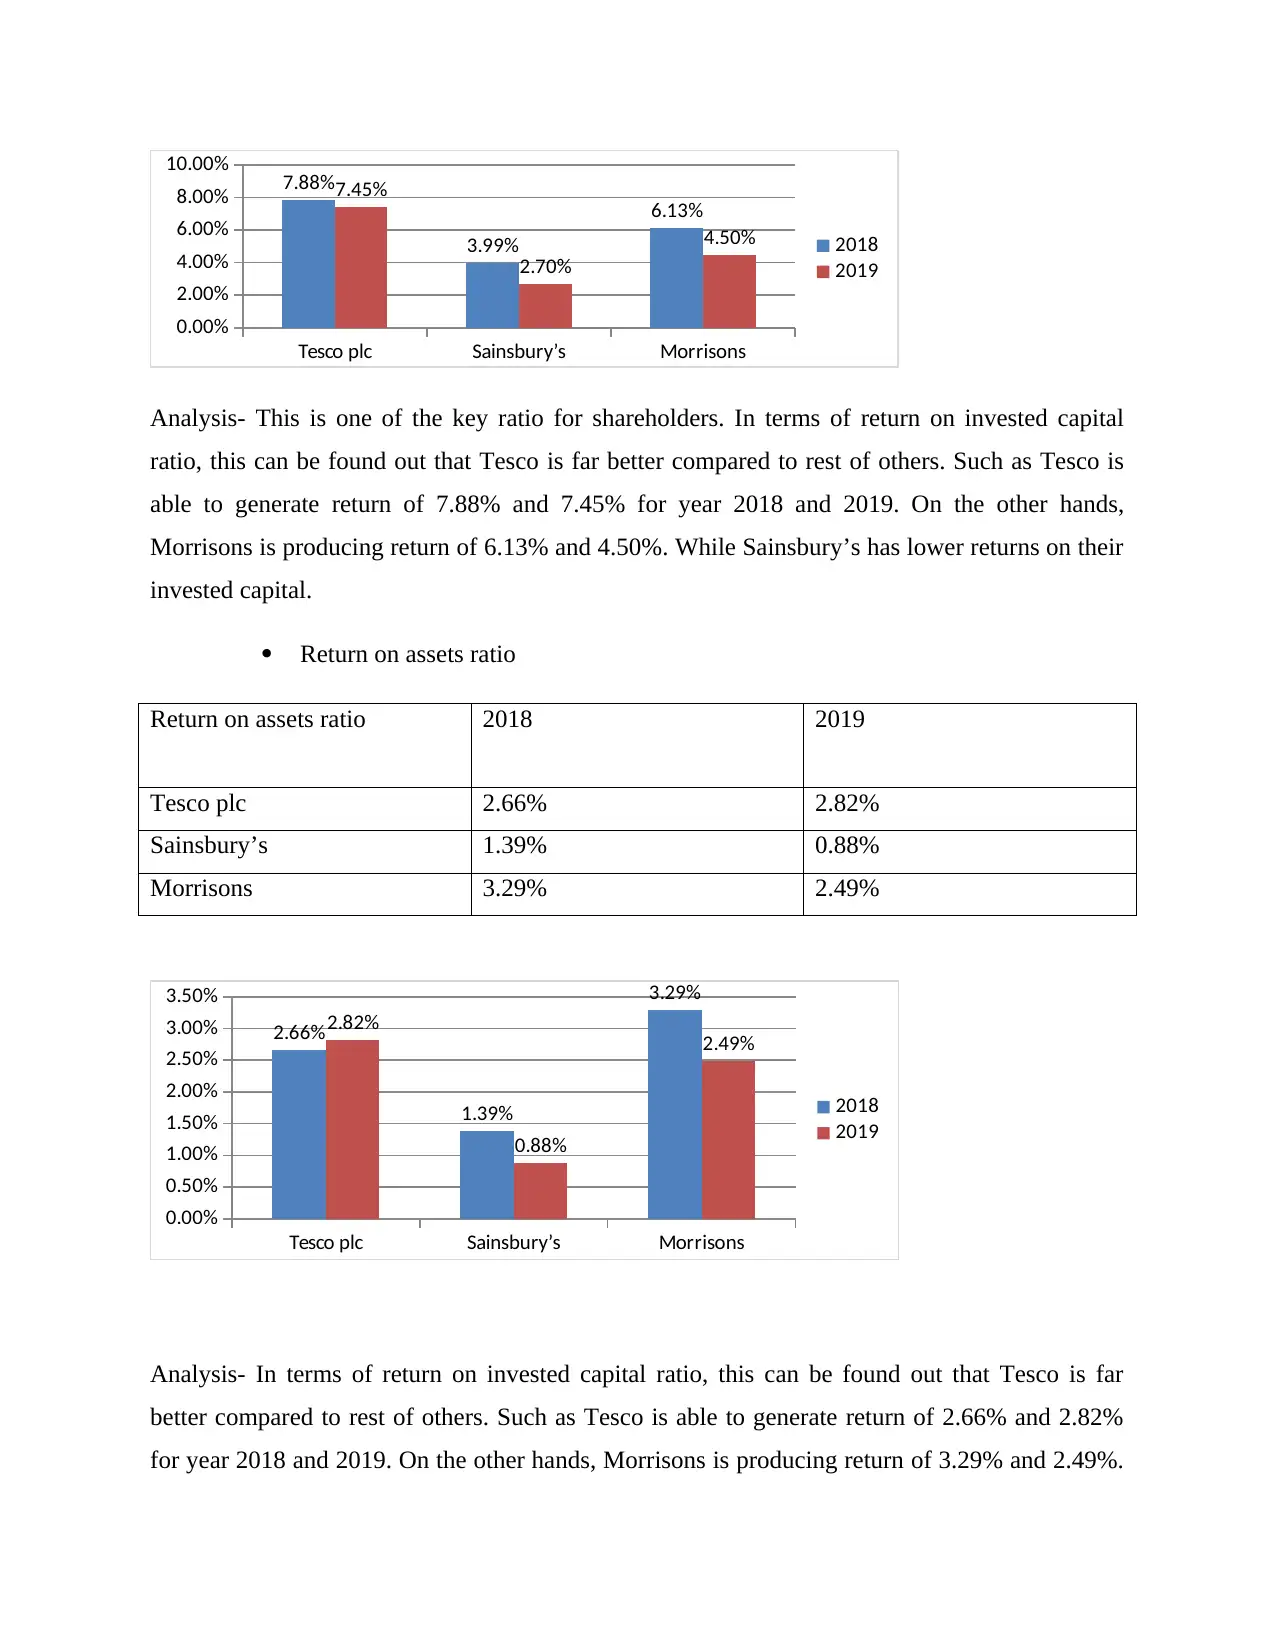
Analysis- This is one of the key ratio for shareholders. In terms of return on equity this can be
found out that Tesco is far better compared to rest of others. Such as Tesco is able to generate
return of 14.26% and 10.43% for year 2018 and 2019. On the other hands, Morrisons is
producing return of 7.23% and 5.32%. While Sainsbury’s has lower returns on their equities.
Return on invested capital ratio
Return on invested capital
ratio
2018 2019
Tesco plc 7.88% 7.45%
Sainsbury’s 3.99% 2.70%
Morrisons 6.13% 4.50%
and 2019.
3. Investors ratio
Return on equity ratio: Net income/shareholders’ equity
Return on equity ratio 2018 2019
Tesco plc 14.26% 10.43%
Sainsbury’s 4.7% 2.53%
Morrisons 7.23% 5.32%
Tesco plc Sainsbury’s Morrisons
0
4
8
12
16 14.26
4.7
7.23
10.43
2.53
5.32 2018
2019
Analysis- This is one of the key ratio for shareholders. In terms of return on equity this can be
found out that Tesco is far better compared to rest of others. Such as Tesco is able to generate
return of 14.26% and 10.43% for year 2018 and 2019. On the other hands, Morrisons is
producing return of 7.23% and 5.32%. While Sainsbury’s has lower returns on their equities.
Return on invested capital ratio
Return on invested capital
ratio
2018 2019
Tesco plc 7.88% 7.45%
Sainsbury’s 3.99% 2.70%
Morrisons 6.13% 4.50%
Paraphrase This Document
Need a fresh take? Get an instant paraphrase of this document with our AI Paraphraser
Tesco plc Sainsbury’s Morrisons
0.00%
2.00%
4.00%
6.00%
8.00%
10.00% 7.88%
3.99%
6.13%
7.45%
2.70%
4.50% 2018
2019
Analysis- This is one of the key ratio for shareholders. In terms of return on invested capital
ratio, this can be found out that Tesco is far better compared to rest of others. Such as Tesco is
able to generate return of 7.88% and 7.45% for year 2018 and 2019. On the other hands,
Morrisons is producing return of 6.13% and 4.50%. While Sainsbury’s has lower returns on their
invested capital.
Return on assets ratio
Return on assets ratio 2018 2019
Tesco plc 2.66% 2.82%
Sainsbury’s 1.39% 0.88%
Morrisons 3.29% 2.49%
Tesco plc Sainsbury’s Morrisons
0.00%
0.50%
1.00%
1.50%
2.00%
2.50%
3.00%
3.50%
2.66%
1.39%
3.29%
2.82%
0.88%
2.49%
2018
2019
Analysis- In terms of return on invested capital ratio, this can be found out that Tesco is far
better compared to rest of others. Such as Tesco is able to generate return of 2.66% and 2.82%
for year 2018 and 2019. On the other hands, Morrisons is producing return of 3.29% and 2.49%.
0.00%
2.00%
4.00%
6.00%
8.00%
10.00% 7.88%
3.99%
6.13%
7.45%
2.70%
4.50% 2018
2019
Analysis- This is one of the key ratio for shareholders. In terms of return on invested capital
ratio, this can be found out that Tesco is far better compared to rest of others. Such as Tesco is
able to generate return of 7.88% and 7.45% for year 2018 and 2019. On the other hands,
Morrisons is producing return of 6.13% and 4.50%. While Sainsbury’s has lower returns on their
invested capital.
Return on assets ratio
Return on assets ratio 2018 2019
Tesco plc 2.66% 2.82%
Sainsbury’s 1.39% 0.88%
Morrisons 3.29% 2.49%
Tesco plc Sainsbury’s Morrisons
0.00%
0.50%
1.00%
1.50%
2.00%
2.50%
3.00%
3.50%
2.66%
1.39%
3.29%
2.82%
0.88%
2.49%
2018
2019
Analysis- In terms of return on invested capital ratio, this can be found out that Tesco is far
better compared to rest of others. Such as Tesco is able to generate return of 2.66% and 2.82%
for year 2018 and 2019. On the other hands, Morrisons is producing return of 3.29% and 2.49%.
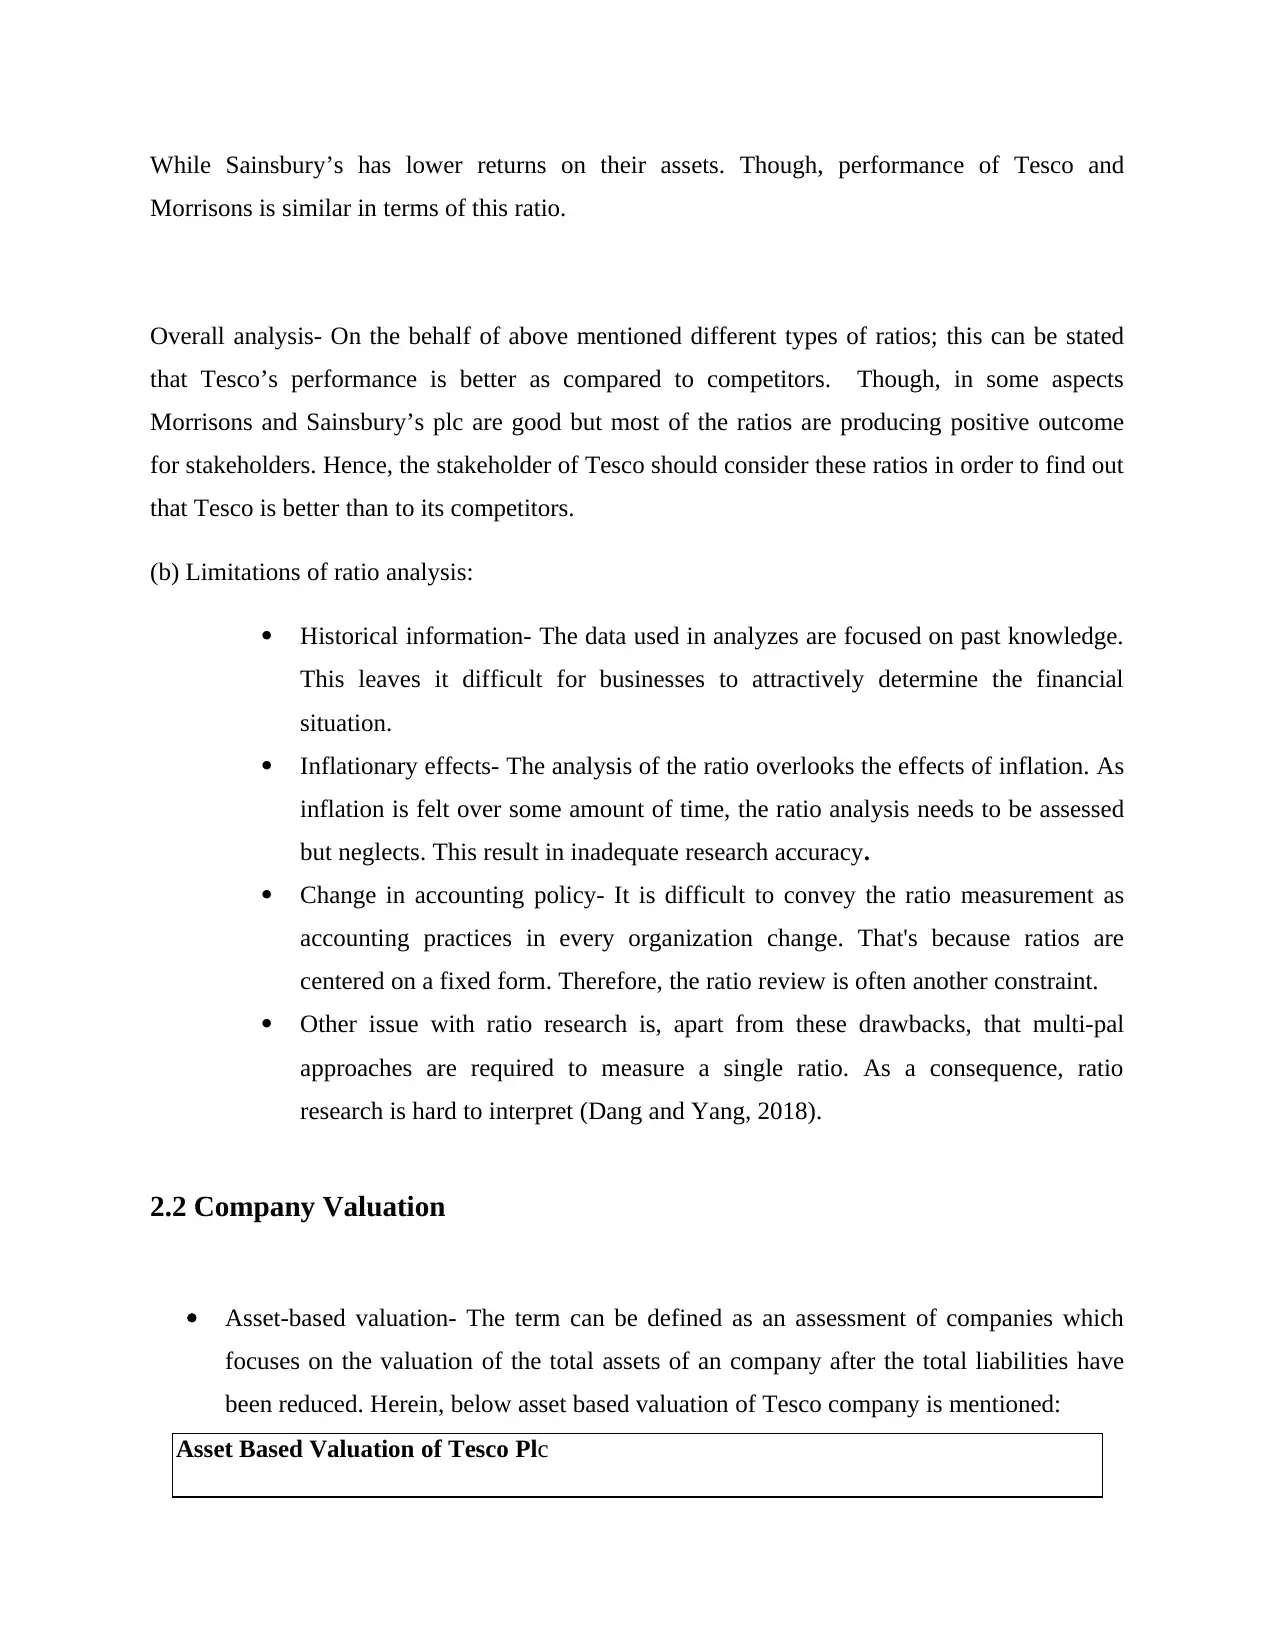
While Sainsbury’s has lower returns on their assets. Though, performance of Tesco and
Morrisons is similar in terms of this ratio.
Overall analysis- On the behalf of above mentioned different types of ratios; this can be stated
that Tesco’s performance is better as compared to competitors. Though, in some aspects
Morrisons and Sainsbury’s plc are good but most of the ratios are producing positive outcome
for stakeholders. Hence, the stakeholder of Tesco should consider these ratios in order to find out
that Tesco is better than to its competitors.
(b) Limitations of ratio analysis:
Historical information- The data used in analyzes are focused on past knowledge.
This leaves it difficult for businesses to attractively determine the financial
situation.
Inflationary effects- The analysis of the ratio overlooks the effects of inflation. As
inflation is felt over some amount of time, the ratio analysis needs to be assessed
but neglects. This result in inadequate research accuracy.
Change in accounting policy- It is difficult to convey the ratio measurement as
accounting practices in every organization change. That's because ratios are
centered on a fixed form. Therefore, the ratio review is often another constraint.
Other issue with ratio research is, apart from these drawbacks, that multi-pal
approaches are required to measure a single ratio. As a consequence, ratio
research is hard to interpret (Dang and Yang, 2018).
2.2 Company Valuation
Asset-based valuation- The term can be defined as an assessment of companies which
focuses on the valuation of the total assets of an company after the total liabilities have
been reduced. Herein, below asset based valuation of Tesco company is mentioned:
Asset Based Valuation of Tesco Plc
⊘ This is a preview!⊘
Do you want full access?
Subscribe today to unlock all pages.
Trusted by 1+ million students worldwide
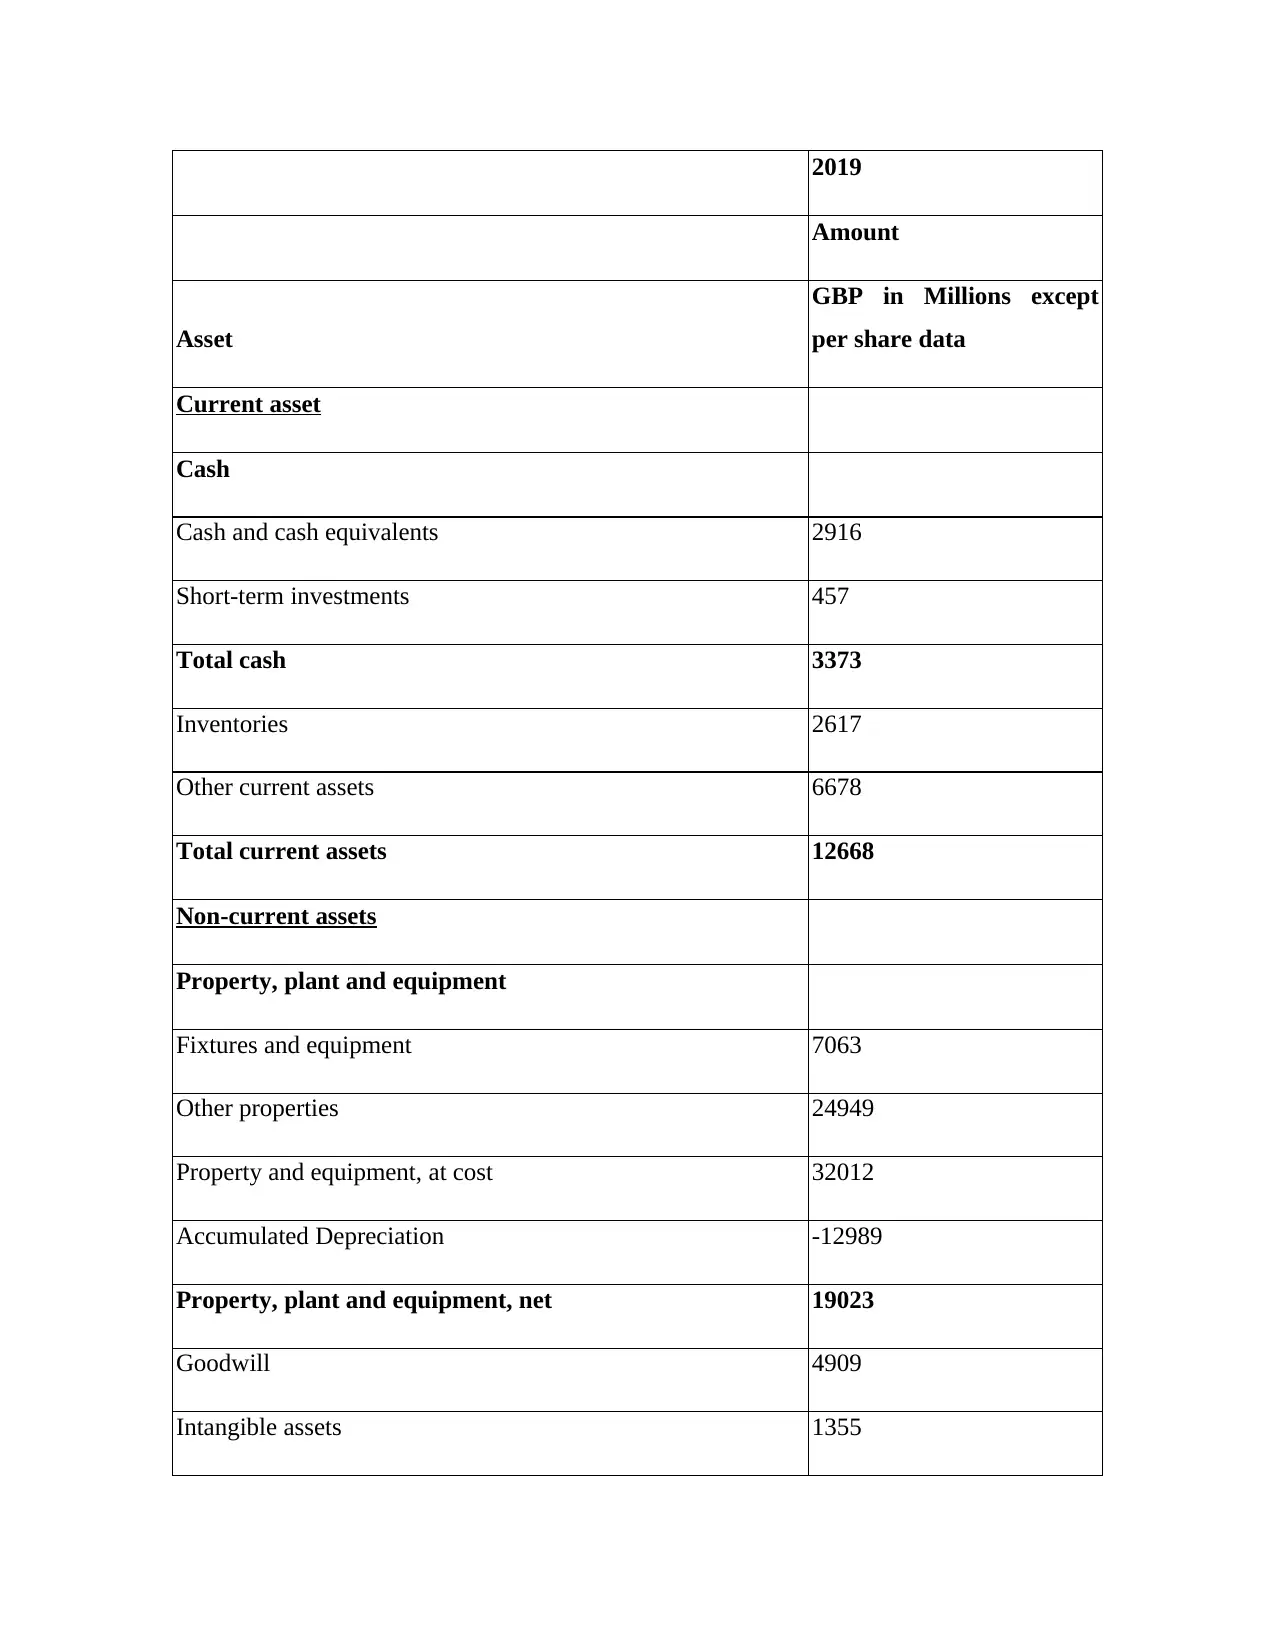
2019
Amount
Asset
GBP in Millions except
per share data
Current asset
Cash
Cash and cash equivalents 2916
Short-term investments 457
Total cash 3373
Inventories 2617
Other current assets 6678
Total current assets 12668
Non-current assets
Property, plant and equipment
Fixtures and equipment 7063
Other properties 24949
Property and equipment, at cost 32012
Accumulated Depreciation -12989
Property, plant and equipment, net 19023
Goodwill 4909
Intangible assets 1355
Paraphrase This Document
Need a fresh take? Get an instant paraphrase of this document with our AI Paraphraser
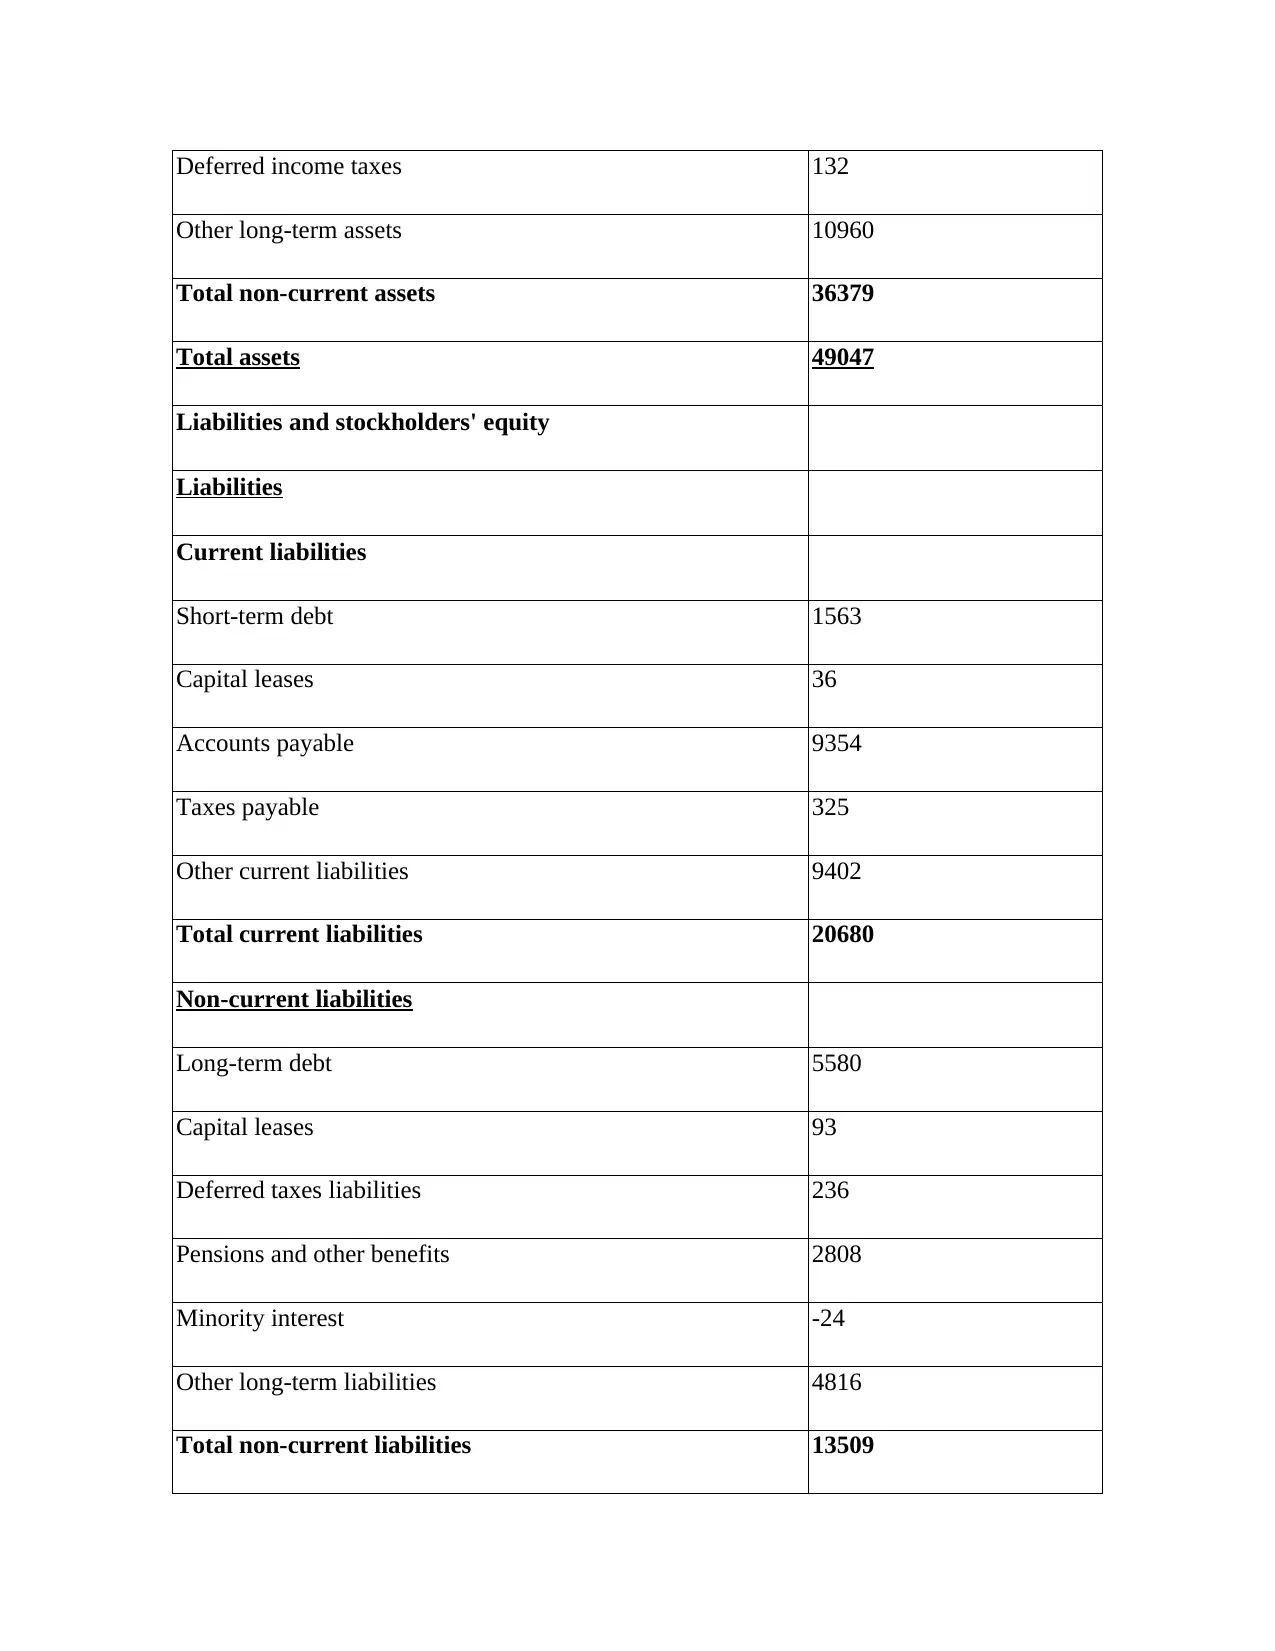
Deferred income taxes 132
Other long-term assets 10960
Total non-current assets 36379
Total assets 49047
Liabilities and stockholders' equity
Liabilities
Current liabilities
Short-term debt 1563
Capital leases 36
Accounts payable 9354
Taxes payable 325
Other current liabilities 9402
Total current liabilities 20680
Non-current liabilities
Long-term debt 5580
Capital leases 93
Deferred taxes liabilities 236
Pensions and other benefits 2808
Minority interest -24
Other long-term liabilities 4816
Total non-current liabilities 13509
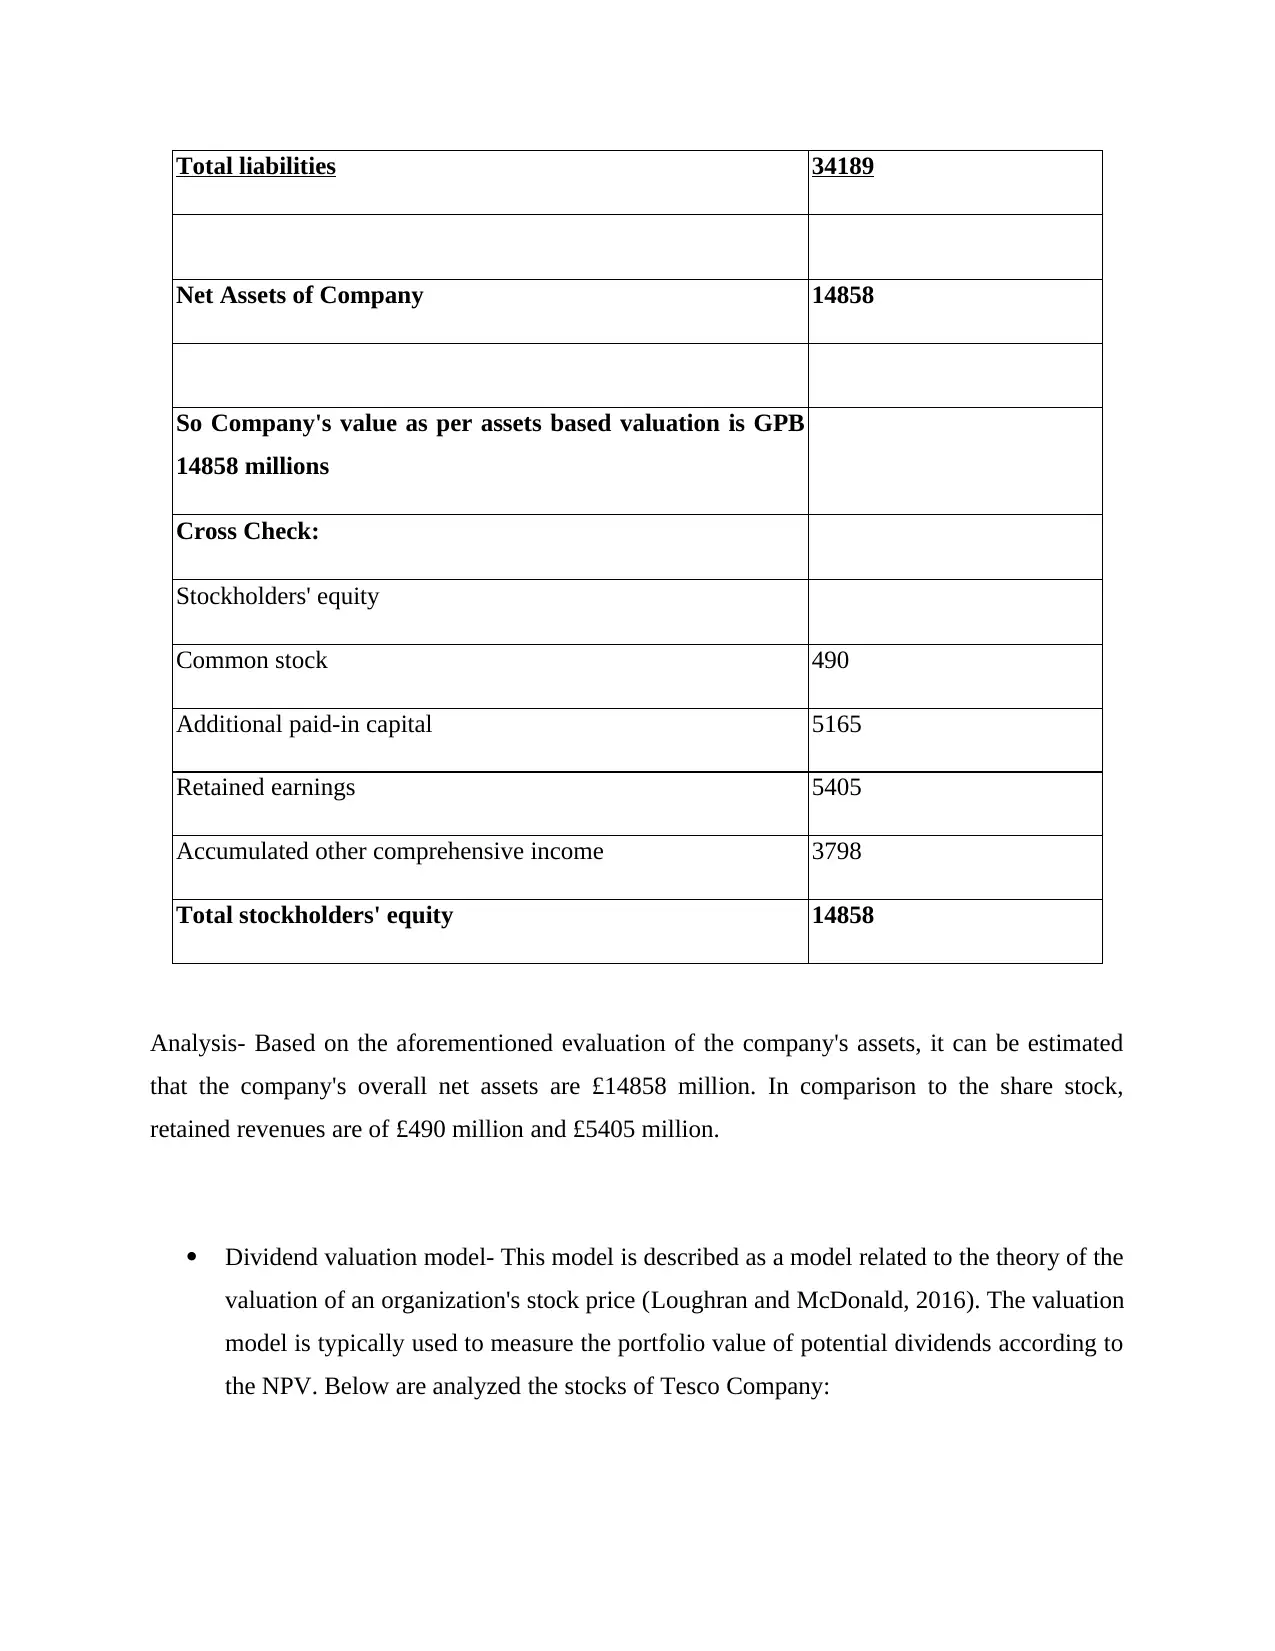
Total liabilities 34189
Net Assets of Company 14858
So Company's value as per assets based valuation is GPB
14858 millions
Cross Check:
Stockholders' equity
Common stock 490
Additional paid-in capital 5165
Retained earnings 5405
Accumulated other comprehensive income 3798
Total stockholders' equity 14858
Analysis- Based on the aforementioned evaluation of the company's assets, it can be estimated
that the company's overall net assets are £14858 million. In comparison to the share stock,
retained revenues are of £490 million and £5405 million.
Dividend valuation model- This model is described as a model related to the theory of the
valuation of an organization's stock price (Loughran and McDonald, 2016). The valuation
model is typically used to measure the portfolio value of potential dividends according to
the NPV. Below are analyzed the stocks of Tesco Company:
⊘ This is a preview!⊘
Do you want full access?
Subscribe today to unlock all pages.
Trusted by 1+ million students worldwide
1 out of 18
Related Documents


Your All-in-One AI-Powered Toolkit for Academic Success.
+13062052269
info@desklib.com
Available 24*7 on WhatsApp / Email
![[object Object]](/_next/static/media/star-bottom.7253800d.svg)
Unlock your academic potential
Copyright © 2020–2026 A2Z Services. All Rights Reserved. Developed and managed by ZUCOL.