Comprehensive Financial Ratio Analysis Report on Tesco PLC
VerifiedAdded on 2023/06/14
|16
|2660
|120
Report
AI Summary
This report provides a comprehensive financial ratio analysis of Tesco PLC from 2019 to 2021, evaluating the company's liquidity, profitability, leverage, and working capital. The analysis includes calculations and interpretations of key ratios such as current ratio, quick ratio, cash ratio, gross margin, operating margin, pre-tax margin, net profit margin, return on equity, return on assets, debt-to-equity ratio, debt-to-capital ratio, equity multiplier, and accounts receivable days. The report identifies areas of strength and weakness in Tesco's financial performance, noting the stability of gross profitability and the fluctuations in other key metrics. Based on the analysis, recommendations are provided for improving budgetary control mechanisms and overall financial management.

Introduction to Managing
Finance
Finance
Paraphrase This Document
Need a fresh take? Get an instant paraphrase of this document with our AI Paraphraser
Contents
EXECUTIVE SUMMARY.................................................................................................................................3
INTRODUCTION...........................................................................................................................................4
MAIN BODY.................................................................................................................................................4
Ratio Analysis...........................................................................................................................................4
Results of Ratio Analysis..........................................................................................................................6
Recommendations.................................................................................................................................12
CONCLUSION.............................................................................................................................................12
REFERENCES..............................................................................................................................................13
APPENDIX..................................................................................................................................................14
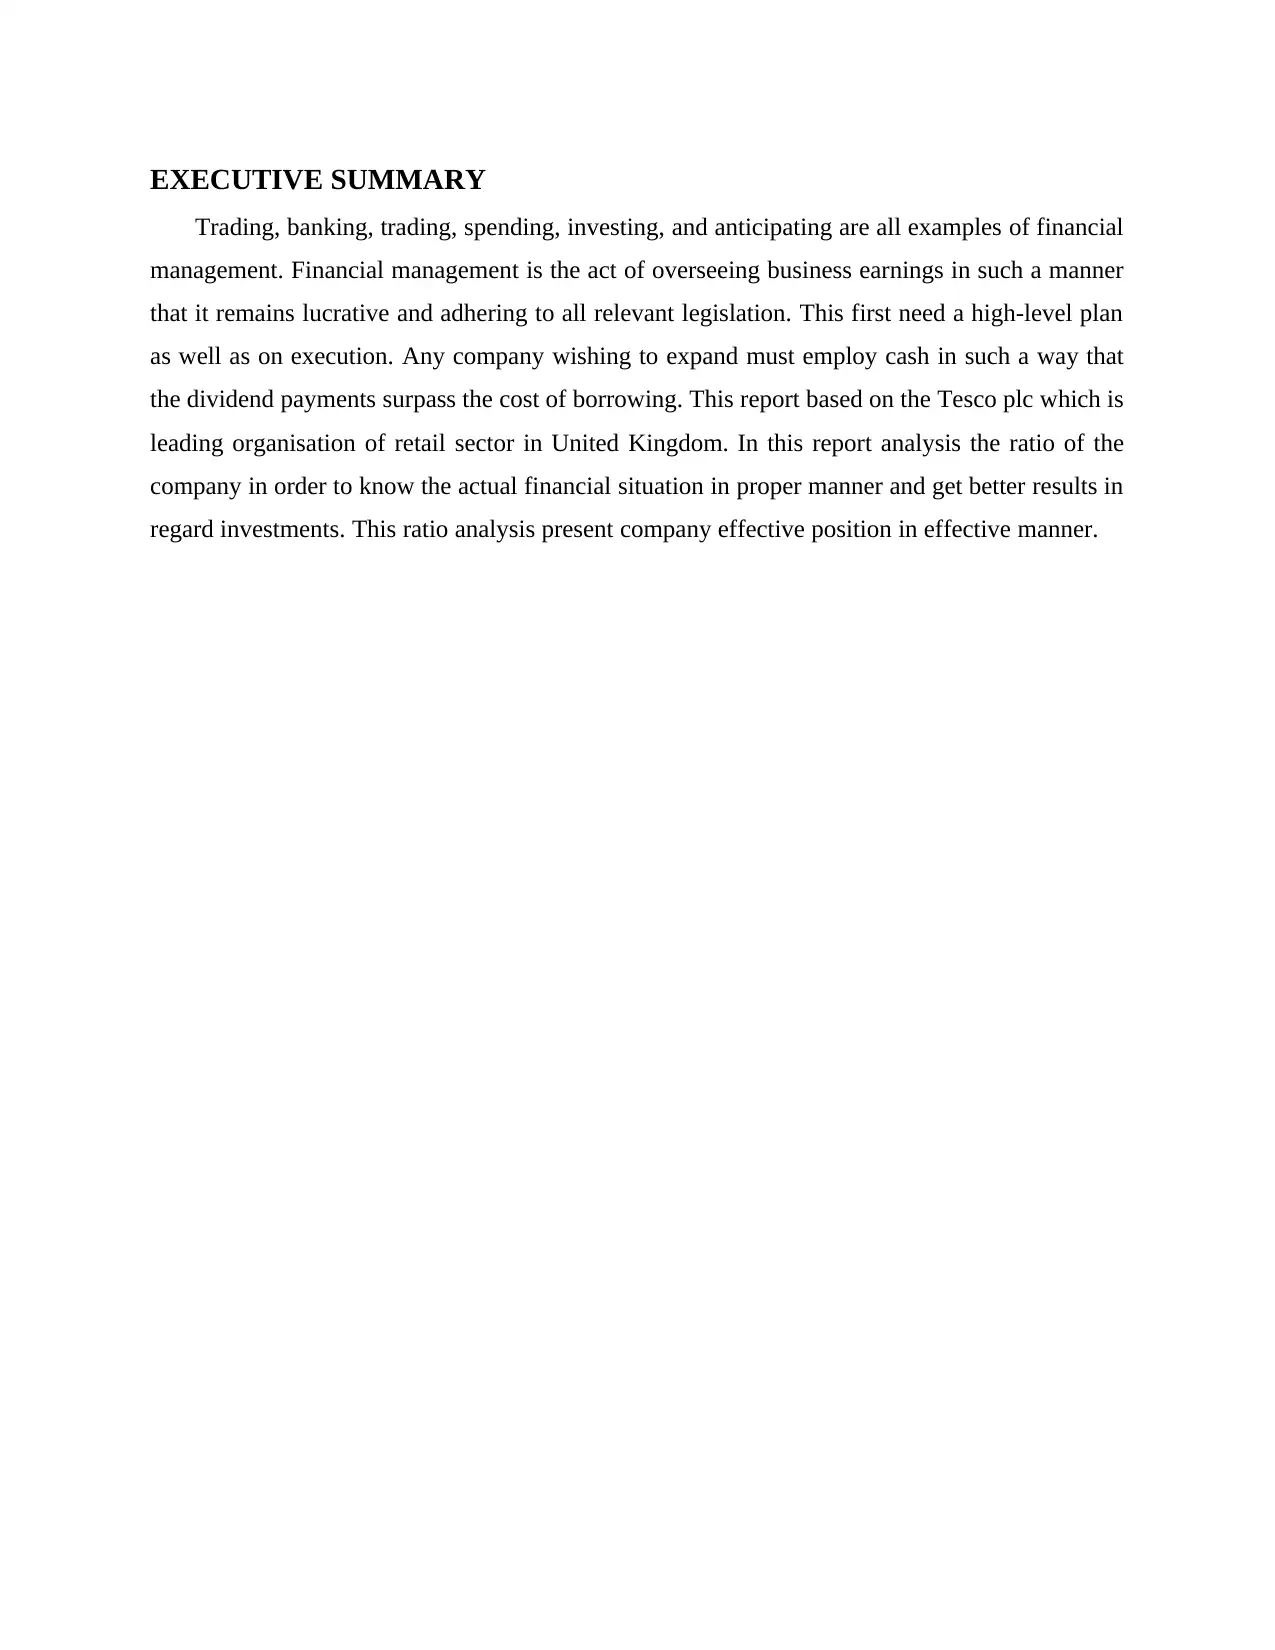
EXECUTIVE SUMMARY
Trading, banking, trading, spending, investing, and anticipating are all examples of financial
management. Financial management is the act of overseeing business earnings in such a manner
that it remains lucrative and adhering to all relevant legislation. This first need a high-level plan
as well as on execution. Any company wishing to expand must employ cash in such a way that
the dividend payments surpass the cost of borrowing. This report based on the Tesco plc which is
leading organisation of retail sector in United Kingdom. In this report analysis the ratio of the
company in order to know the actual financial situation in proper manner and get better results in
regard investments. This ratio analysis present company effective position in effective manner.
⊘ This is a preview!⊘
Do you want full access?
Subscribe today to unlock all pages.
Trusted by 1+ million students worldwide
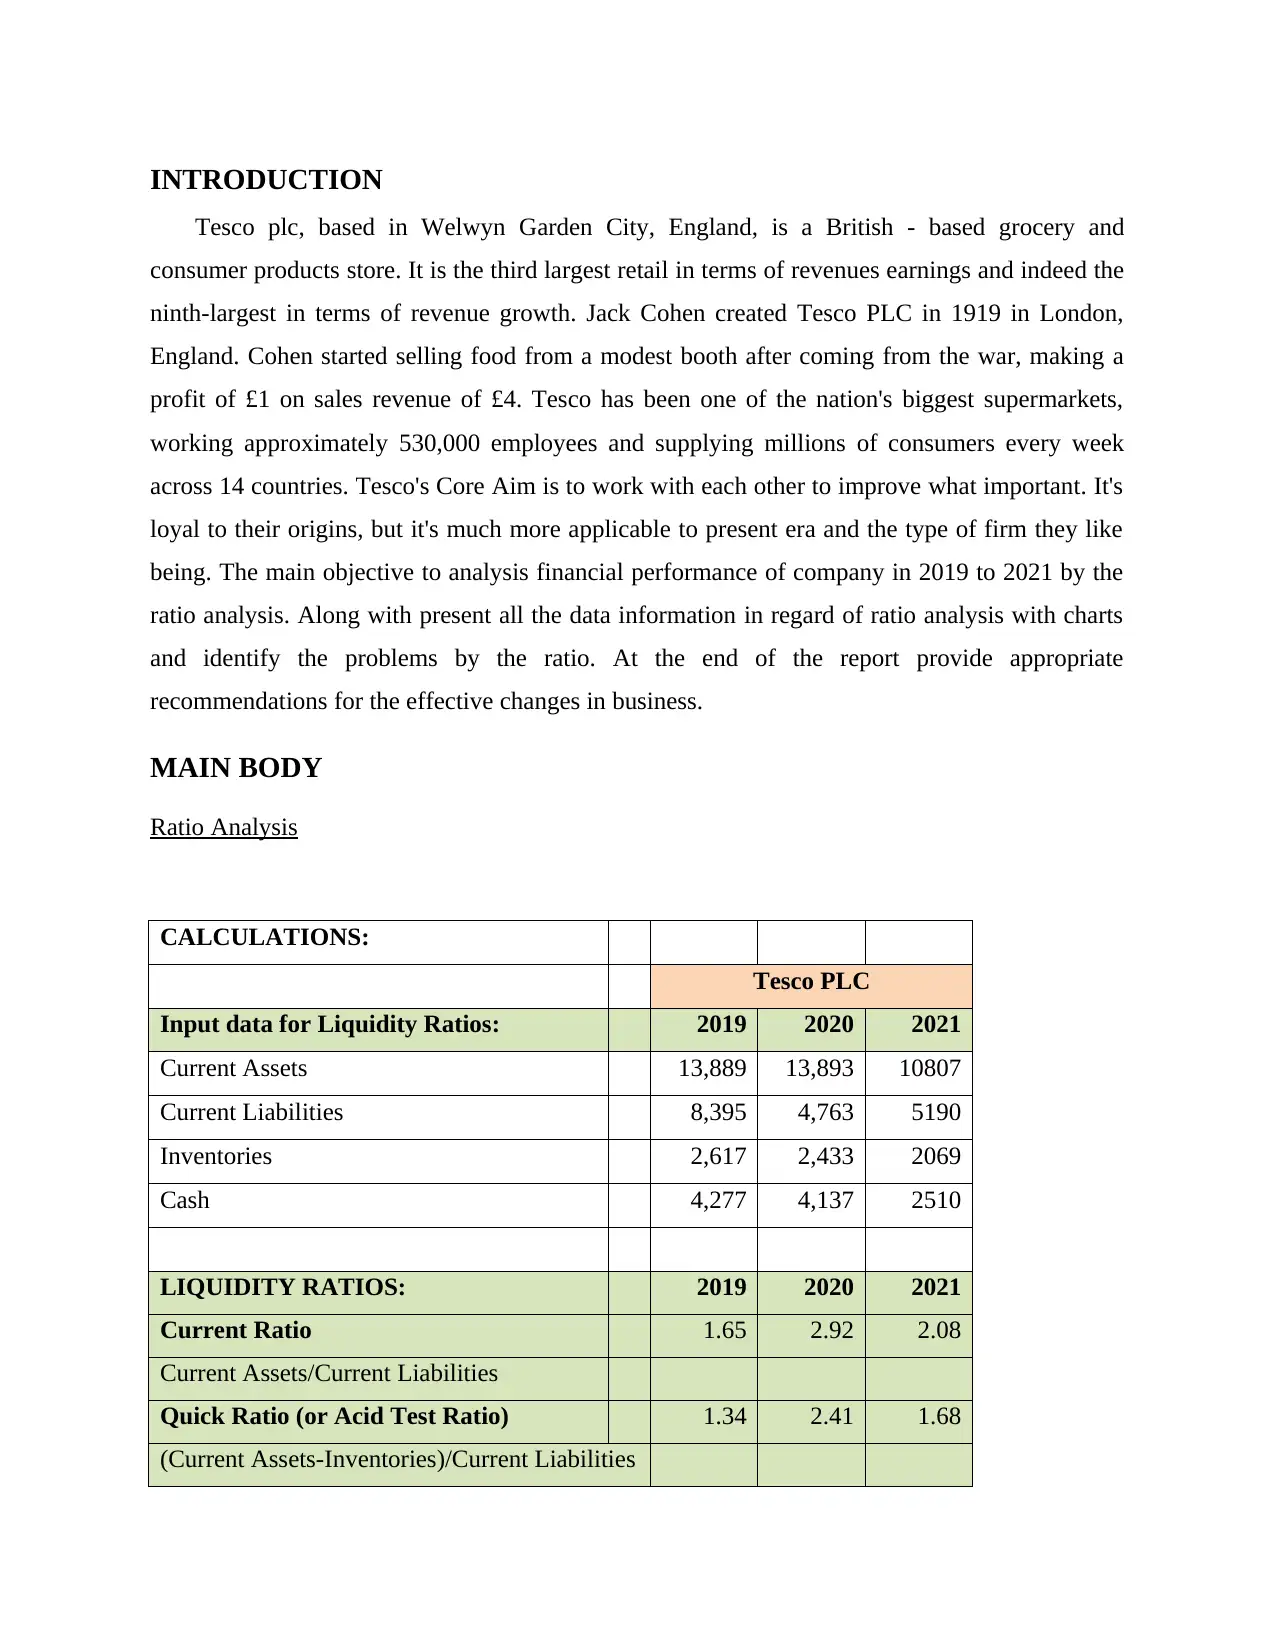
INTRODUCTION
Tesco plc, based in Welwyn Garden City, England, is a British - based grocery and
consumer products store. It is the third largest retail in terms of revenues earnings and indeed the
ninth-largest in terms of revenue growth. Jack Cohen created Tesco PLC in 1919 in London,
England. Cohen started selling food from a modest booth after coming from the war, making a
profit of £1 on sales revenue of £4. Tesco has been one of the nation's biggest supermarkets,
working approximately 530,000 employees and supplying millions of consumers every week
across 14 countries. Tesco's Core Aim is to work with each other to improve what important. It's
loyal to their origins, but it's much more applicable to present era and the type of firm they like
being. The main objective to analysis financial performance of company in 2019 to 2021 by the
ratio analysis. Along with present all the data information in regard of ratio analysis with charts
and identify the problems by the ratio. At the end of the report provide appropriate
recommendations for the effective changes in business.
MAIN BODY
Ratio Analysis
CALCULATIONS:
Tesco PLC
Input data for Liquidity Ratios: 2019 2020 2021
Current Assets 13,889 13,893 10807
Current Liabilities 8,395 4,763 5190
Inventories 2,617 2,433 2069
Cash 4,277 4,137 2510
LIQUIDITY RATIOS: 2019 2020 2021
Current Ratio 1.65 2.92 2.08
Current Assets/Current Liabilities
Quick Ratio (or Acid Test Ratio) 1.34 2.41 1.68
(Current Assets-Inventories)/Current Liabilities
Paraphrase This Document
Need a fresh take? Get an instant paraphrase of this document with our AI Paraphraser
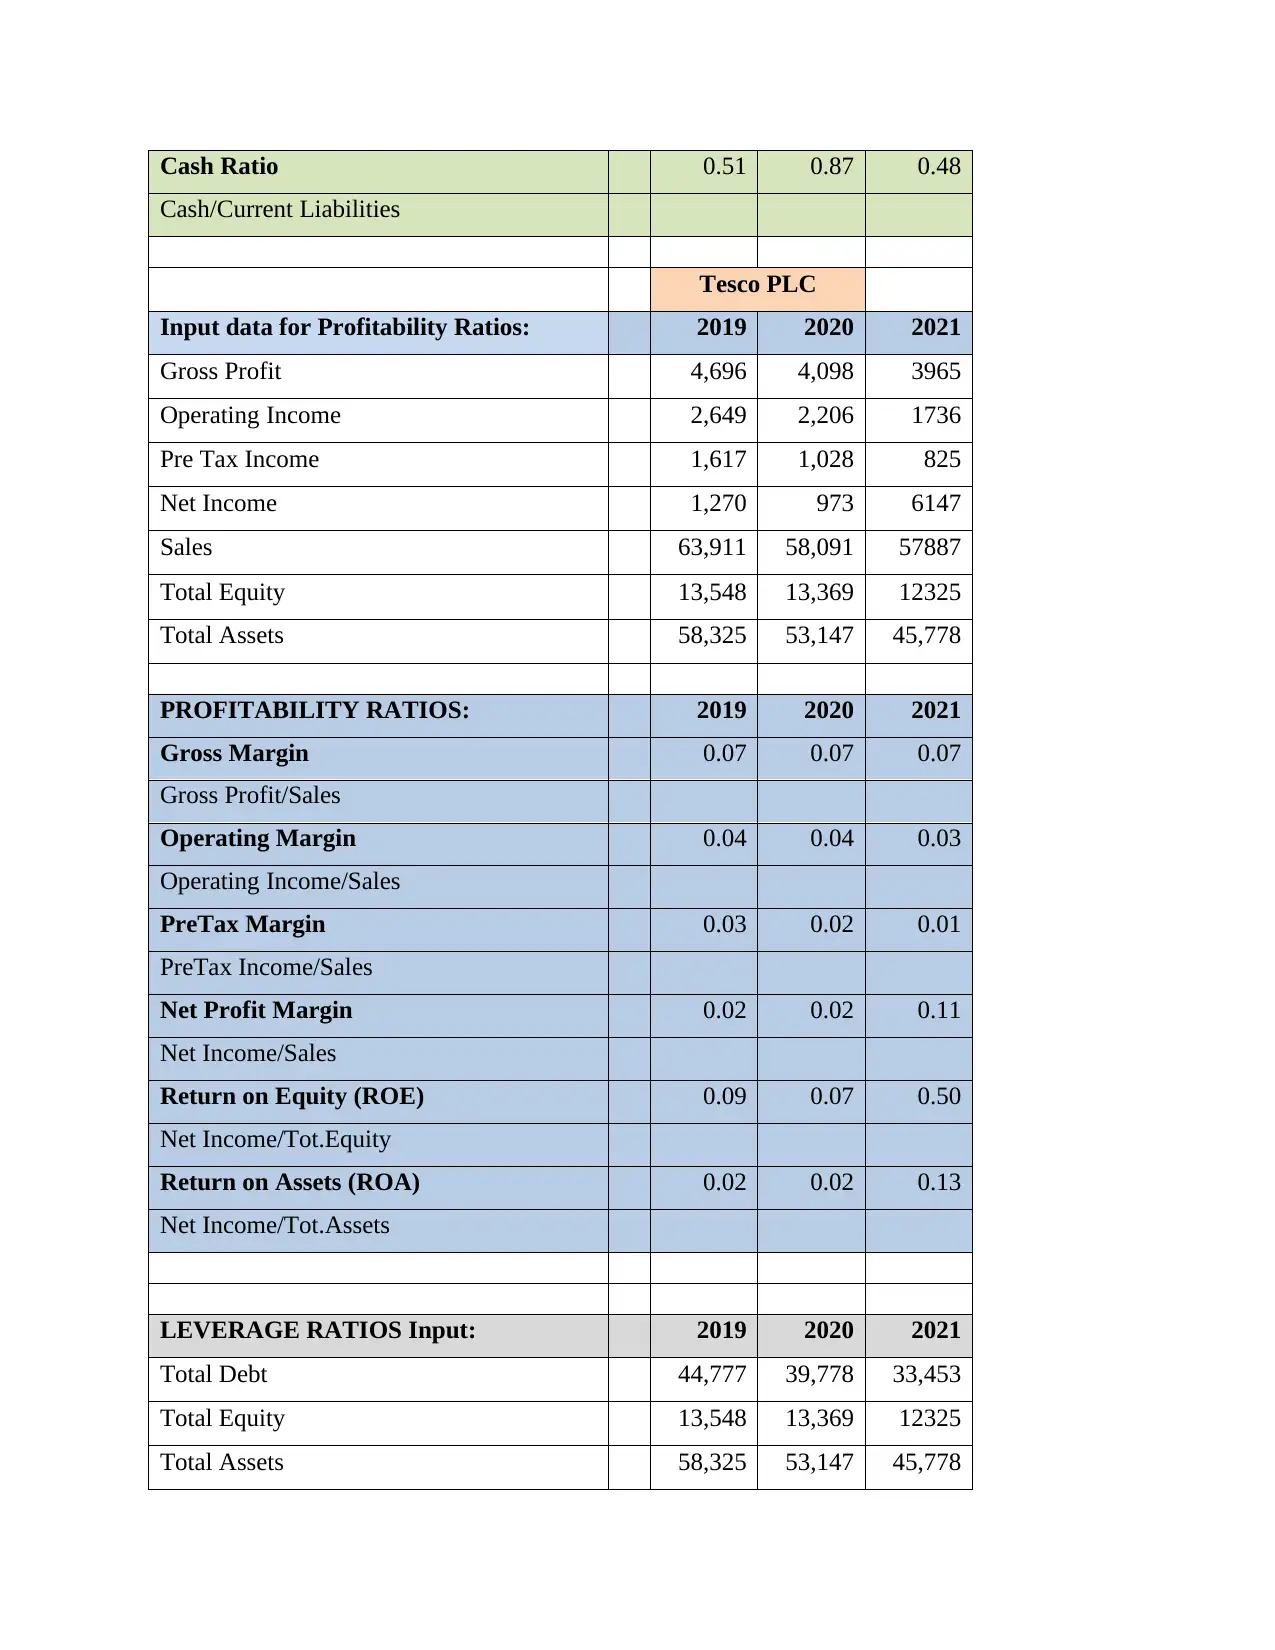
Cash Ratio 0.51 0.87 0.48
Cash/Current Liabilities
Tesco PLC
Input data for Profitability Ratios: 2019 2020 2021
Gross Profit 4,696 4,098 3965
Operating Income 2,649 2,206 1736
Pre Tax Income 1,617 1,028 825
Net Income 1,270 973 6147
Sales 63,911 58,091 57887
Total Equity 13,548 13,369 12325
Total Assets 58,325 53,147 45,778
PROFITABILITY RATIOS: 2019 2020 2021
Gross Margin 0.07 0.07 0.07
Gross Profit/Sales
Operating Margin 0.04 0.04 0.03
Operating Income/Sales
PreTax Margin 0.03 0.02 0.01
PreTax Income/Sales
Net Profit Margin 0.02 0.02 0.11
Net Income/Sales
Return on Equity (ROE) 0.09 0.07 0.50
Net Income/Tot.Equity
Return on Assets (ROA) 0.02 0.02 0.13
Net Income/Tot.Assets
LEVERAGE RATIOS Input: 2019 2020 2021
Total Debt 44,777 39,778 33,453
Total Equity 13,548 13,369 12325
Total Assets 58,325 53,147 45,778
EBIT (Operating income) 2,649 2,206 1,736
Interest Expense 0 0 0
LEVERAGE RATIOS: 2019 2020 2021
Debt/Equity Ratio 3.31 2.98 2.71
Total Debt/Total Equity
Debt/Capital Ratio 0.77 0.75 0.73
Total Debt/(Tot. Equity + Tot. Debt)
Equity Multiplier 4.31 3.98 3.71
Total Assets/Total Equity
Input data for Working Capital Ratios: 2019 2020 2021
Inventories 2,617 2,433 2,069
Account Receivables 243 166 170
Account Payables 9,131 8,922 8,399
Purchases 0 0 0
Sales 63,911 58,091 57,887
WORKING CAPITAL RATIOS: 2019 2020 2021
Account Receivable Days 1.37 1.03 1.06
(Account Receivable/Sales) x 360
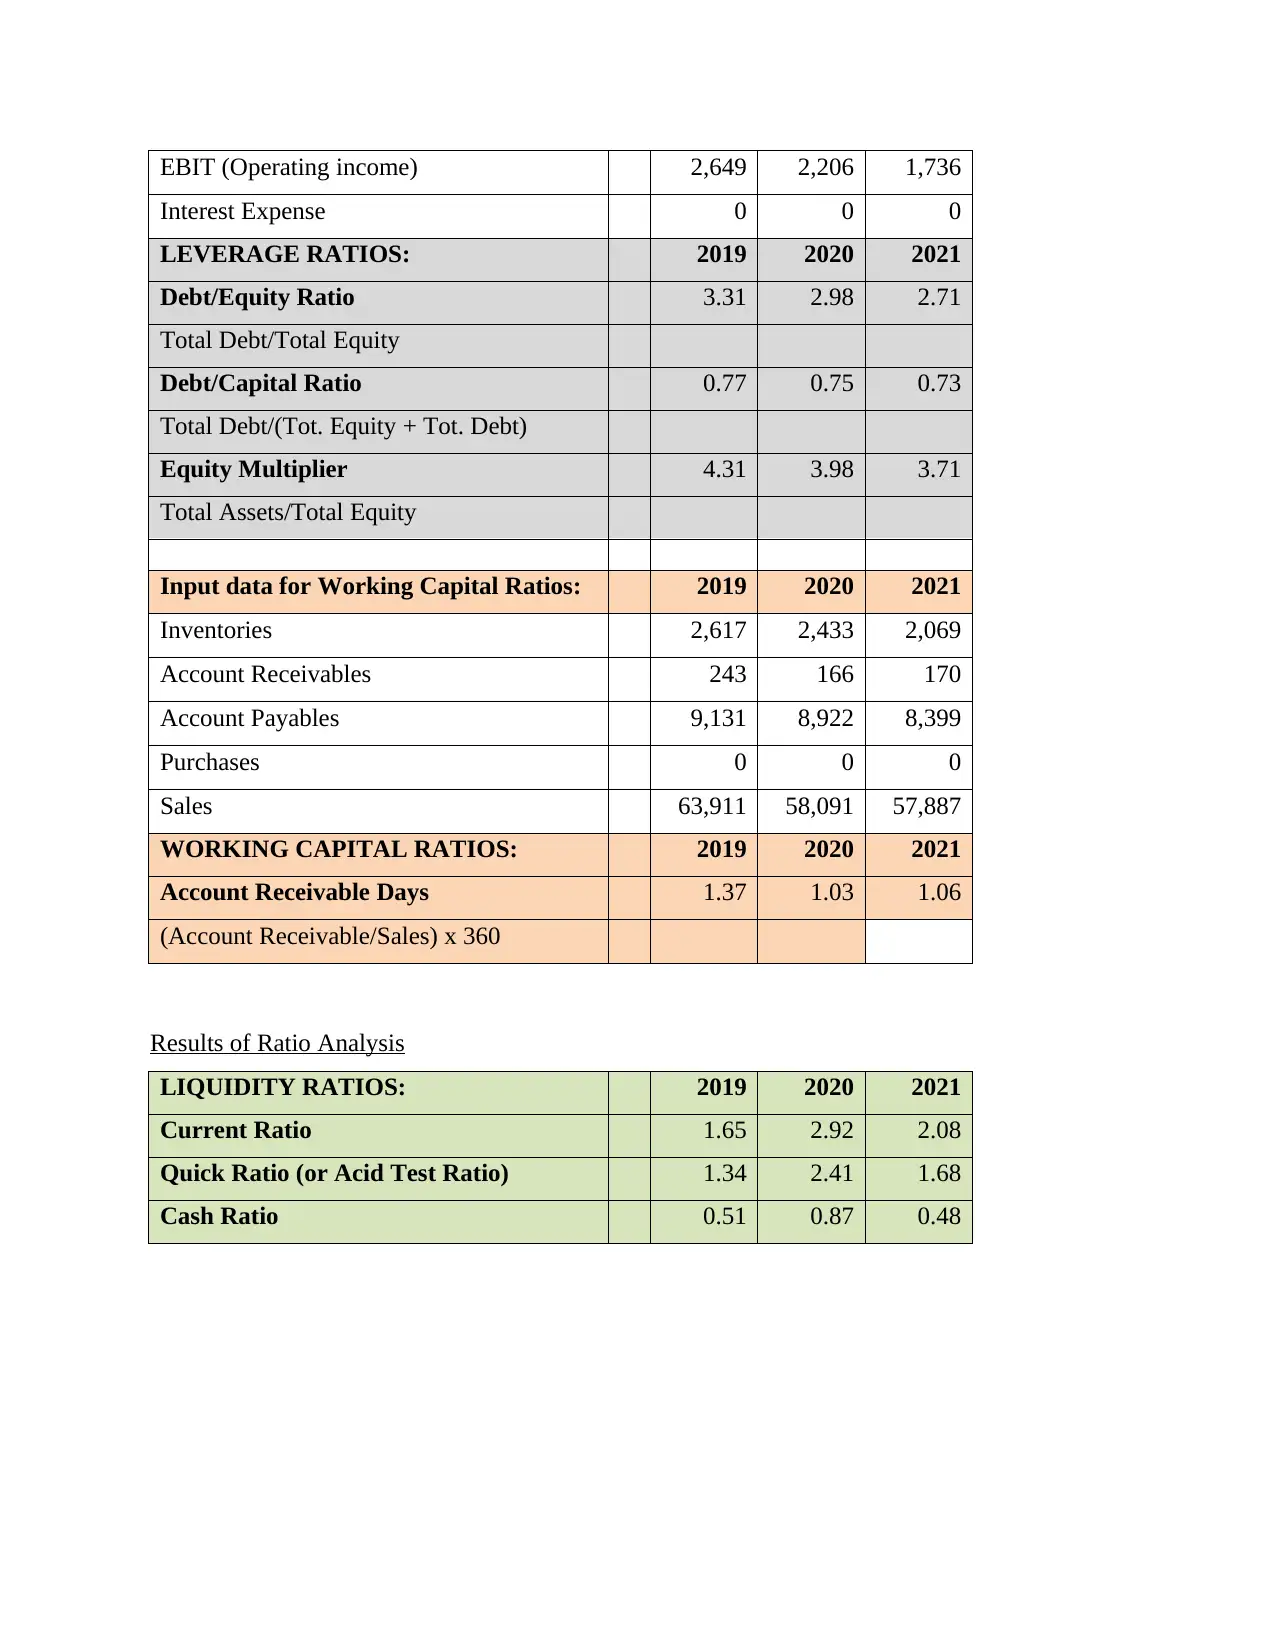
Results of Ratio Analysis
LIQUIDITY RATIOS: 2019 2020 2021
Current Ratio 1.65 2.92 2.08
Quick Ratio (or Acid Test Ratio) 1.34 2.41 1.68
Cash Ratio 0.51 0.87 0.48
Interest Expense 0 0 0
LEVERAGE RATIOS: 2019 2020 2021
Debt/Equity Ratio 3.31 2.98 2.71
Total Debt/Total Equity
Debt/Capital Ratio 0.77 0.75 0.73
Total Debt/(Tot. Equity + Tot. Debt)
Equity Multiplier 4.31 3.98 3.71
Total Assets/Total Equity
Input data for Working Capital Ratios: 2019 2020 2021
Inventories 2,617 2,433 2,069
Account Receivables 243 166 170
Account Payables 9,131 8,922 8,399
Purchases 0 0 0
Sales 63,911 58,091 57,887
WORKING CAPITAL RATIOS: 2019 2020 2021
Account Receivable Days 1.37 1.03 1.06
(Account Receivable/Sales) x 360
Results of Ratio Analysis
LIQUIDITY RATIOS: 2019 2020 2021
Current Ratio 1.65 2.92 2.08
Quick Ratio (or Acid Test Ratio) 1.34 2.41 1.68
Cash Ratio 0.51 0.87 0.48
⊘ This is a preview!⊘
Do you want full access?
Subscribe today to unlock all pages.
Trusted by 1+ million students worldwide
2019 2020 2021
0
0.5
1
1.5
2
2.5
3
1.65
2.92
2.08
1.34
2.41
1.68
0.51
0.87
0.48
Current Ratio
Quick Ratio (or Acid Test
Ratio)
Cash Ratio
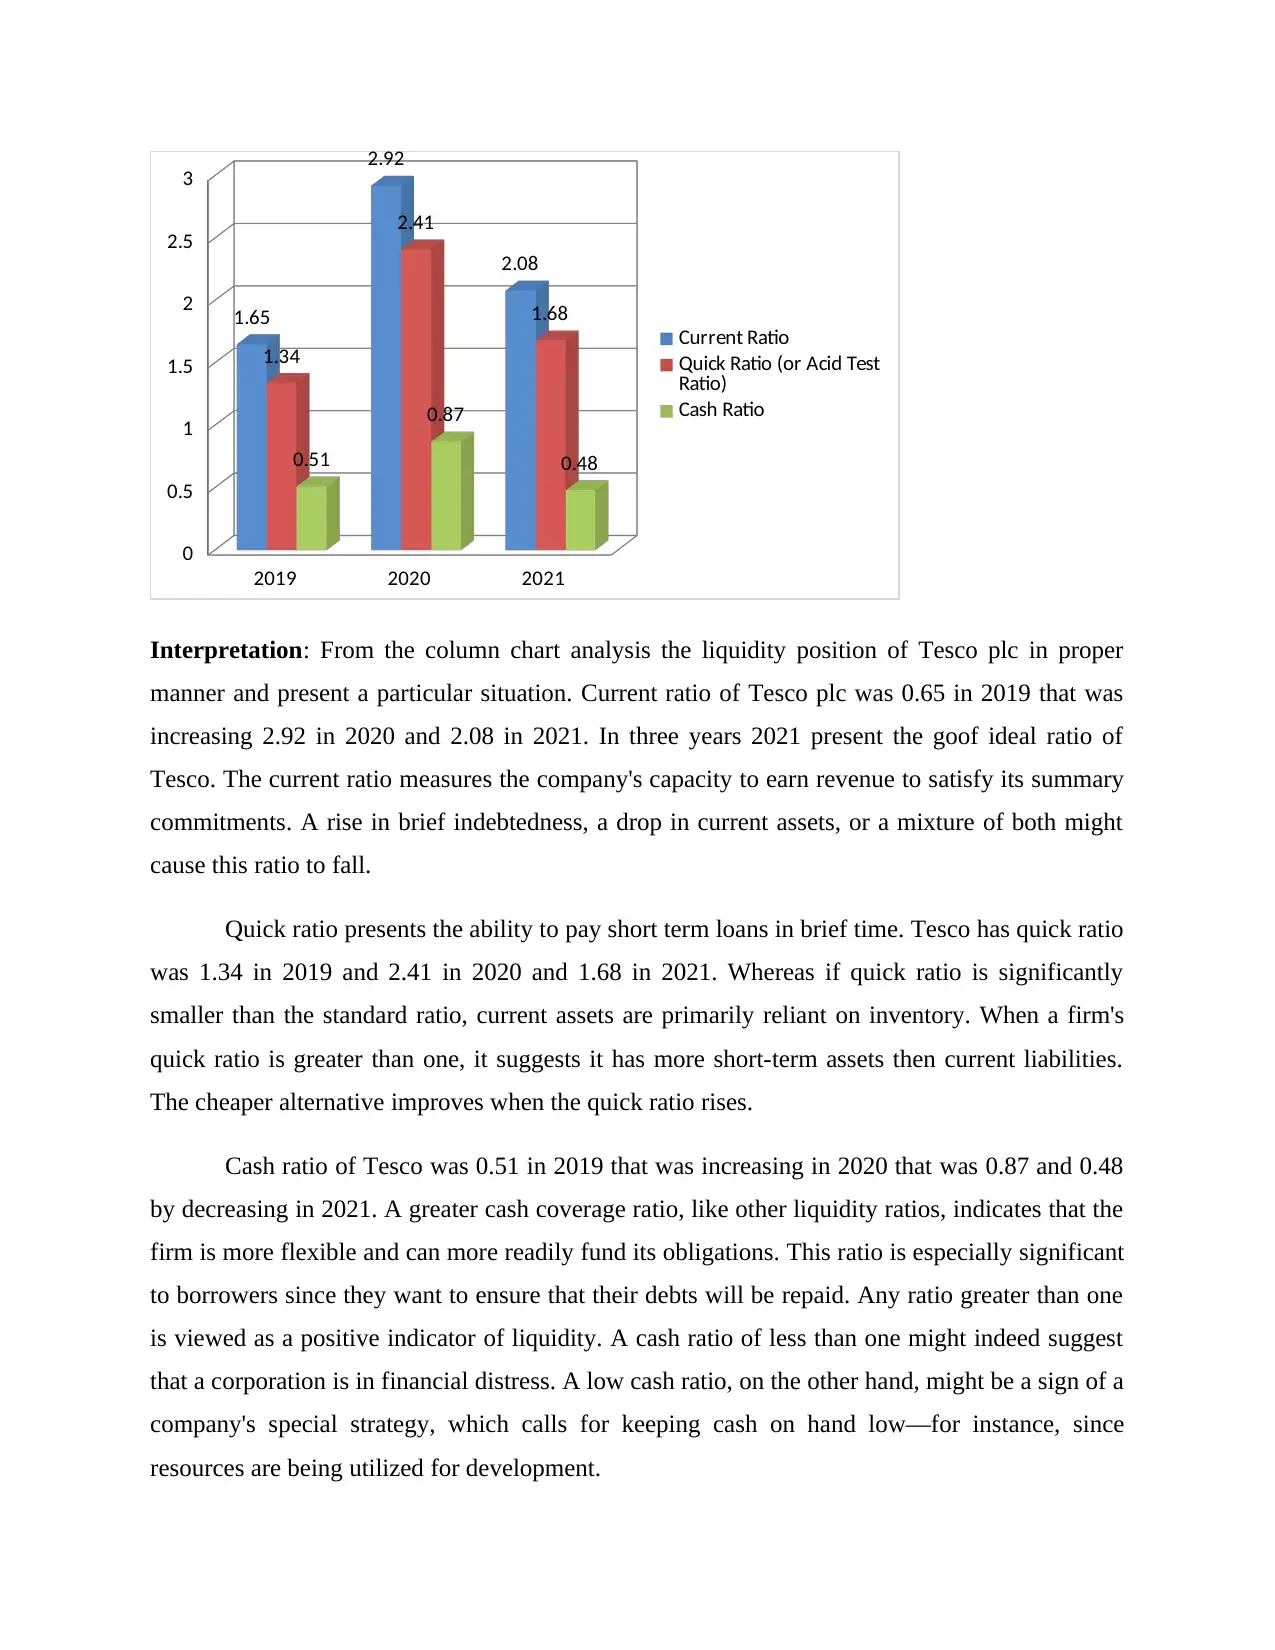
Interpretation: From the column chart analysis the liquidity position of Tesco plc in proper
manner and present a particular situation. Current ratio of Tesco plc was 0.65 in 2019 that was
increasing 2.92 in 2020 and 2.08 in 2021. In three years 2021 present the goof ideal ratio of
Tesco. The current ratio measures the company's capacity to earn revenue to satisfy its summary
commitments. A rise in brief indebtedness, a drop in current assets, or a mixture of both might
cause this ratio to fall.
Quick ratio presents the ability to pay short term loans in brief time. Tesco has quick ratio
was 1.34 in 2019 and 2.41 in 2020 and 1.68 in 2021. Whereas if quick ratio is significantly
smaller than the standard ratio, current assets are primarily reliant on inventory. When a firm's
quick ratio is greater than one, it suggests it has more short-term assets then current liabilities.
The cheaper alternative improves when the quick ratio rises.
Cash ratio of Tesco was 0.51 in 2019 that was increasing in 2020 that was 0.87 and 0.48
by decreasing in 2021. A greater cash coverage ratio, like other liquidity ratios, indicates that the
firm is more flexible and can more readily fund its obligations. This ratio is especially significant
to borrowers since they want to ensure that their debts will be repaid. Any ratio greater than one
is viewed as a positive indicator of liquidity. A cash ratio of less than one might indeed suggest
that a corporation is in financial distress. A low cash ratio, on the other hand, might be a sign of a
company's special strategy, which calls for keeping cash on hand low—for instance, since
resources are being utilized for development.
0
0.5
1
1.5
2
2.5
3
1.65
2.92
2.08
1.34
2.41
1.68
0.51
0.87
0.48
Current Ratio
Quick Ratio (or Acid Test
Ratio)
Cash Ratio
Interpretation: From the column chart analysis the liquidity position of Tesco plc in proper
manner and present a particular situation. Current ratio of Tesco plc was 0.65 in 2019 that was
increasing 2.92 in 2020 and 2.08 in 2021. In three years 2021 present the goof ideal ratio of
Tesco. The current ratio measures the company's capacity to earn revenue to satisfy its summary
commitments. A rise in brief indebtedness, a drop in current assets, or a mixture of both might
cause this ratio to fall.
Quick ratio presents the ability to pay short term loans in brief time. Tesco has quick ratio
was 1.34 in 2019 and 2.41 in 2020 and 1.68 in 2021. Whereas if quick ratio is significantly
smaller than the standard ratio, current assets are primarily reliant on inventory. When a firm's
quick ratio is greater than one, it suggests it has more short-term assets then current liabilities.
The cheaper alternative improves when the quick ratio rises.
Cash ratio of Tesco was 0.51 in 2019 that was increasing in 2020 that was 0.87 and 0.48
by decreasing in 2021. A greater cash coverage ratio, like other liquidity ratios, indicates that the
firm is more flexible and can more readily fund its obligations. This ratio is especially significant
to borrowers since they want to ensure that their debts will be repaid. Any ratio greater than one
is viewed as a positive indicator of liquidity. A cash ratio of less than one might indeed suggest
that a corporation is in financial distress. A low cash ratio, on the other hand, might be a sign of a
company's special strategy, which calls for keeping cash on hand low—for instance, since
resources are being utilized for development.
Paraphrase This Document
Need a fresh take? Get an instant paraphrase of this document with our AI Paraphraser
2019 2020 2021
Gross Margin 0.07 0.07 0.07
Operating
Margin 0.04 0.04 0.03
Pre Tax
Margin 0.03 0.02 0.01
2019 2020 2021
0
0.01
0.02
0.03
0.04
0.05
0.06
0.07
0.07 0.07 0.07
0.04 0.04
0.030.03
0.02
0.01
Gross Margin
Operating Margin
PreTax Margin
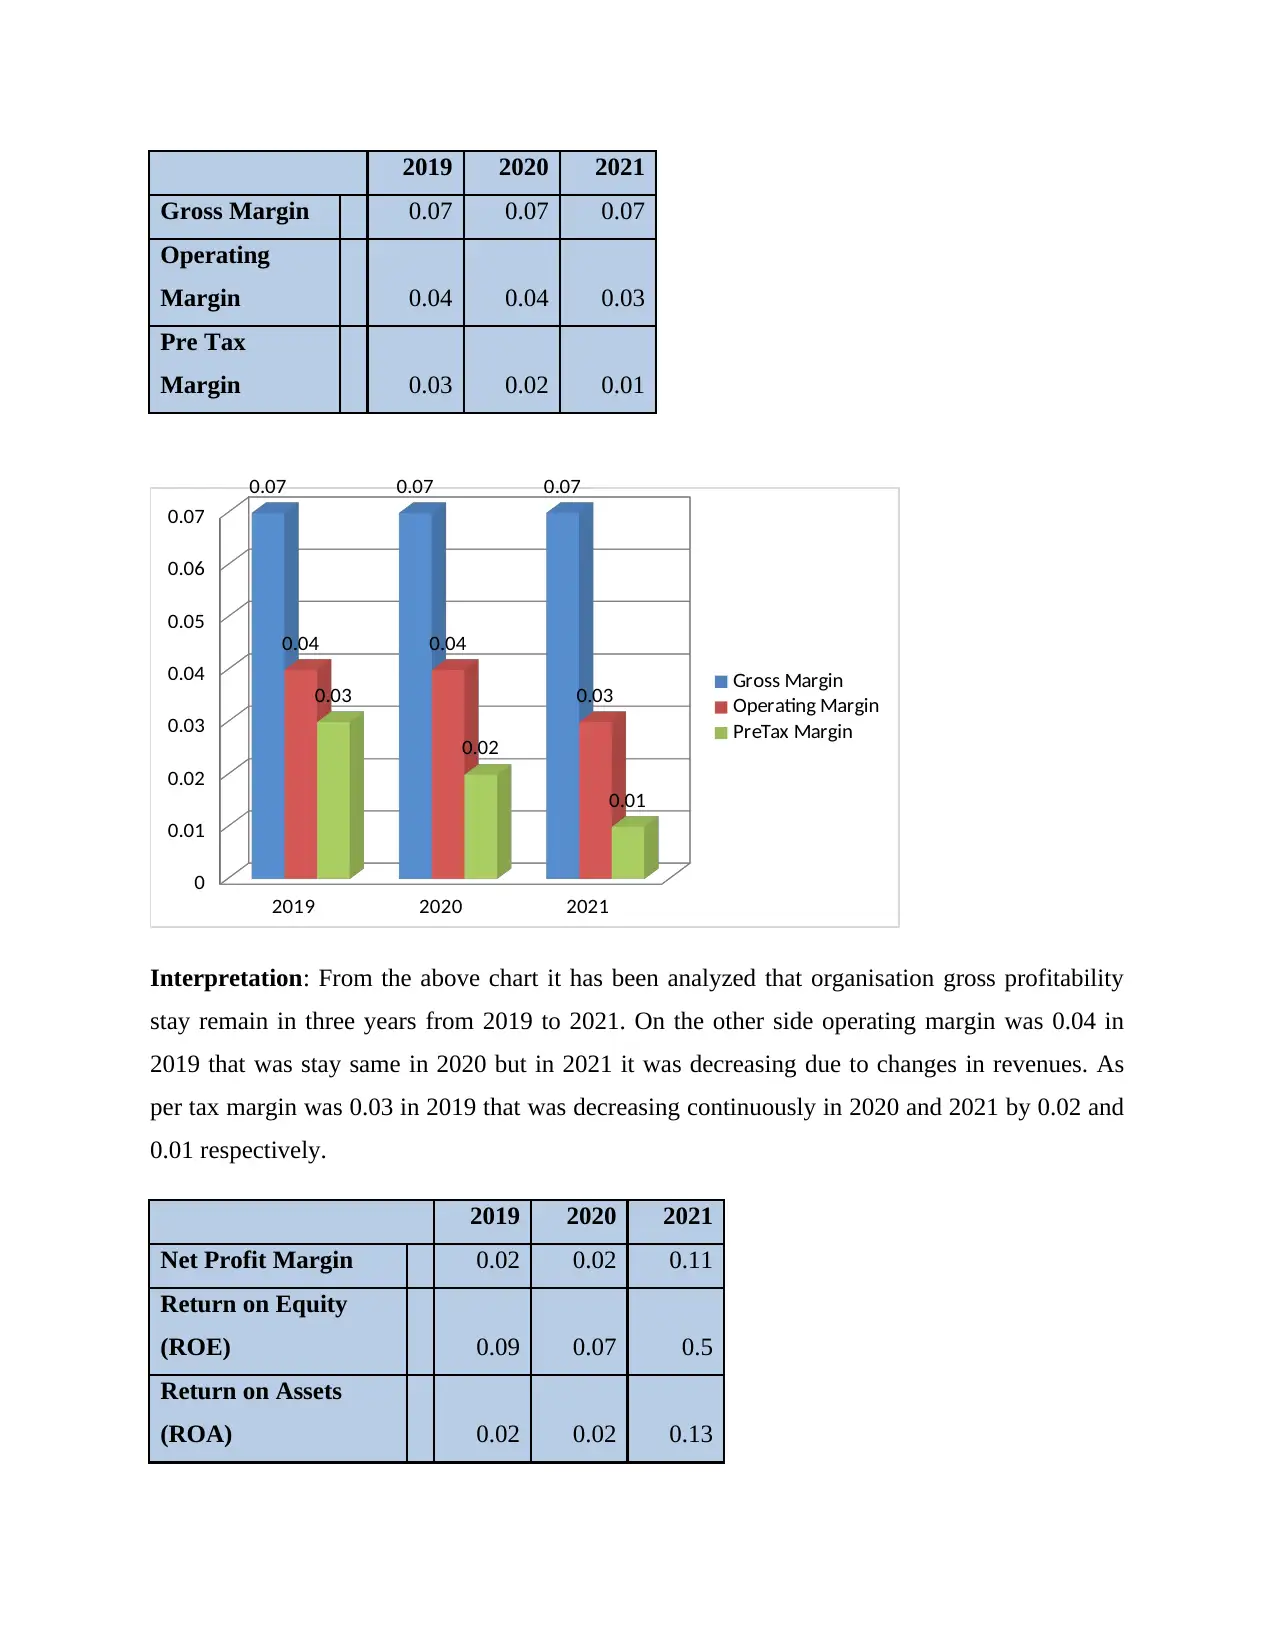
Interpretation: From the above chart it has been analyzed that organisation gross profitability
stay remain in three years from 2019 to 2021. On the other side operating margin was 0.04 in
2019 that was stay same in 2020 but in 2021 it was decreasing due to changes in revenues. As
per tax margin was 0.03 in 2019 that was decreasing continuously in 2020 and 2021 by 0.02 and
0.01 respectively.
2019 2020 2021
Net Profit Margin 0.02 0.02 0.11
Return on Equity
(ROE) 0.09 0.07 0.5
Return on Assets
(ROA) 0.02 0.02 0.13
Gross Margin 0.07 0.07 0.07
Operating
Margin 0.04 0.04 0.03
Pre Tax
Margin 0.03 0.02 0.01
2019 2020 2021
0
0.01
0.02
0.03
0.04
0.05
0.06
0.07
0.07 0.07 0.07
0.04 0.04
0.030.03
0.02
0.01
Gross Margin
Operating Margin
PreTax Margin
Interpretation: From the above chart it has been analyzed that organisation gross profitability
stay remain in three years from 2019 to 2021. On the other side operating margin was 0.04 in
2019 that was stay same in 2020 but in 2021 it was decreasing due to changes in revenues. As
per tax margin was 0.03 in 2019 that was decreasing continuously in 2020 and 2021 by 0.02 and
0.01 respectively.
2019 2020 2021
Net Profit Margin 0.02 0.02 0.11
Return on Equity
(ROE) 0.09 0.07 0.5
Return on Assets
(ROA) 0.02 0.02 0.13
2019 2020 2021
0
0.05
0.1
0.15
0.2
0.25
0.3
0.35
0.4
0.45
0.5
0.02 0.02
0.11
0.09 0.07
0.5
0.02 0.02
0.13
Net Profit Margin
Return on Equity (ROE)
Return on Assets (ROA)
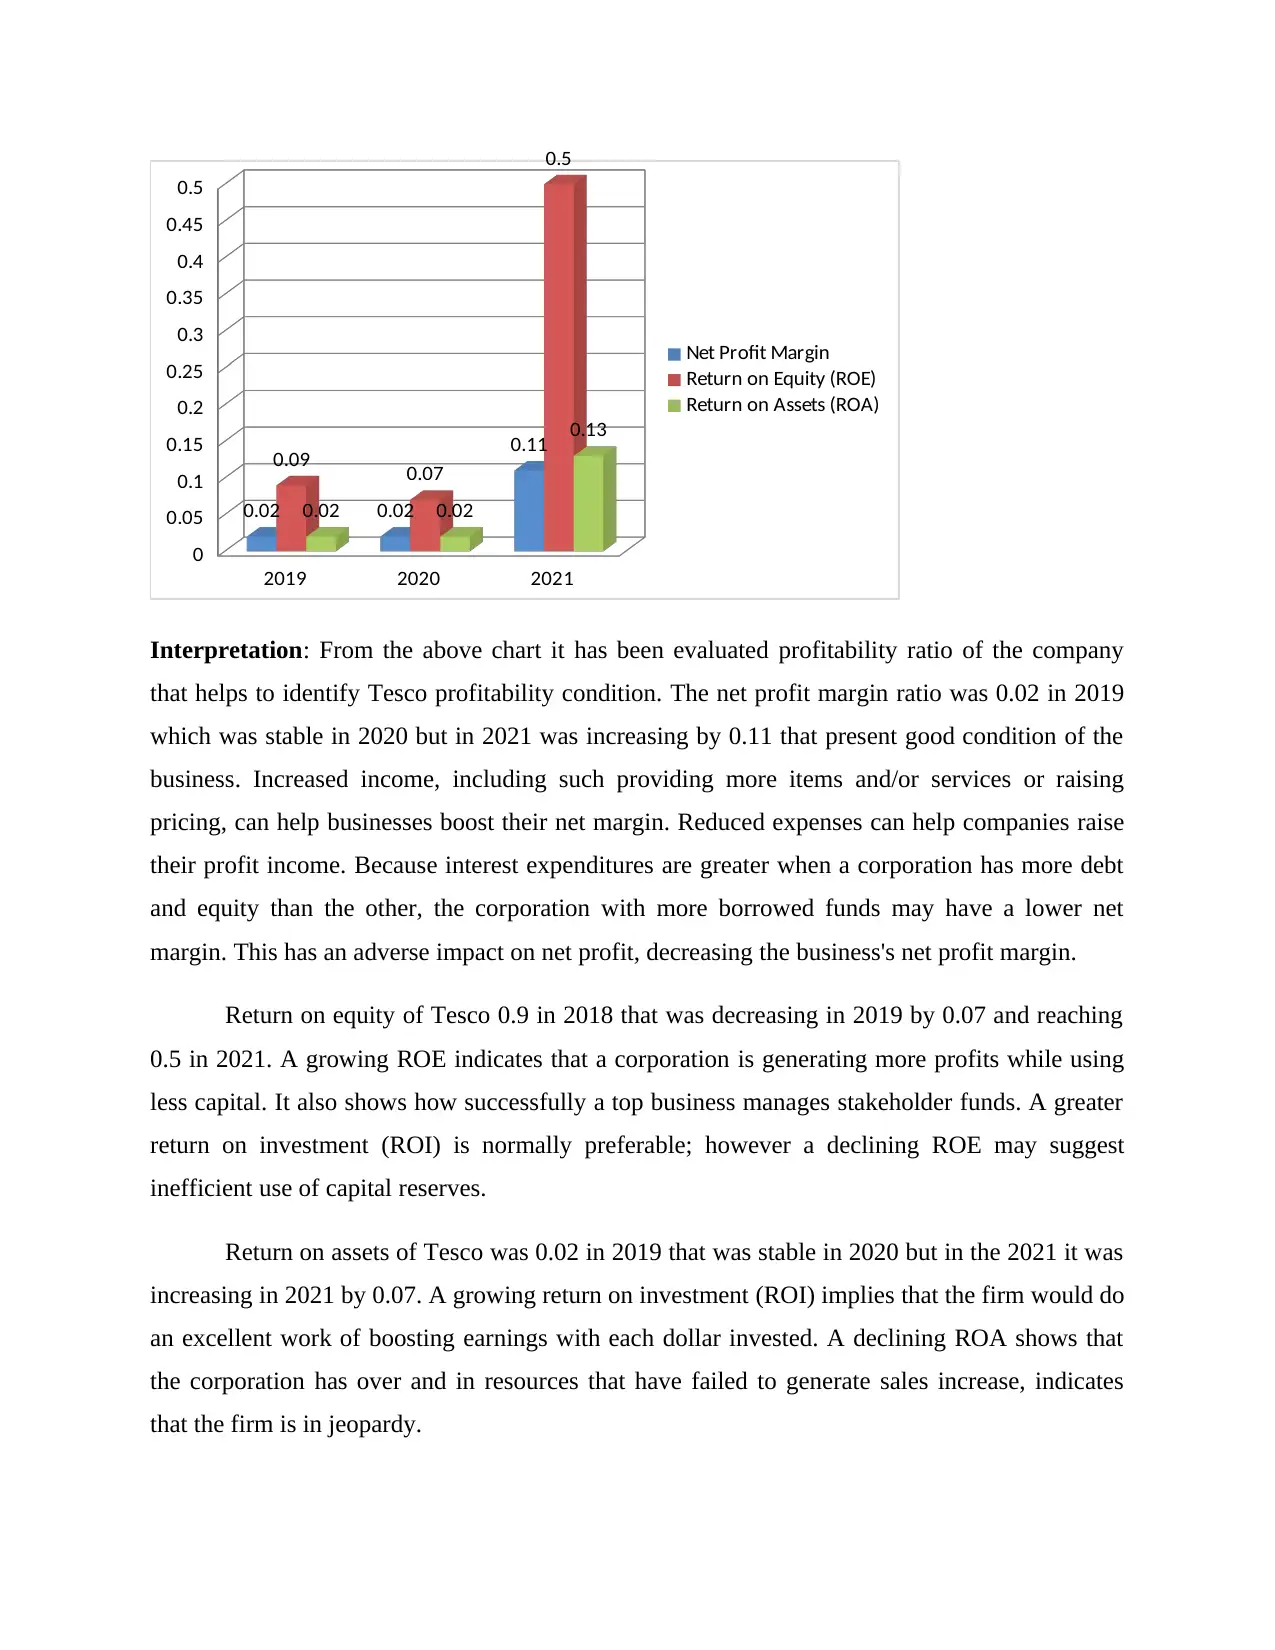
Interpretation: From the above chart it has been evaluated profitability ratio of the company
that helps to identify Tesco profitability condition. The net profit margin ratio was 0.02 in 2019
which was stable in 2020 but in 2021 was increasing by 0.11 that present good condition of the
business. Increased income, including such providing more items and/or services or raising
pricing, can help businesses boost their net margin. Reduced expenses can help companies raise
their profit income. Because interest expenditures are greater when a corporation has more debt
and equity than the other, the corporation with more borrowed funds may have a lower net
margin. This has an adverse impact on net profit, decreasing the business's net profit margin.
Return on equity of Tesco 0.9 in 2018 that was decreasing in 2019 by 0.07 and reaching
0.5 in 2021. A growing ROE indicates that a corporation is generating more profits while using
less capital. It also shows how successfully a top business manages stakeholder funds. A greater
return on investment (ROI) is normally preferable; however a declining ROE may suggest
inefficient use of capital reserves.
Return on assets of Tesco was 0.02 in 2019 that was stable in 2020 but in the 2021 it was
increasing in 2021 by 0.07. A growing return on investment (ROI) implies that the firm would do
an excellent work of boosting earnings with each dollar invested. A declining ROA shows that
the corporation has over and in resources that have failed to generate sales increase, indicates
that the firm is in jeopardy.
0
0.05
0.1
0.15
0.2
0.25
0.3
0.35
0.4
0.45
0.5
0.02 0.02
0.11
0.09 0.07
0.5
0.02 0.02
0.13
Net Profit Margin
Return on Equity (ROE)
Return on Assets (ROA)
Interpretation: From the above chart it has been evaluated profitability ratio of the company
that helps to identify Tesco profitability condition. The net profit margin ratio was 0.02 in 2019
which was stable in 2020 but in 2021 was increasing by 0.11 that present good condition of the
business. Increased income, including such providing more items and/or services or raising
pricing, can help businesses boost their net margin. Reduced expenses can help companies raise
their profit income. Because interest expenditures are greater when a corporation has more debt
and equity than the other, the corporation with more borrowed funds may have a lower net
margin. This has an adverse impact on net profit, decreasing the business's net profit margin.
Return on equity of Tesco 0.9 in 2018 that was decreasing in 2019 by 0.07 and reaching
0.5 in 2021. A growing ROE indicates that a corporation is generating more profits while using
less capital. It also shows how successfully a top business manages stakeholder funds. A greater
return on investment (ROI) is normally preferable; however a declining ROE may suggest
inefficient use of capital reserves.
Return on assets of Tesco was 0.02 in 2019 that was stable in 2020 but in the 2021 it was
increasing in 2021 by 0.07. A growing return on investment (ROI) implies that the firm would do
an excellent work of boosting earnings with each dollar invested. A declining ROA shows that
the corporation has over and in resources that have failed to generate sales increase, indicates
that the firm is in jeopardy.
⊘ This is a preview!⊘
Do you want full access?
Subscribe today to unlock all pages.
Trusted by 1+ million students worldwide
2019 2020 2021
Debt/Equity
Ratio 3.31 2.98 2.71
Debt/Capital
Ratio 0.77 0.75 0.73
Equity
Multiplier 4.31 3.98 3.71
2019 2020 2021
0
0.5
1
1.5
2
2.5
3
3.5
4
4.5
3.31
2.98
2.71
0.77 0.75 0.73
4.31
3.98
3.71
Debt/Equity Ratio
Debt/Capital Ratio
Equity Multiplier
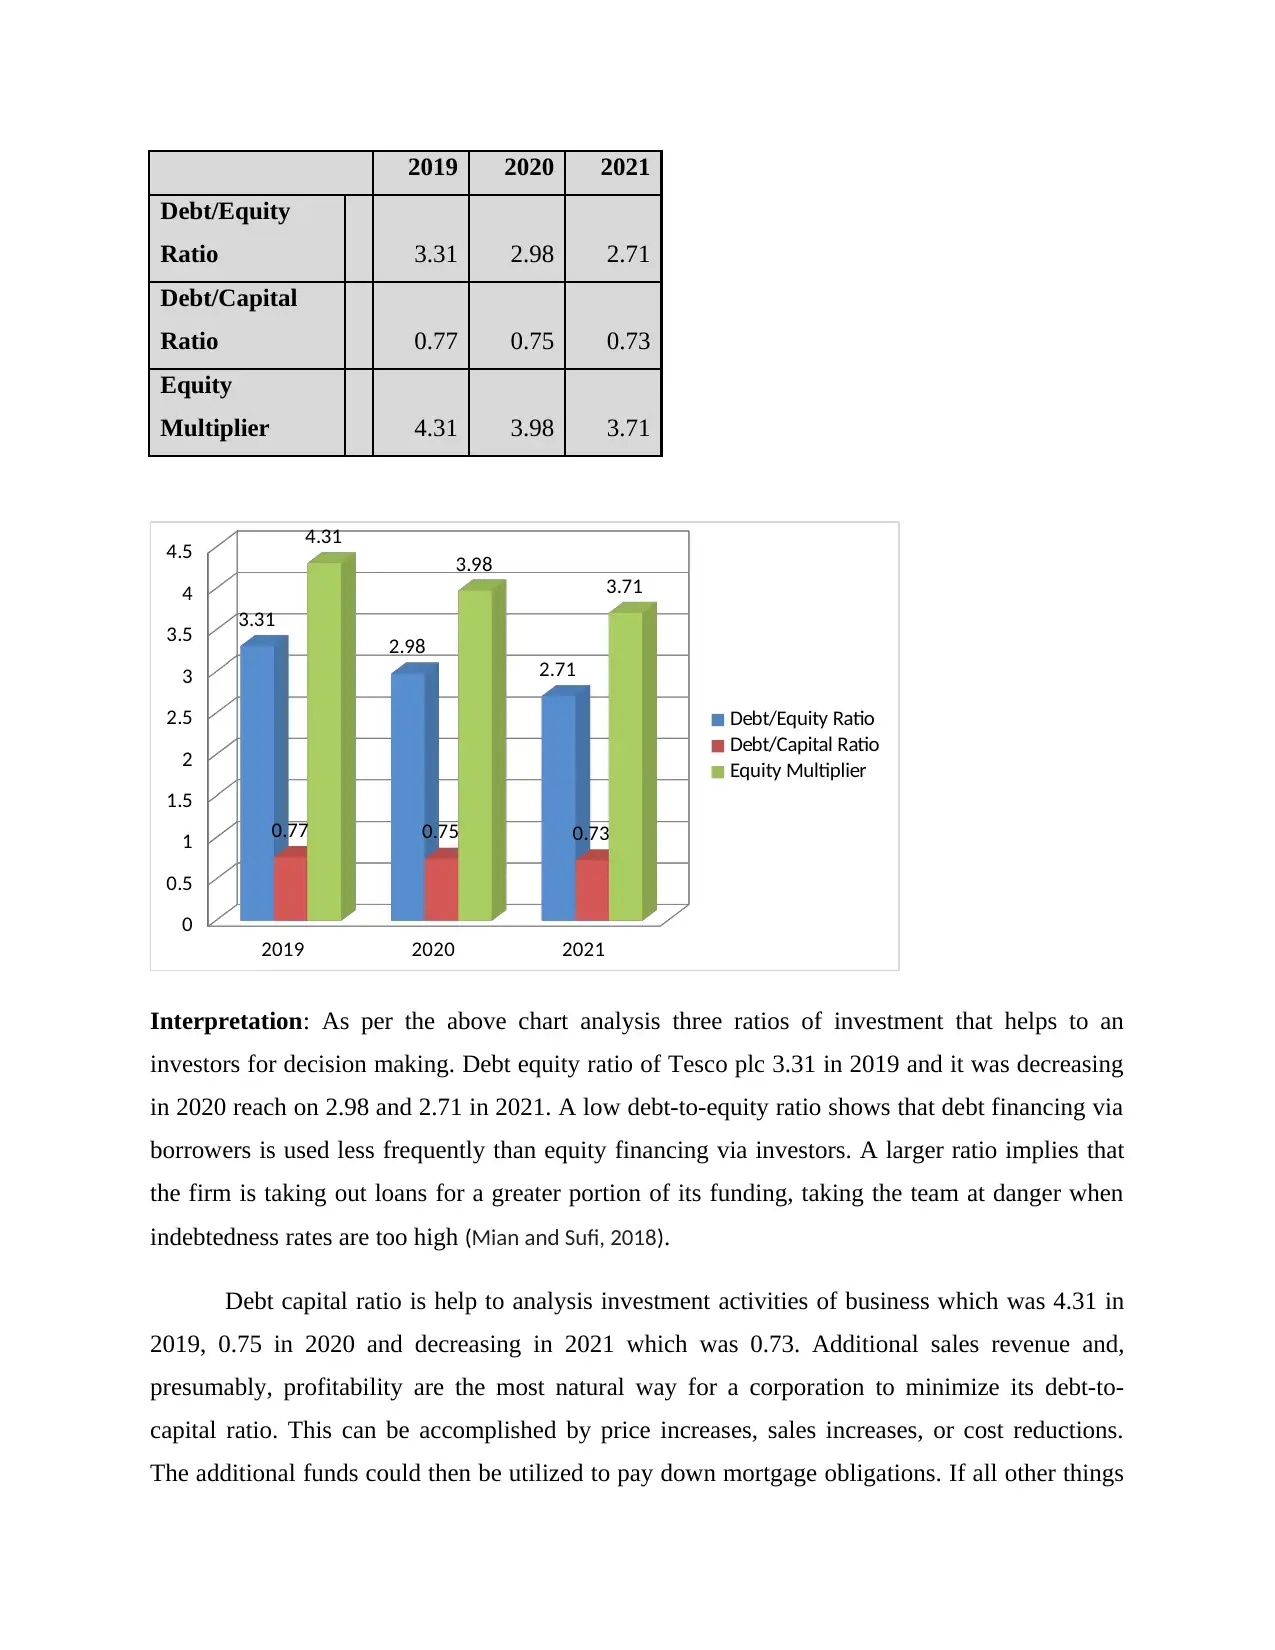
Interpretation: As per the above chart analysis three ratios of investment that helps to an
investors for decision making. Debt equity ratio of Tesco plc 3.31 in 2019 and it was decreasing
in 2020 reach on 2.98 and 2.71 in 2021. A low debt-to-equity ratio shows that debt financing via
borrowers is used less frequently than equity financing via investors. A larger ratio implies that
the firm is taking out loans for a greater portion of its funding, taking the team at danger when
indebtedness rates are too high (Mian and Sufi, 2018).
Debt capital ratio is help to analysis investment activities of business which was 4.31 in
2019, 0.75 in 2020 and decreasing in 2021 which was 0.73. Additional sales revenue and,
presumably, profitability are the most natural way for a corporation to minimize its debt-to-
capital ratio. This can be accomplished by price increases, sales increases, or cost reductions.
The additional funds could then be utilized to pay down mortgage obligations. If all other things
Debt/Equity
Ratio 3.31 2.98 2.71
Debt/Capital
Ratio 0.77 0.75 0.73
Equity
Multiplier 4.31 3.98 3.71
2019 2020 2021
0
0.5
1
1.5
2
2.5
3
3.5
4
4.5
3.31
2.98
2.71
0.77 0.75 0.73
4.31
3.98
3.71
Debt/Equity Ratio
Debt/Capital Ratio
Equity Multiplier
Interpretation: As per the above chart analysis three ratios of investment that helps to an
investors for decision making. Debt equity ratio of Tesco plc 3.31 in 2019 and it was decreasing
in 2020 reach on 2.98 and 2.71 in 2021. A low debt-to-equity ratio shows that debt financing via
borrowers is used less frequently than equity financing via investors. A larger ratio implies that
the firm is taking out loans for a greater portion of its funding, taking the team at danger when
indebtedness rates are too high (Mian and Sufi, 2018).
Debt capital ratio is help to analysis investment activities of business which was 4.31 in
2019, 0.75 in 2020 and decreasing in 2021 which was 0.73. Additional sales revenue and,
presumably, profitability are the most natural way for a corporation to minimize its debt-to-
capital ratio. This can be accomplished by price increases, sales increases, or cost reductions.
The additional funds could then be utilized to pay down mortgage obligations. If all other things
Paraphrase This Document
Need a fresh take? Get an instant paraphrase of this document with our AI Paraphraser
are considered, a corporation with a greater debt-to-capital ratio is hazardous. It's because the
greater the debt-to-equity ratio, the further the firm is supported by debt rather than equity,
implying a higher obligation to pay back the debt and an increased risk of loan disgorgement
whereas if loan is not compensated.
Equity multiplier ratio was 4.31 in 2019 which was decreasing in 2020 by 3.98 and it was
decreasing by 3.71 in 2021. The equity multiplier is a metric that indicates how much of a firm's
profits are funded through shares instead of borrowing. A large equity multiplier usually suggests
that a corporation has a lot of debt. A smaller equity multiplier is preferable since it shows that
the corporation is borrowing less to purchase shares. Corporation DEF is favored over company
ABC in this situation since it owes less revenue and hence bears less hazard.
Working capital ratio 2019 2020 2021
Account Receivable
Days 1.37 1.03 1.06
2019 2020 2021
0
0.2
0.4
0.6
0.8
1
1.2
1.4
1.37
1.03 1.06
Account Receivable Days
Account Receivable Days
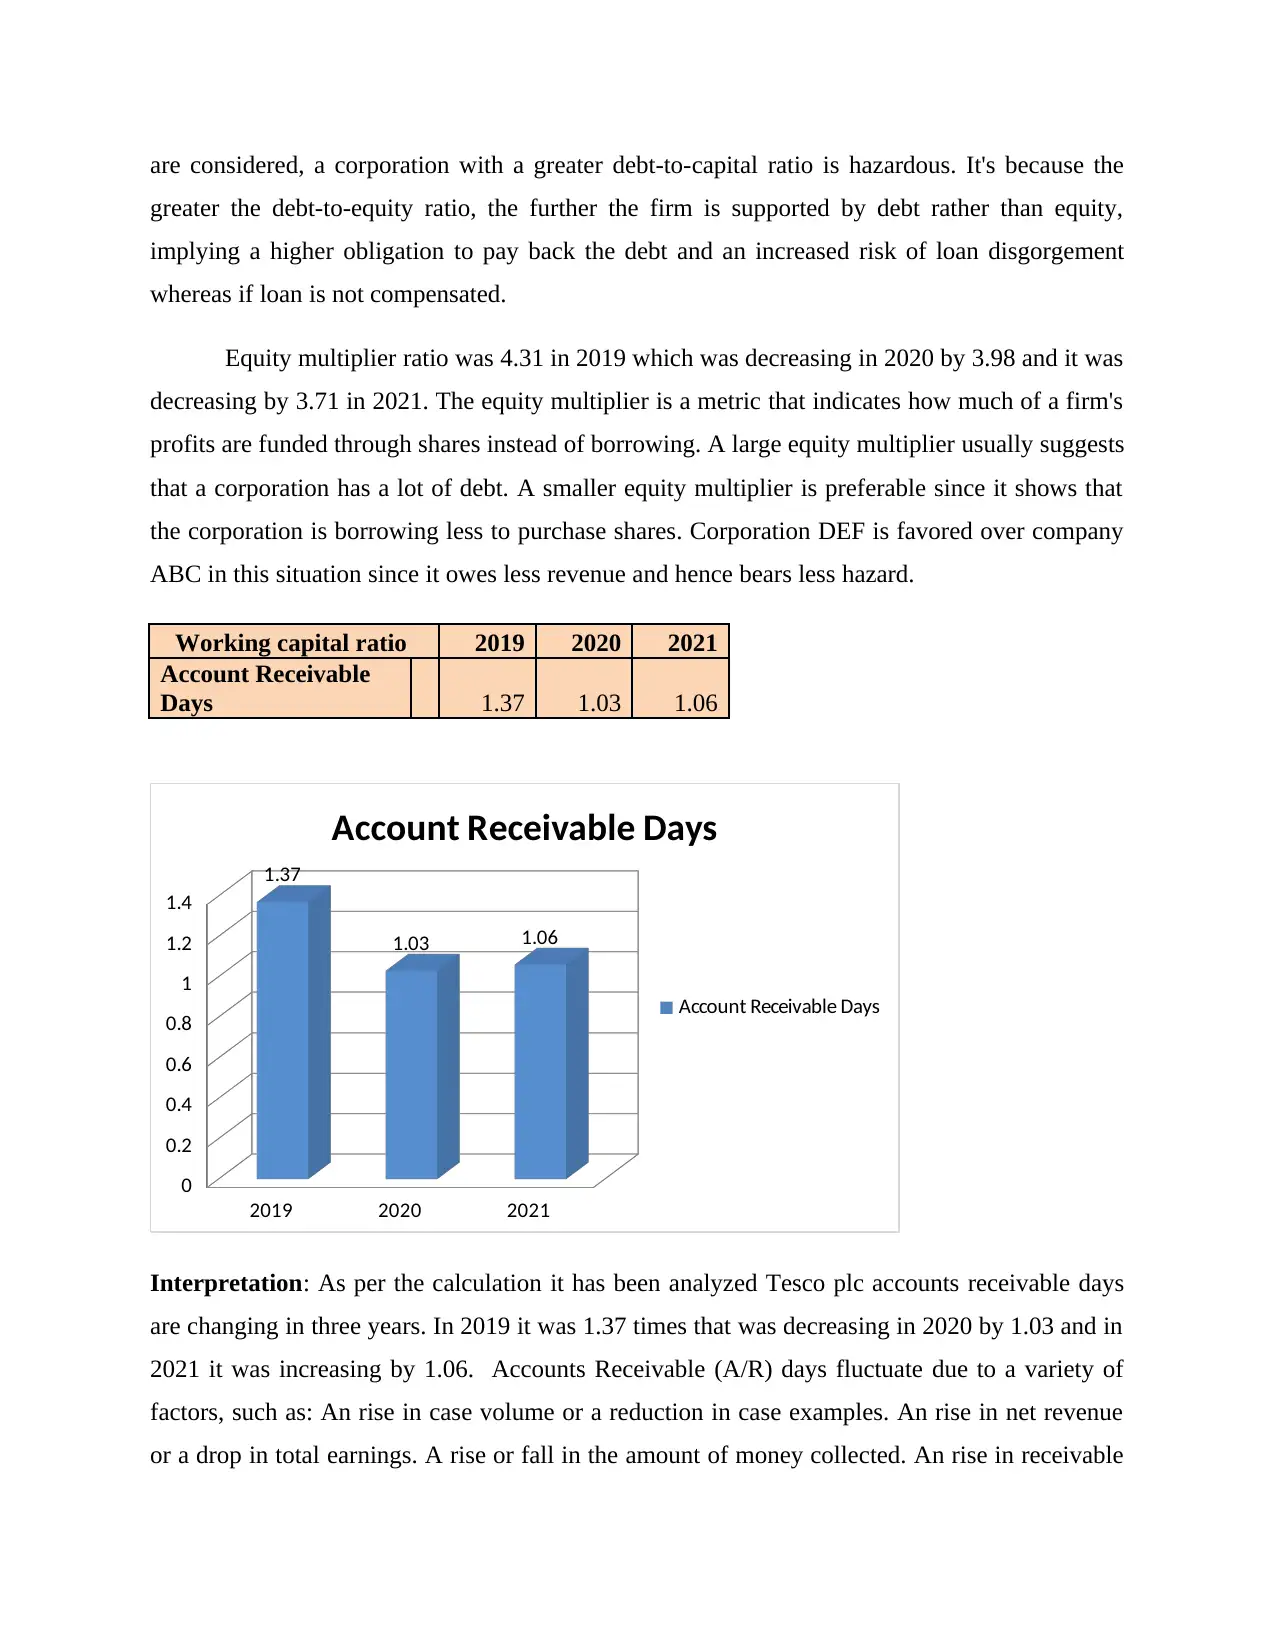
Interpretation: As per the calculation it has been analyzed Tesco plc accounts receivable days
are changing in three years. In 2019 it was 1.37 times that was decreasing in 2020 by 1.03 and in
2021 it was increasing by 1.06. Accounts Receivable (A/R) days fluctuate due to a variety of
factors, such as: An rise in case volume or a reduction in case examples. An rise in net revenue
or a drop in total earnings. A rise or fall in the amount of money collected. An rise in receivable
greater the debt-to-equity ratio, the further the firm is supported by debt rather than equity,
implying a higher obligation to pay back the debt and an increased risk of loan disgorgement
whereas if loan is not compensated.
Equity multiplier ratio was 4.31 in 2019 which was decreasing in 2020 by 3.98 and it was
decreasing by 3.71 in 2021. The equity multiplier is a metric that indicates how much of a firm's
profits are funded through shares instead of borrowing. A large equity multiplier usually suggests
that a corporation has a lot of debt. A smaller equity multiplier is preferable since it shows that
the corporation is borrowing less to purchase shares. Corporation DEF is favored over company
ABC in this situation since it owes less revenue and hence bears less hazard.
Working capital ratio 2019 2020 2021
Account Receivable
Days 1.37 1.03 1.06
2019 2020 2021
0
0.2
0.4
0.6
0.8
1
1.2
1.4
1.37
1.03 1.06
Account Receivable Days
Account Receivable Days
Interpretation: As per the calculation it has been analyzed Tesco plc accounts receivable days
are changing in three years. In 2019 it was 1.37 times that was decreasing in 2020 by 1.03 and in
2021 it was increasing by 1.06. Accounts Receivable (A/R) days fluctuate due to a variety of
factors, such as: An rise in case volume or a reduction in case examples. An rise in net revenue
or a drop in total earnings. A rise or fall in the amount of money collected. An rise in receivable
accounts turnover indicates that a firm is executing credits more efficiently. A decline in
accounts receivable rotation indicates that a firm is encountering more overdue customers. When
accounts receivable fell through one year to the next, it means that the firm's previous trade
receivables were recovered (i.e., sales invoices were finally transformed to cash transactions),
resulting in cash inflow (Terry, Macy, Owens and Vinyard, 2020).
Results: From the overall analysis of ratio it is identifying that Debt capital ratio and cash ratio is
lower of Tesco. Profitability ratio present good position of company and make stable position of
company. Liquidity ratio is present that current ratio is near by the deal ratio it means company
maintain their performance in effective manner.
Recommendations
• The organisation is urged to focus on the correct installation of budgetary control mechanisms.
It may enable the company to develop strategic plans for operational activity. To attain business
goals, it is necessary for a company to have an integrated design process that includes the use of
a highly appropriate budget so that data can be gathered that can be used to identify potential
stumbling blocks and opportunities. It helps users to obtain knowledge that is quite useful in
making informed decisions that allow you to achieve excellent results. Coordinating and
conducting the company's operations in a more efficient way gets conceivable.
• The company should work to reduce costs that contribute to higher depreciation and
amortization in the financial plan. As a produce, businesses must seek out options that will result
in the least amount of cash being used. They might choose clientele who are willing to pay a
higher fee for selling property.
CONCLUSION
According to the aforementioned study report, in business, money should be managed
properly since any type of mismanagement in corporate finance can result in poor business
situations. From the above analysis it is saying that Tesco has good position in retail sector and
good for the investment purpose.
⊘ This is a preview!⊘
Do you want full access?
Subscribe today to unlock all pages.
Trusted by 1+ million students worldwide
1 out of 16
Related Documents


Your All-in-One AI-Powered Toolkit for Academic Success.
+13062052269
info@desklib.com
Available 24*7 on WhatsApp / Email
![[object Object]](/_next/static/media/star-bottom.7253800d.svg)
Unlock your academic potential
Copyright © 2020–2026 A2Z Services. All Rights Reserved. Developed and managed by ZUCOL.