Risk, Quality, and People Management in Tesco's Digital Project Report
VerifiedAdded on 2023/01/04
|13
|3654
|1
Report
AI Summary
This report provides a comprehensive analysis of project risk management within Tesco, focusing on the company's shift towards digital technology. It identifies three key risks: customer satisfaction issues, poor planning, and social media marketing failures. The report explores mitigation and contingency plans for each risk, considering budgetary implications. It then utilizes various analytical tools, including Pareto analysis, Riskit analysis, and Ishikawa diagrams, to assess and visualize the identified risks. A literature review supports the analysis, providing context and relevant research findings. The report concludes with a discussion of the leadership and management strategies required to effectively navigate these risks and ensure the successful completion of Tesco's digital transformation project. The report highlights the importance of proactive risk management in achieving organizational goals.
Leadership & Management of Project Risk
Quality & People Assignment 2 (of 2) (Risk
Management)
Quality & People Assignment 2 (of 2) (Risk
Management)
Paraphrase This Document
Need a fresh take? Get an instant paraphrase of this document with our AI Paraphraser
Executive summary
In a defined time span, leadership and management lead a company to meet its objectives and
goals. Both leaders and administrators act as an organisational cornerstone that makes a
corporation accomplish its mission in a coordinated manner. The word project management
directs the team activities of multiple participants to accomplish corporate goals and priorities.
The goals. It is the duty of top administrators, such as presidents and supervisors, to reduce or
eliminate the obstacles that serve as a project completion hurdle. For this study, TESCO is the
preferred company and it is known as one of the UK's leading grocery stores.
Table of Contents
Executive summary .........................................................................................................................2
Introduction .................................................................................................................................2
Task 1 ..............................................................................................................................................2
Identify three risks that could affect the change and business activity and thus impact on
quality outcomes .........................................................................................................................2
Explore the potential mitigation and contingency plans and consider the budgetary
implications of these plans ..........................................................................................................4
Task 2 ..............................................................................................................................................5
Pareto analysis ............................................................................................................................5
Riskit analysis .............................................................................................................................7
Ishikawa diagram ........................................................................................................................9
Literature review .......................................................................................................................10
REFERENCES .............................................................................................................................11
.......................................................................................................................................................11
1
⊘ This is a preview!⊘
Do you want full access?
Subscribe today to unlock all pages.
Trusted by 1+ million students worldwide
Introduction
Leadership and management are both important factors that help a company to attain
organisational objectives and goals. There is need for different organisations to choose the right
type of leaders so that business can be run in effective manner (Dioko, 2016). It is also necessary
for all employees to be encourage and motivated for completing the organisational activities
within specified time frame. The following report is based upon the risk associated with a
project started in Tesco. The leaders and managers of Tesco are pillar of the company and they
are involved in completing the goals and objectives in specified time. Tesco is involved in
managing the business activities so that the risk is very less. When any company works within a
project, there are lot of risks that have to be managed. The new project started within Tesco is
shifting from business model to digital technology.
Task 1
Identify three risks that could affect the change and business activity and thus impact on quality
outcomes
There are different risks present within new project initiated by Tesco. The project
involved within Tesco is the shifting of traditional business model to new digital technology.
There is need for the management of this company to evaluate and analyse all the factors in
effective manner for knowing what are the most important elements in managing the project
completion (Duffett, 2017).
Risk Analysis is characterised as a series of risk management planning, risk analysis, risk
identification and risk management processes in a project. Control of likely future incidents that
could have a detrimental impact on the overall project is proper risk control. It is more of a
constructive mechanism than a reactive one. Project Procurement Management entails the
methods of buying or purchasing supplies used to operate a business. A vendor, customer or
service supplier may be the organisation. Management of project recruitment often means
monitoring any deal provided by an external agency and getting work completed beyond the
project team (Gillespie, and Riddle, 2015). Four steps of Plan Procurement Management include
Plan Procurement Management, Conduct Procurement, Monitor Procurement, Close
Procurement Management,
2
Paraphrase This Document
Need a fresh take? Get an instant paraphrase of this document with our AI Paraphraser
Requirements documents, Teaming arrangements, Risk Log, Scope Baseline, Project Timeline,
Operation Expense Forecasts, Cost Efficiency Baseline, Risk Contract Decisions, Company
Environmental Considerations, Operational Process Assets are the input in the proposal
acquisition management.
Risk analysis is required for Tesco company to manage and develop effective care when
initiating digital technology at workplace. There is requirement of developing a proper plan and
procedure so that goals can be accomplished in specified time. There is an intense process of
modernisation as well as advancement by digitisation. The management of Tesco has to be learnt
effectively so that this information can be useful for impacting upon the efficiency, accuracy,
customer service, data protection, safety and security, etc (Griffitts, 2016). There is need to
evaluate and manage different risks associated with the digital technology project. The three type
of risk in digital transformation are mentioned below –
Attaining customer satisfaction
Bad planning
Social media marketing failure
Attaining customer satisfaction
Click & Collect in-store, where consumers shop and pick up online in a bricks-and-mortar
location, is common and its growth is increasing. It allows customers control by encouraging
them to gather at a time suitable for them (Groucutt, and Hopkins, 2015). It also offers
consumers a chance to engage more with the company by driving foot traffic into the shop. The
revenue from orders from Click & Collect depends on the eCommerce function. Yet it can be
easy and straightforward for in-store workers to engage with if the transactions do not count in-
store, notwithstanding this being critical to driving full profit. ECommerce departments also do
not experience the pain of bad system development for stores on the flip side, and often
underinvest in making things right. The push-pull of a better consumer service and consequent
rewards between store operations and e - commerce teams keeps getting in the way.
Bad planning will lead to loss in business
The term bad planning refers to the low degree of collaboration and communication among
all business units (Hair Jr, and et. al., 2015). Therefore, one of the key problems relevant to the
digital project plan of TESCO that describes the improvements and is used to handle persons that
3
help to create various stages that are used in the completion of all work according to the agreed
plans. This also extends to the development of Group company refers to the communication and
design of efficient actions designed for more efficient project management.
Social media marketing failure
Know the target demographic
This may sound like common sense, but ignoring the target demographic is a leading cause of
unsuccessful social media marketing strategies (Hugos, 2018). The social network that is used to
execute marketing strategy is decided by the target audience. Before tailoring the advertisement
to the platform, there is a good view of the audience and the platform they want. The
management of the publicity strategy includes social media. Tesco is geared towards creating
goods for young people.
Speaking about yourself
For several social media marketing campaigns, another big cause of failure is talking too much
about you or your brand, and not enough about target audience. This is not only not helpful to
your business, but it can also be detrimental and drive future buyers away from your firm.
Explore the potential mitigation and contingency plans and consider the budgetary implications
of these plans
A contingency plan is a strategy, and it takes a great deal of research and brainstorming, like any
plan (Kladou, and et. al., 2016). And there are precautions to take, like any good idea, to
guarantee that you're doing things right. Resources Define and Prioritize: Study your business
and list the main resources, such as teams, instruments, services, etc and prioritise the list from
the most relevant to the least important.
Draft Backup Plan: Beginning with what is most important to Tesco's survival. As time allows, a
proposal is made. Whatever the strategy, the concept behind each should be the measures taken
to restore the company's usual service, worrying about communications, the roles of people,
timelines, etc.
Share the plan: The next move needs approval of the contingency plan and make it transparent
for the contingency plan to be copied. Make sure everyone in the business has a copy. If it has
not been adequately articulated, a contingency plan, no matter how detailed, is not effective.
4
⊘ This is a preview!⊘
Do you want full access?
Subscribe today to unlock all pages.
Trusted by 1+ million students worldwide
Revisit the Plan: In cement, a backup plan is not chiselled. To reflect changes to the organisation,
it must be revisited, updated and preserved. The contingency plan must be revised to handle
them as new staff, technology and services enter the scene. Contingency coordination is also part
of risk control in project management. Any project manager is mindful that just an outline is a
schedule (Lane, 2015). The project will reach beyond those lines occasionally. In their strategy,
the more a planner will prepare for opportunity, the more successful it can be. Yet risk control
isn't the same as preparing for contingency. Risk assessment is about the detection, measurement,
prevention, reduction, transition, distribution and recognition of risk, whereas an emergency
response is about the implementation of actions to be taken when a specific crisis happens. They
do share, though the element of what to do when the danger arises.
Task 2
Pareto analysis
Joseph M. Juran, a Romanian-born American engineer and leadership strategist, proposed the
concept in the late 1940s and labeled it until after the American economist Vilfredo Pareto, who
noticed that 20% of the population earned 80% of Italy's revenue (Larson, and Draper, 2015). In
some other nations, Pareto later conducted surveys and discovered to his dismay that a similar
distribution applied.
For almost all we can extend the 80/20 law to:
20 percent of the goods and services produce 80 percent of consumer concerns.
80% of the schedule's disruptions are the product of 20% of the potential reasons of the
delays.
80 percent of your benefit is paid for by 20 percent of your goods and services.
80 percent of your market profits are generated by 20 percent of its client base.
20 percent of faults in a machine cause 80 percent of the difficulties.
On this are eight steps, using Pareto Analysis, to define the key triggers on which the
company should focus:
Build an x-axis vertical bar map with reasons and a y-axis count (number of occurrences).
Coordinate the line graph in the decreasing order of value of the cause, which is first, the
cause with the highest count.
5
Paraphrase This Document
Need a fresh take? Get an instant paraphrase of this document with our AI Paraphraser
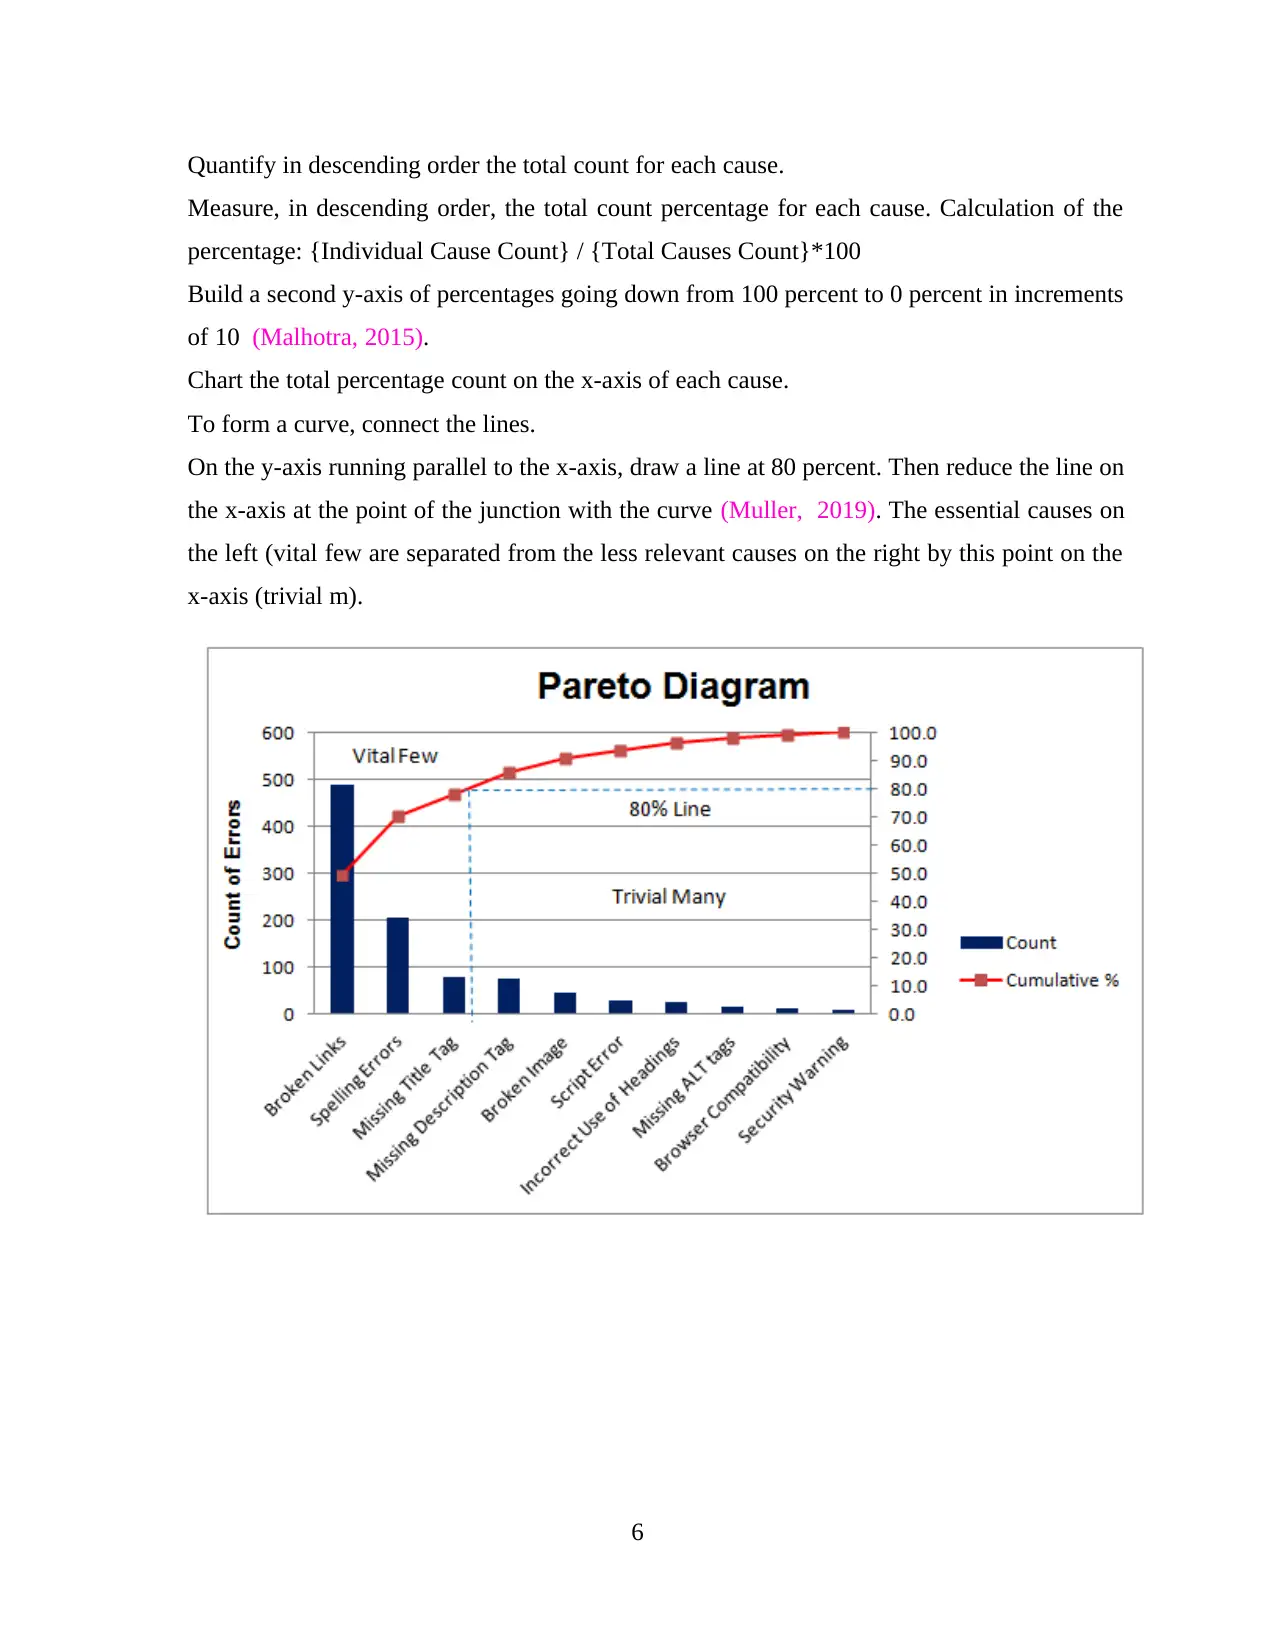
Quantify in descending order the total count for each cause.
Measure, in descending order, the total count percentage for each cause. Calculation of the
percentage: {Individual Cause Count} / {Total Causes Count}*100
Build a second y-axis of percentages going down from 100 percent to 0 percent in increments
of 10 (Malhotra, 2015).
Chart the total percentage count on the x-axis of each cause.
To form a curve, connect the lines.
On the y-axis running parallel to the x-axis, draw a line at 80 percent. Then reduce the line on
the x-axis at the point of the junction with the curve (Muller, 2019). The essential causes on
the left (vital few are separated from the less relevant causes on the right by this point on the
x-axis (trivial m).
6
Riskit analysis
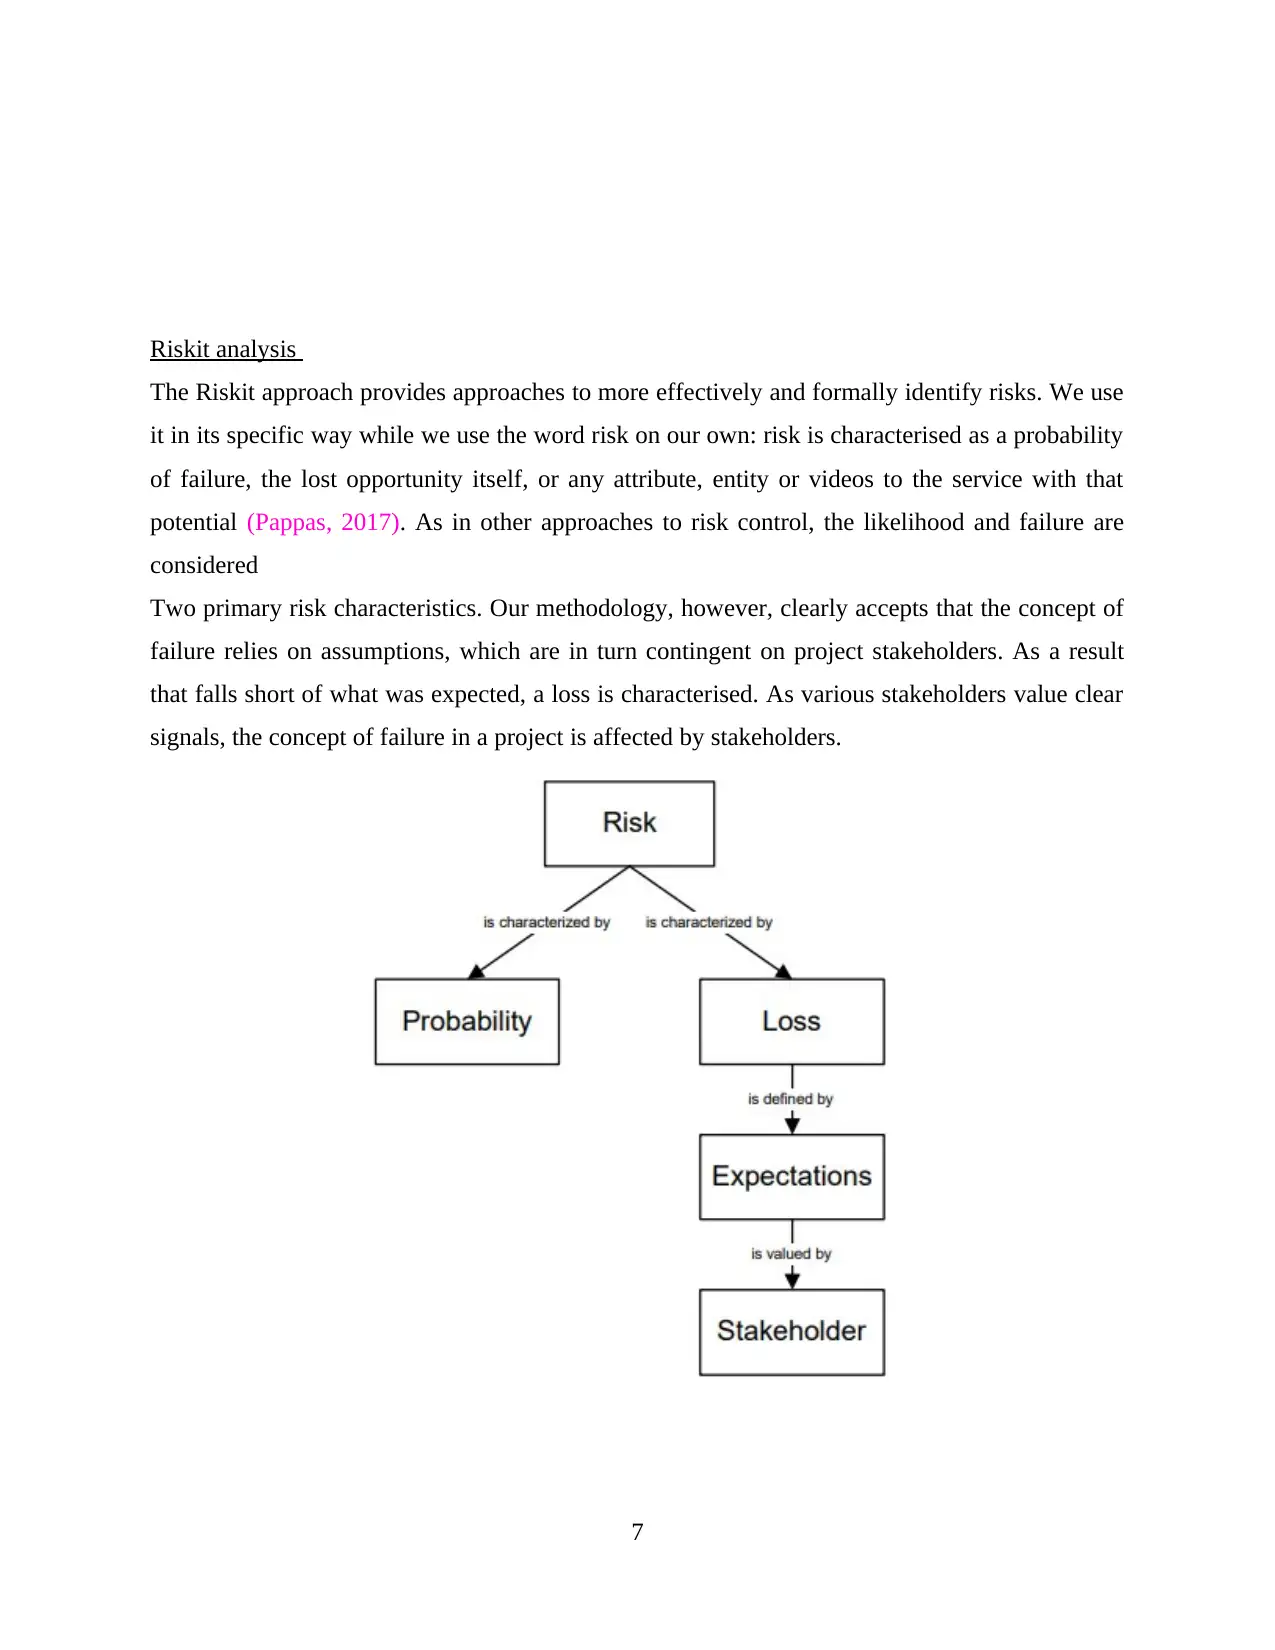
The Riskit approach provides approaches to more effectively and formally identify risks. We use
it in its specific way while we use the word risk on our own: risk is characterised as a probability
of failure, the lost opportunity itself, or any attribute, entity or videos to the service with that
potential (Pappas, 2017). As in other approaches to risk control, the likelihood and failure are
considered
Two primary risk characteristics. Our methodology, however, clearly accepts that the concept of
failure relies on assumptions, which are in turn contingent on project stakeholders. As a result
that falls short of what was expected, a loss is characterised. As various stakeholders value clear
signals, the concept of failure in a project is affected by stakeholders.
7
⊘ This is a preview!⊘
Do you want full access?
Subscribe today to unlock all pages.
Trusted by 1+ million students worldwide
The Riskit approach consists in an explicit description of the project's goals, limitations and other
drivers. Danger is a relative notion; its sense relies on assumptions that are linked to a situation.
It is important to formalise the assumptions as much as possible to analyse risks. We refer to
them as priorities when goals are understood and established. While certain targets should not be
defined exactly, they can at least be Identified and recorded as far as the available knowledge
requires (Pike, 2015). In order to aid in the target description, the Riskit approach includes an
explicit stage and supporting models. The Riskit approach attempts to qualitatively model and
log risks. Instead of requiring quantitative assessment of risk likelihood and effects to take place
early in the project, the Riskit approach offers computational and graphical methods to
qualitatively model various facets of risks. The estimates of failure in communication platform
are readily elevated considering the uncertainty of these calculations and the sometimes vague
risk perceptions(Pike, 2016). There is a stronger foundation for learning pace with risk by
stressing the contextual awareness of the risks.
Both ratio and ordinal scale risk rating data can be used by the Riskit system to accurately
prioritise threats. In the Riskit strategy, the issue of estimation has been minimised. Rather than
using the ratio scale statistics, always an impractical target, to compel risk quantification, the
Riskit approach
Trying only to obtain the requisite good stress for contingency planning to take place. It may be
adequate to recognise the greatest risks and recommend action to manage them for management
purposes, when the precise values of chance and failure may not always be appropriate. The
specification of the type of metric that can be used in risk analysis should be based on the
analysis priorities and the availability of risk data.
The Riskit system uses the utility loss principle to rank risk-related losses. Many existing
approaches to risk assessment are focused on a risk rating based on the loss incurred by such
particular project characteristics, such as expense, time delay or efficiency.
A single metric is often used. For two factors, this may be counterproductive. Second, the use of
a single metric, or a limited number of metrics, will produce a clear bias away from the
secondary but influential targets that should be taken into account (Piñeiro-Otero, and Martínez-
Rolán, 2016). Second, research in economics and management science has firmly shown that
choices are taken on the basis of changes in the alternatives' predicted benefit (or lack of utility).
8
Paraphrase This Document
Need a fresh take? Get an instant paraphrase of this document with our AI Paraphraser
Since stakeholder utility functions are likely to be non-linear, the use of direct loss metrics will
lead to incorrect risk assessments and rankings. Therefore to compare and rate risk losses, the
Riskit approach uses the principle of utility loss. The Riskit approach specifically models
different stakeholder viewpoints. There is more than one stakeholder in both ventures who is
involved in their outcomes (Purvis, 2015). They may have distinct goals and anticipation
thresholds. Risk assessment should be focused on the understanding of these standards and goals
for stakeholders. The contrast of different stakeholder views can not be readily supported by
conventional direct project metric-based approaches, and few risk management approaches seek
to address the problem. By specifically reporting their preferences and independently
determining the utility loss for each, the Riskit approach supports stakeholder viewpoints. The
approach of Riskit has an institutional concept and resources for teaching. There is an
organisational description of the Riskit approach such that it can be conveniently and reliably
implemented.
Ishikawa diagram
Ishikawa diagrams are causal diagrams created by Kaoru Ishikawa that display the possible
causes of a single occurrence (also called fishbone diagrams, herringbone diagrams, cause-and-
effect diagrams, or Fishikawa). The Ishikawa diagram's common uses are product design and
avoidance of quality defects to classify possible causes having an aggregate impact. A source of
difference is any cause or explanation for imperfection. To define and describe these origins of
heterogeneity, factors are typically classified into major categories. The deficiency is seen as the
neck of the fish, looking to the right, only with effects continuing as fishbones to the left; the ribs
branching off the backend for major causes, to quite so many levels as needed, with sub-
branches for root causes. In the 1960s, Kaoru Ishikawa, who established quality control practises
in the Kawasaki shipyards, popularised Ishikawa diagrams, becoming one of the founding fathers
of modern stakeholders in the context.
In the 1920s, the core premise was first used, and is regarded one of the seven quality
instruments(Rancati, Gordini, and Capatina, 2016). Along with its shape, this is known as a
fishbone, similar to the side view of a real object.
Strong intuitive thinking up tool that can spark additional root problem examples
9
Absolutely central if the primary cause is located many times or in the same separate
cause tree.
Requires us to instantly see all triggers
Good visualisation for involving communities with problems
Literature review
The leading technological developments that can help our consumers improve consumer
satisfaction, increase revenue and make our companies internally effective, and they vary from
leveraging some of the mobile engineering applications, analytics, using social media for
customer reviews and developing algorithms to make our supply chain more efficient. The
Internet of Things is used to explain how all the machines in a big shop are connected—bringing
back the data and analysing it to minimise the expense of running any of the stores. Another
excellent technology is RFID (Radio Frequency Identification). That said, potential innovations
such as the adoption of robots in shops and wearable technologies.
10
⊘ This is a preview!⊘
Do you want full access?
Subscribe today to unlock all pages.
Trusted by 1+ million students worldwide
1 out of 13
Related Documents


Your All-in-One AI-Powered Toolkit for Academic Success.
+13062052269
info@desklib.com
Available 24*7 on WhatsApp / Email
![[object Object]](/_next/static/media/star-bottom.7253800d.svg)
Unlock your academic potential
Copyright © 2020–2026 A2Z Services. All Rights Reserved. Developed and managed by ZUCOL.