Managerial Finance Report: Ratio Analysis of Tesco and Sainsbury
VerifiedAdded on  2022/12/30
|19
|4170
|5
Report
AI Summary
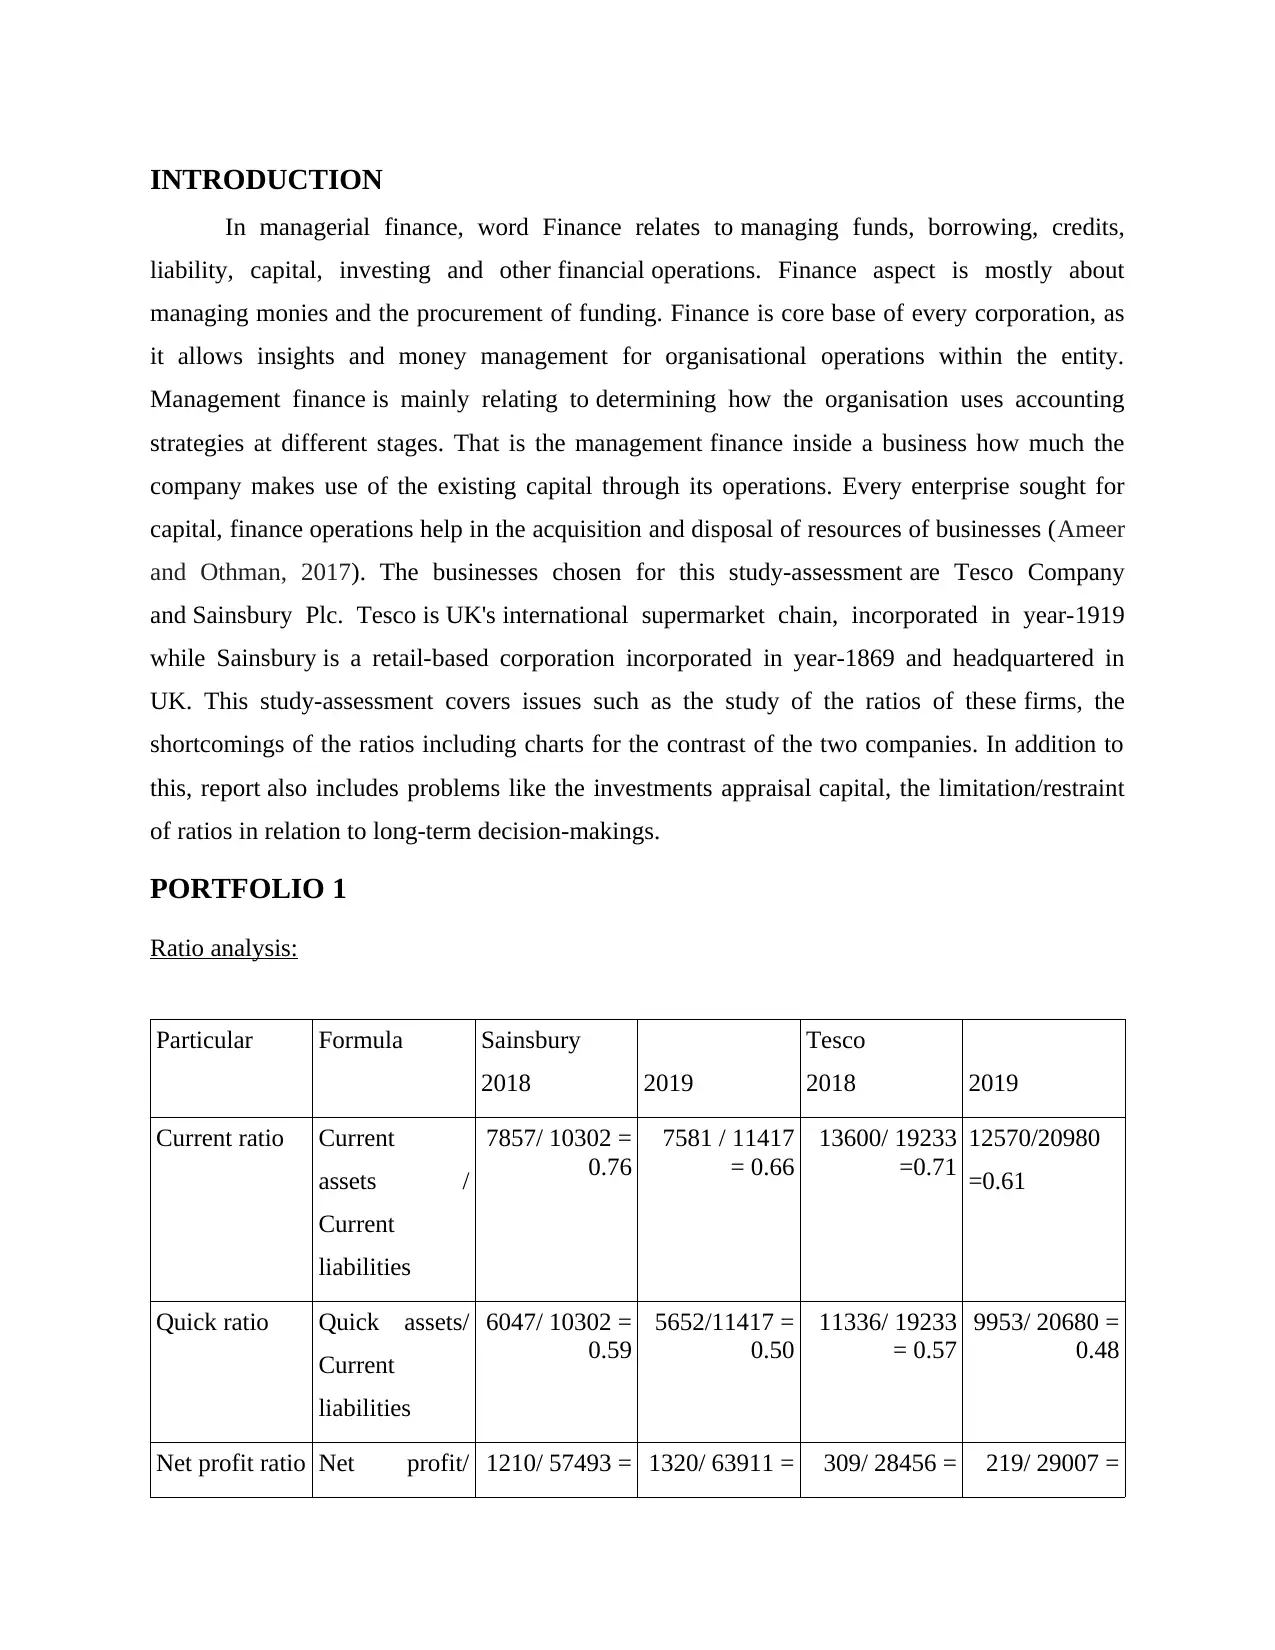
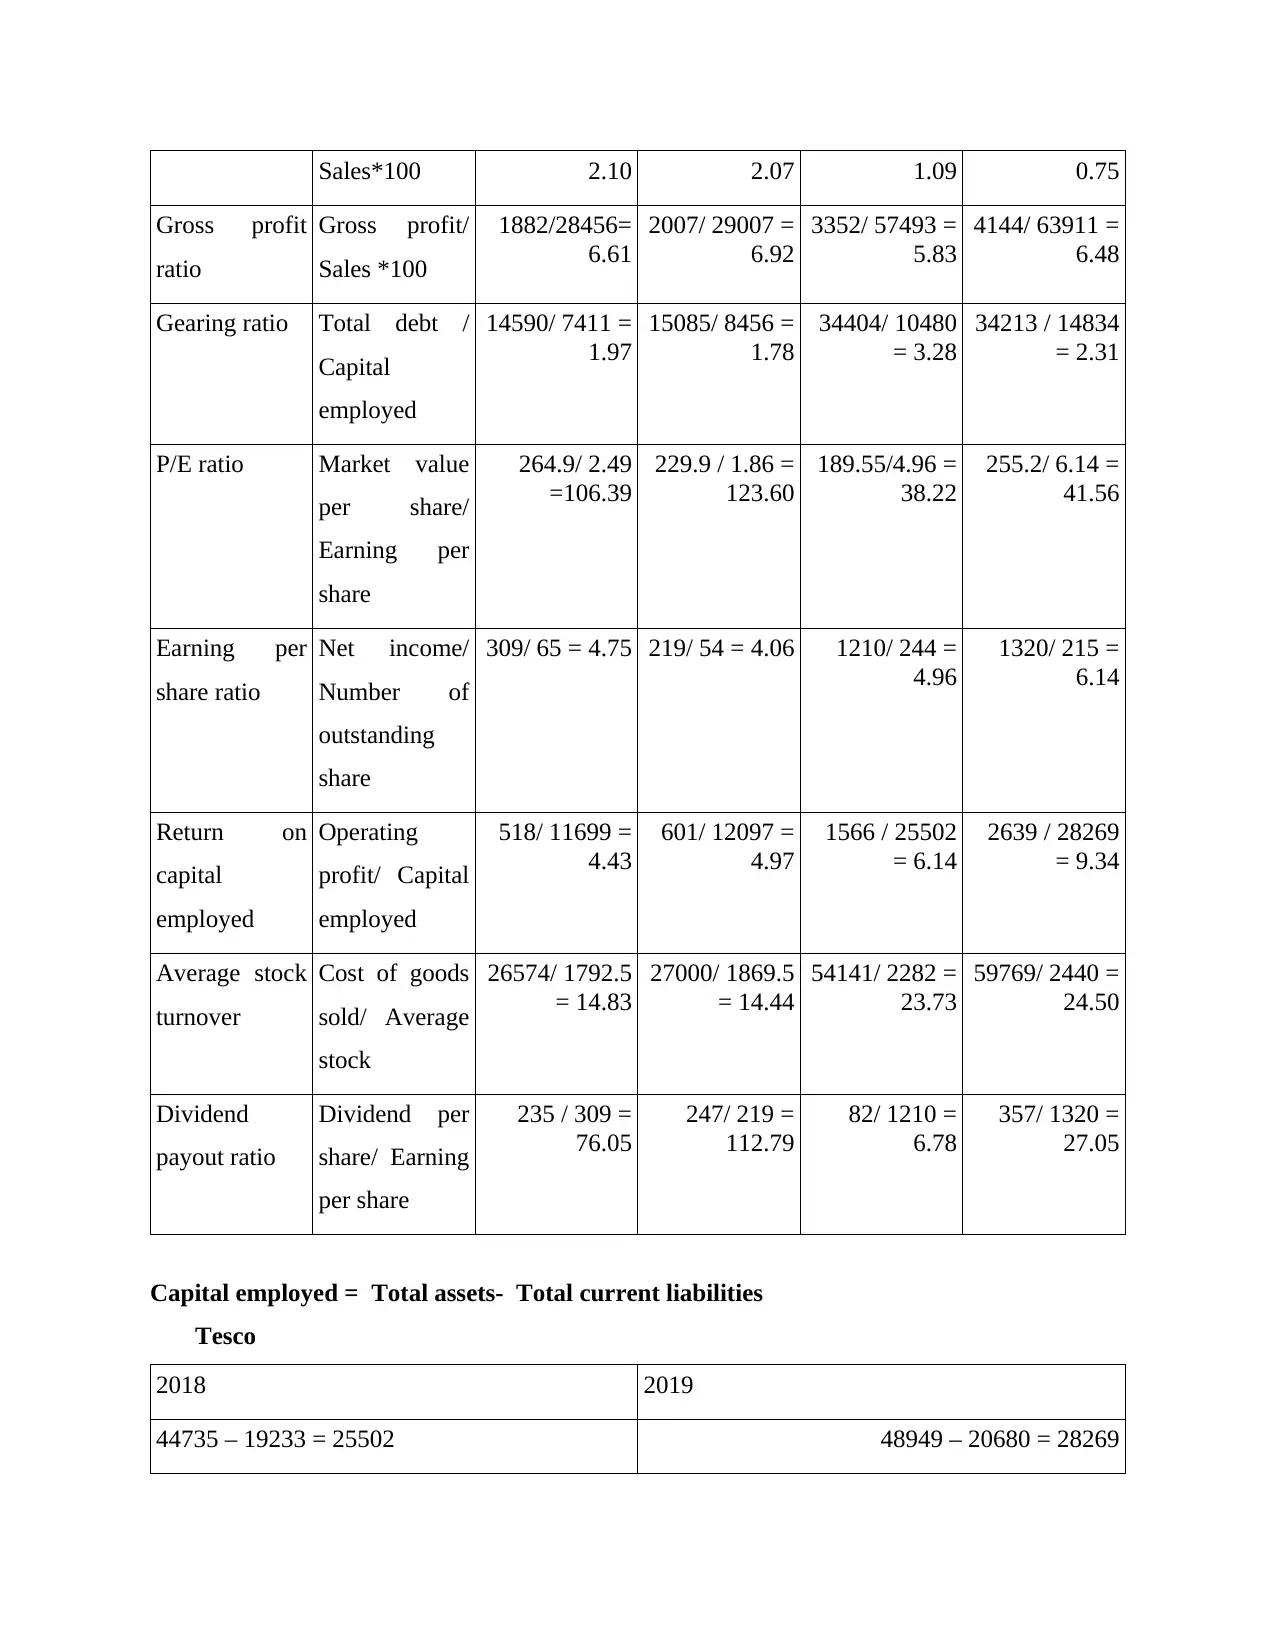
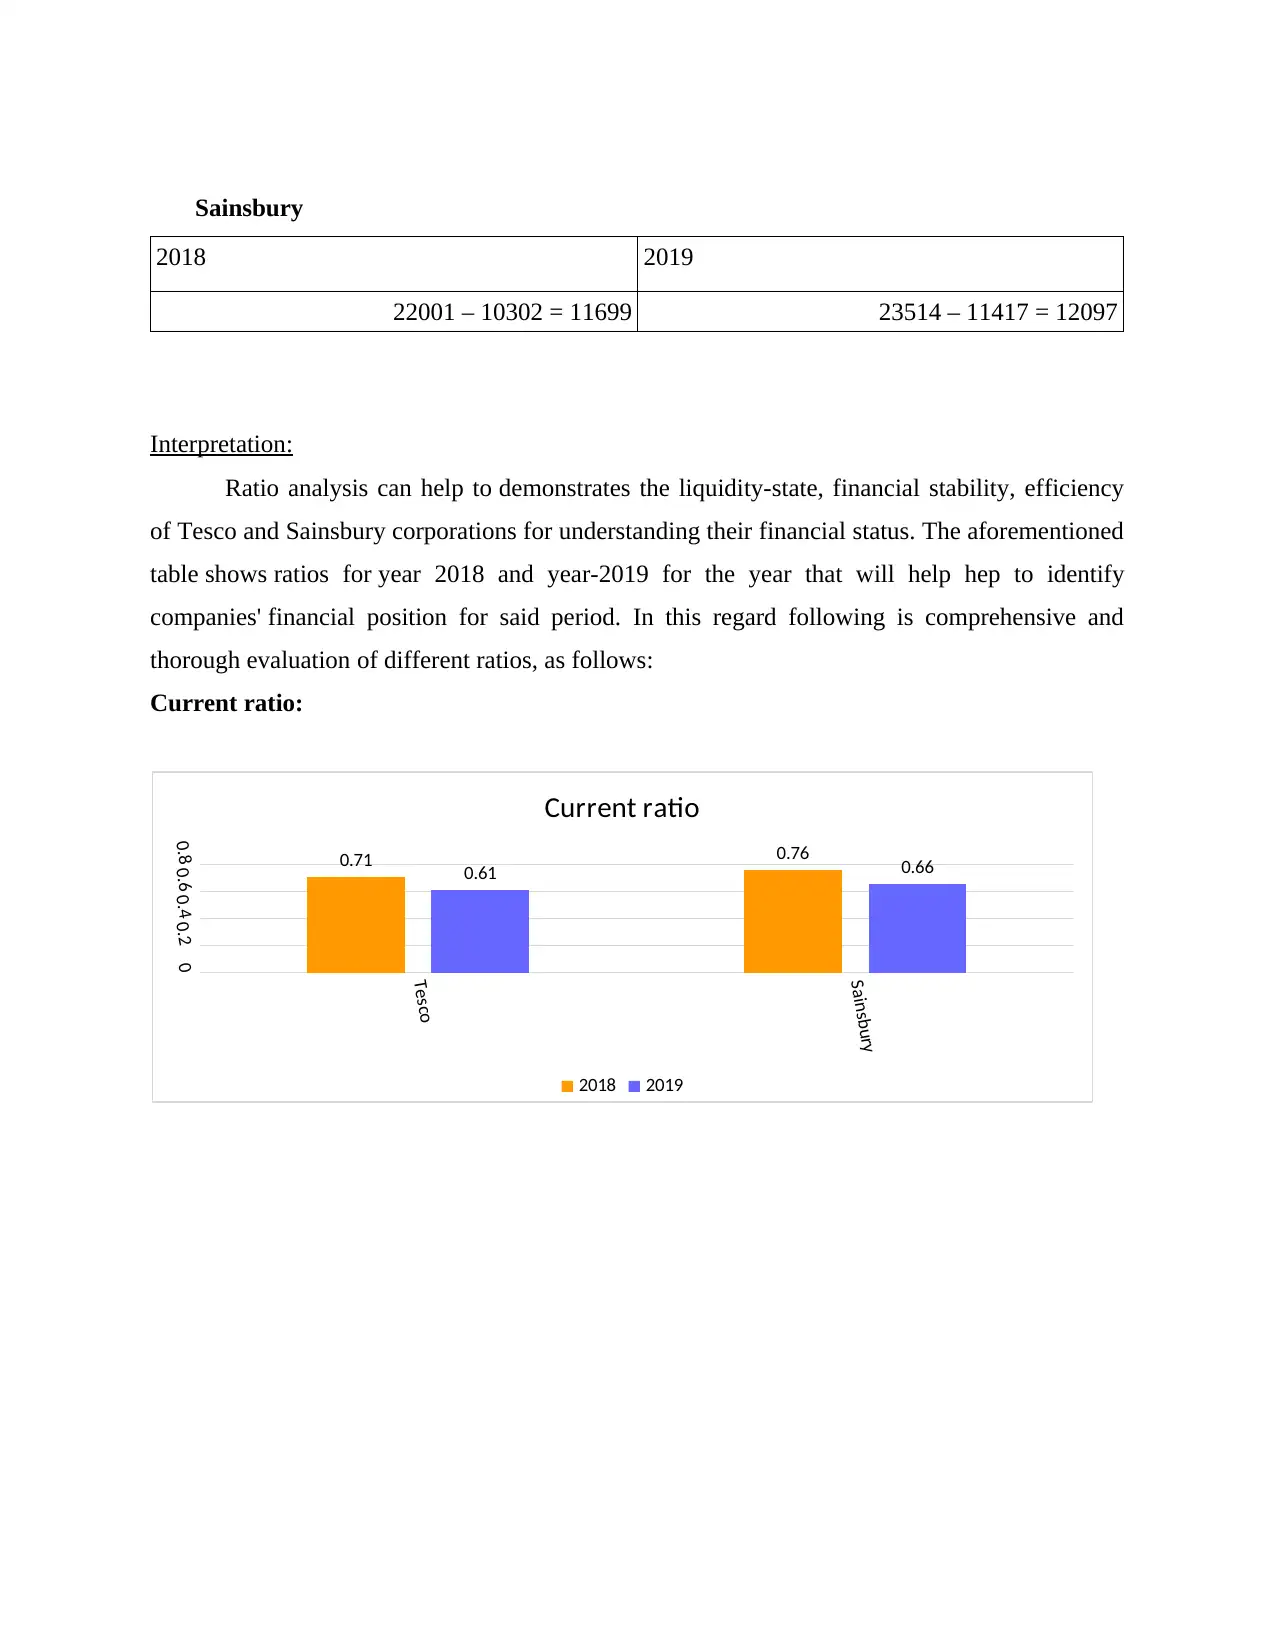
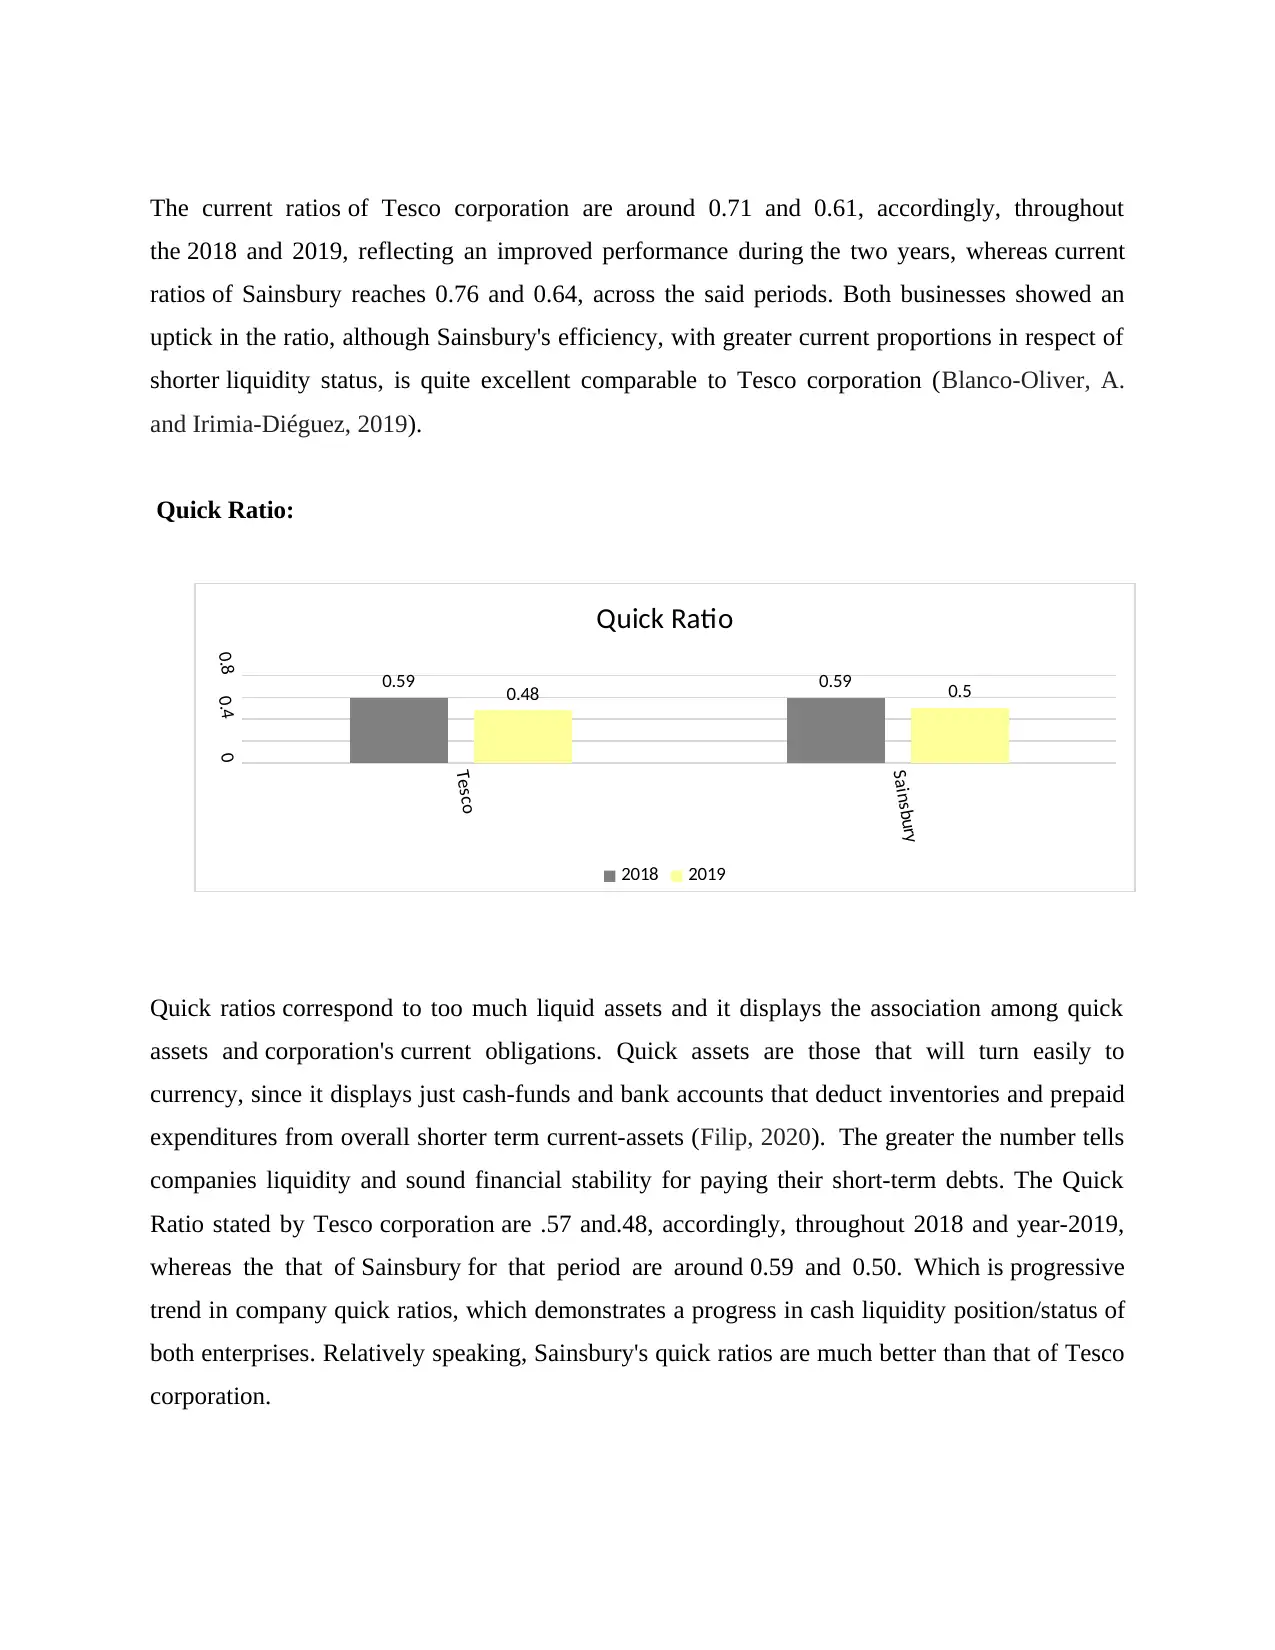
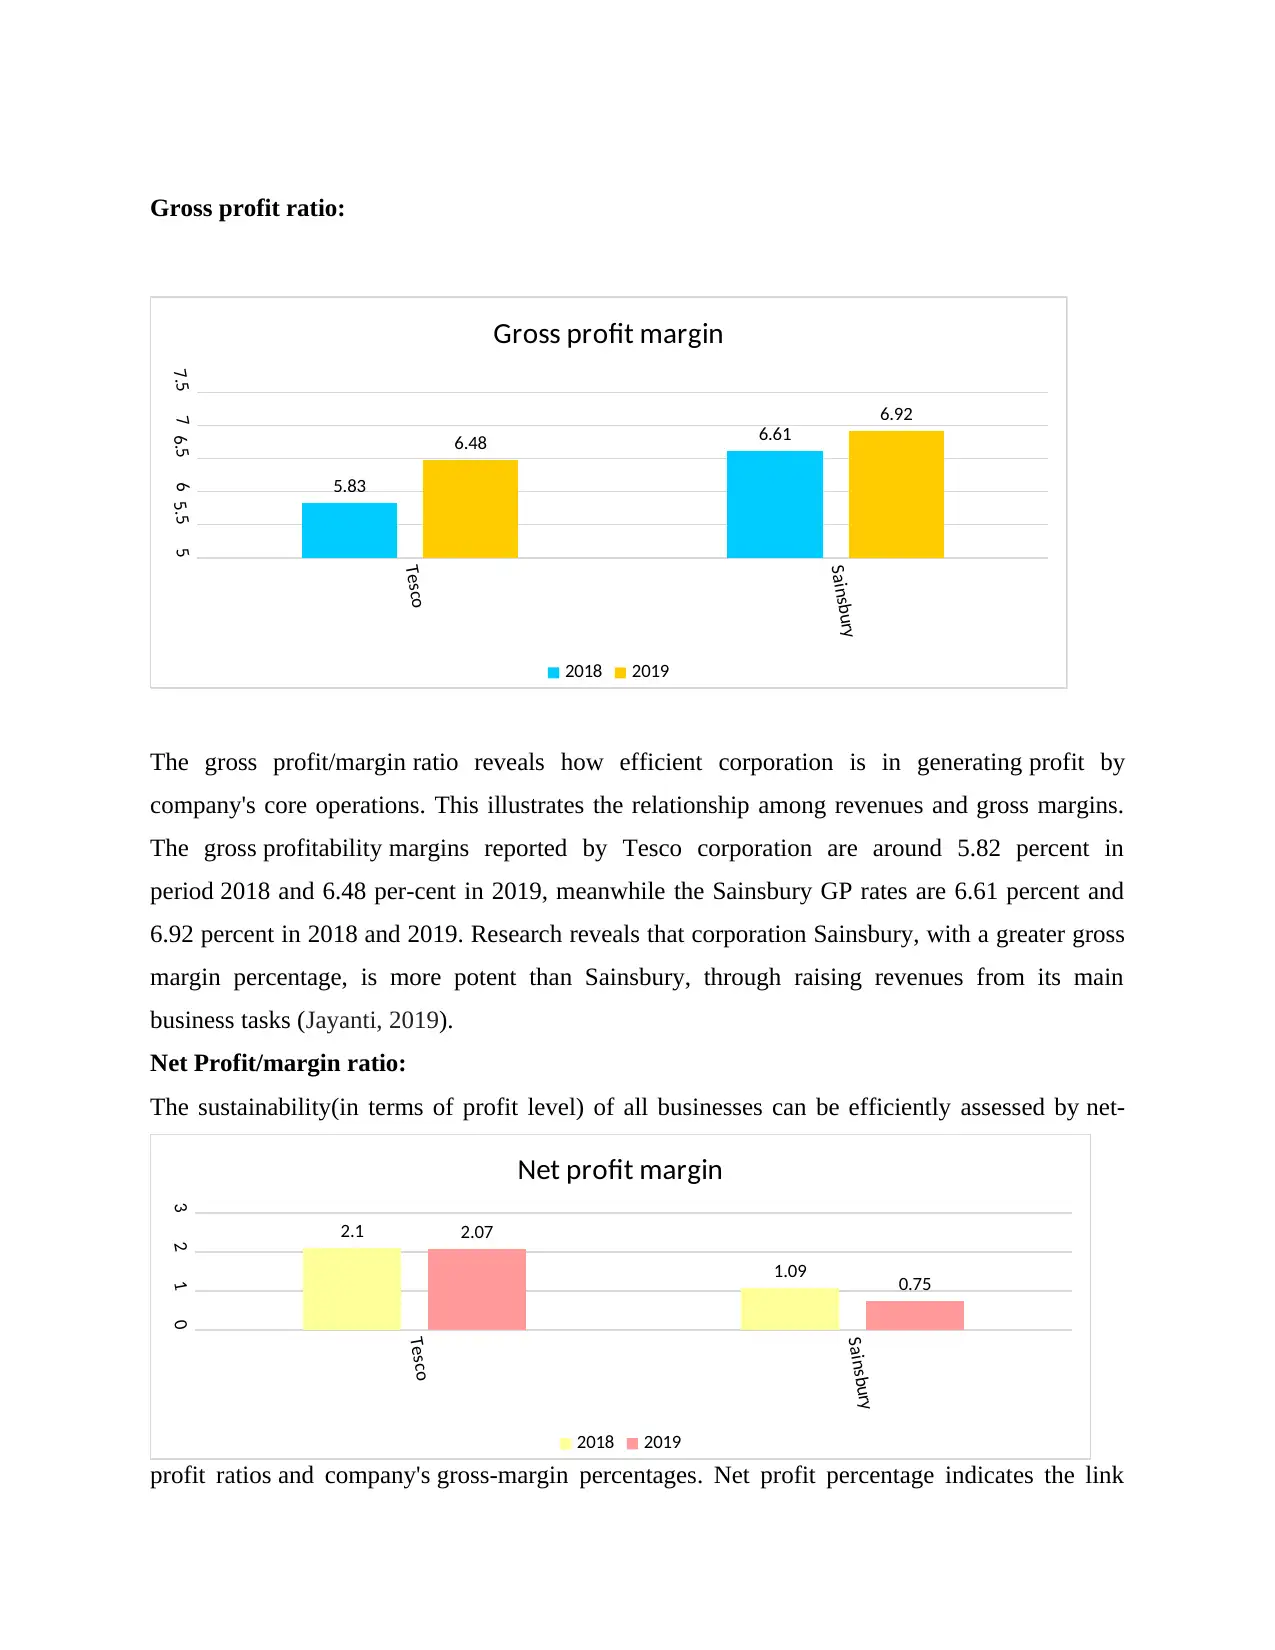
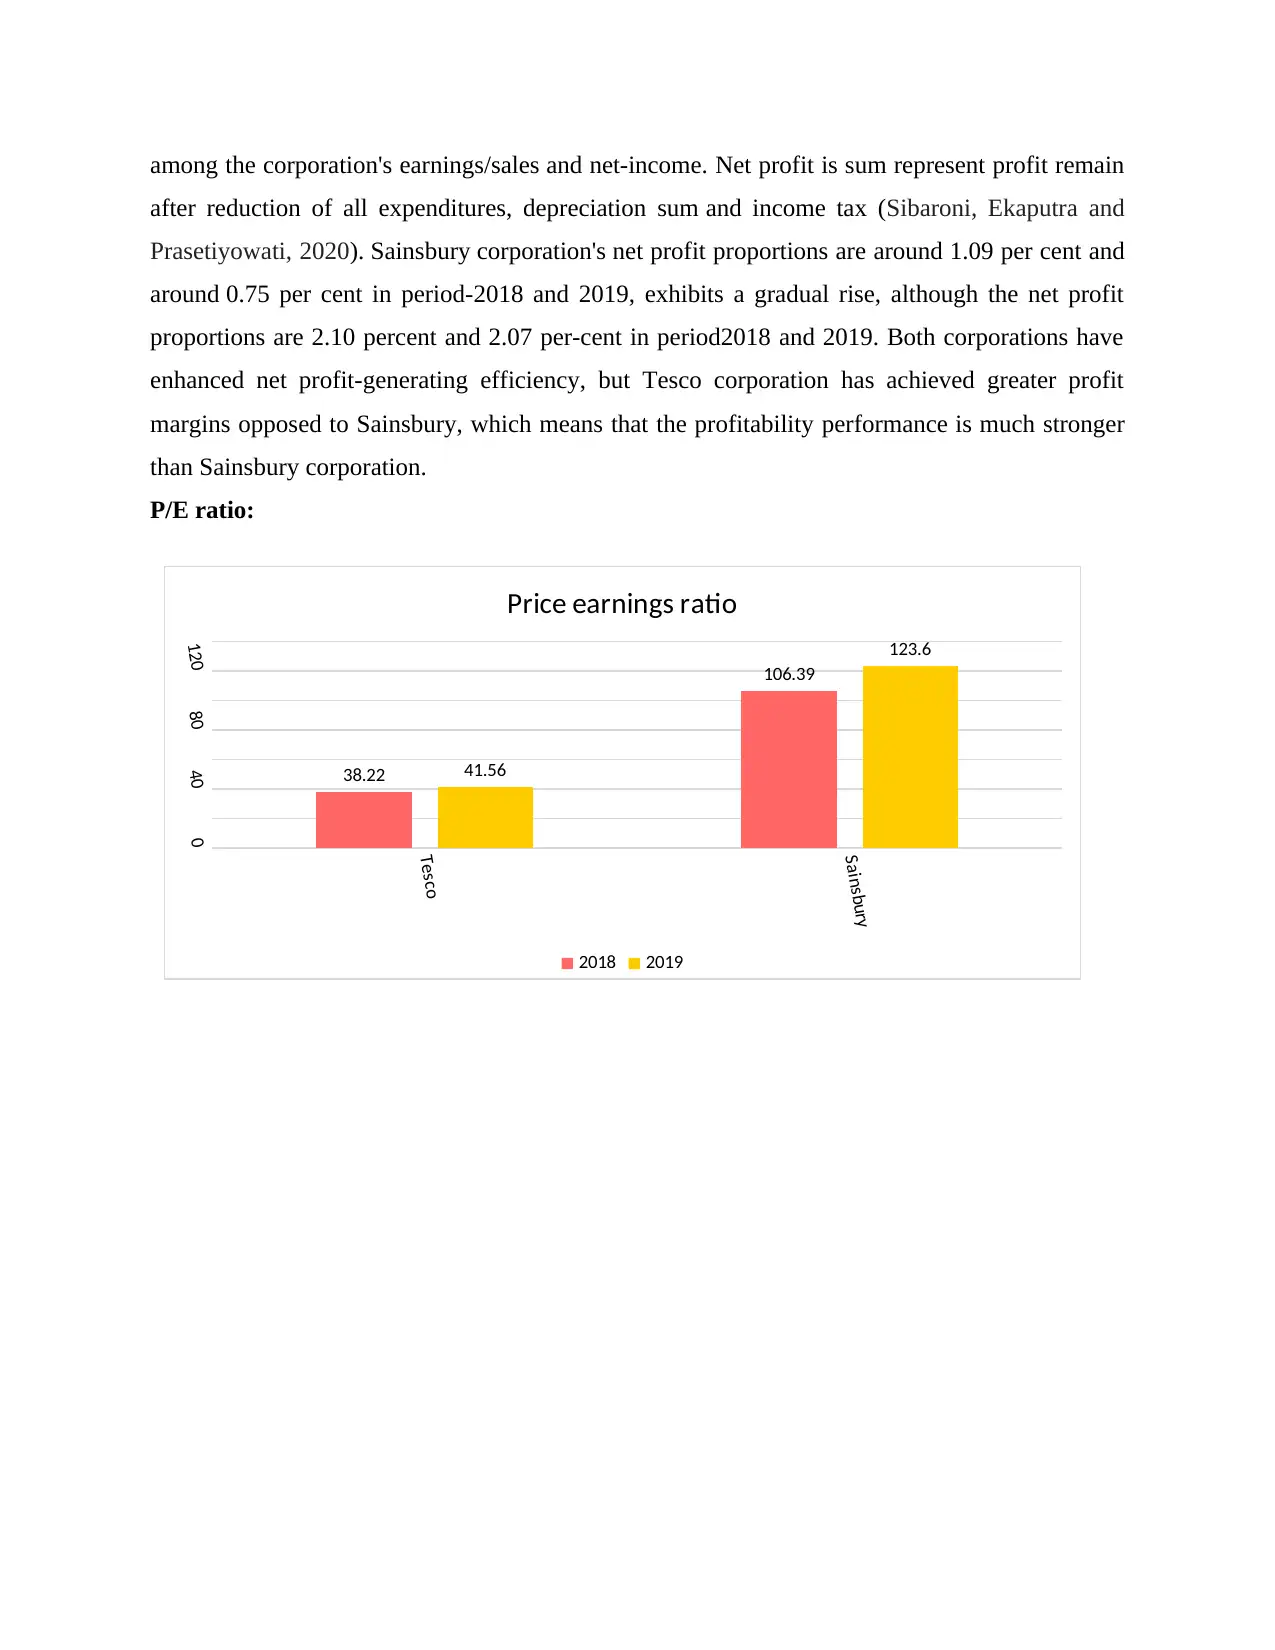
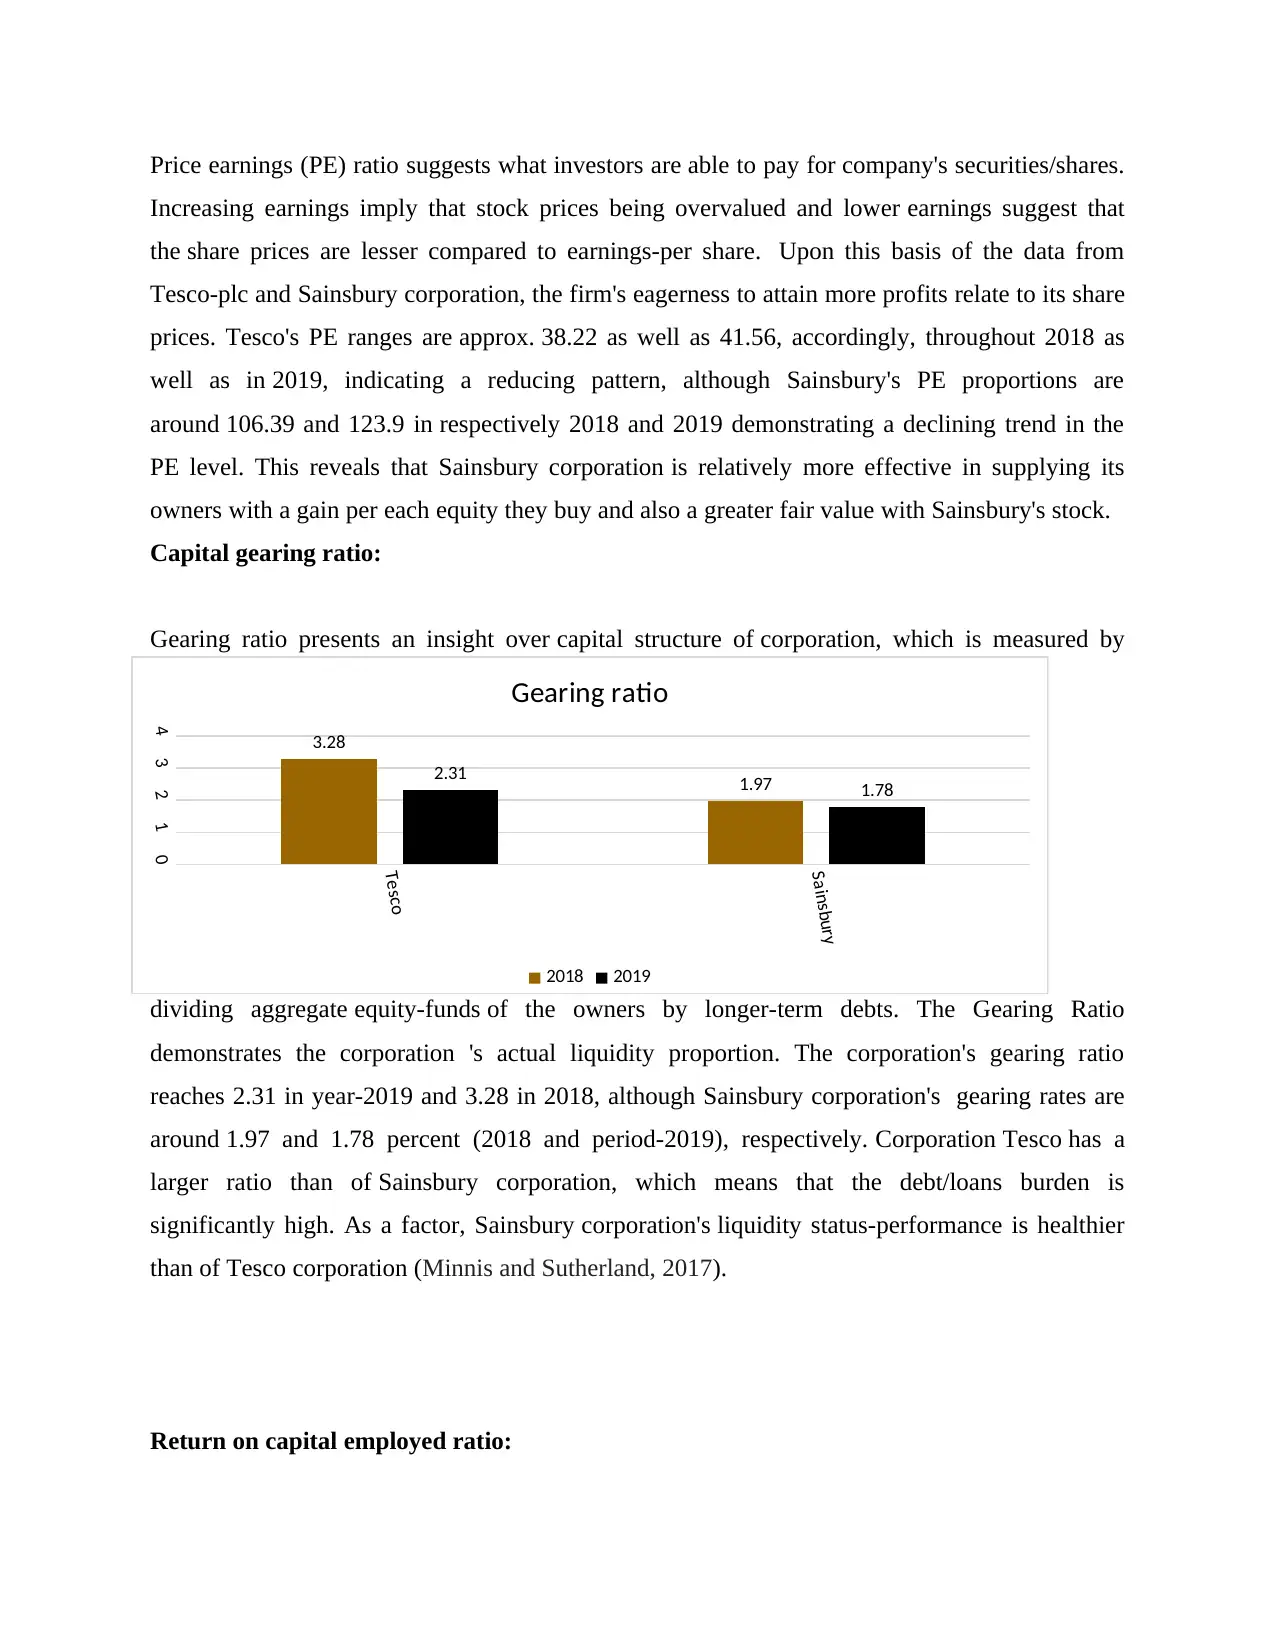
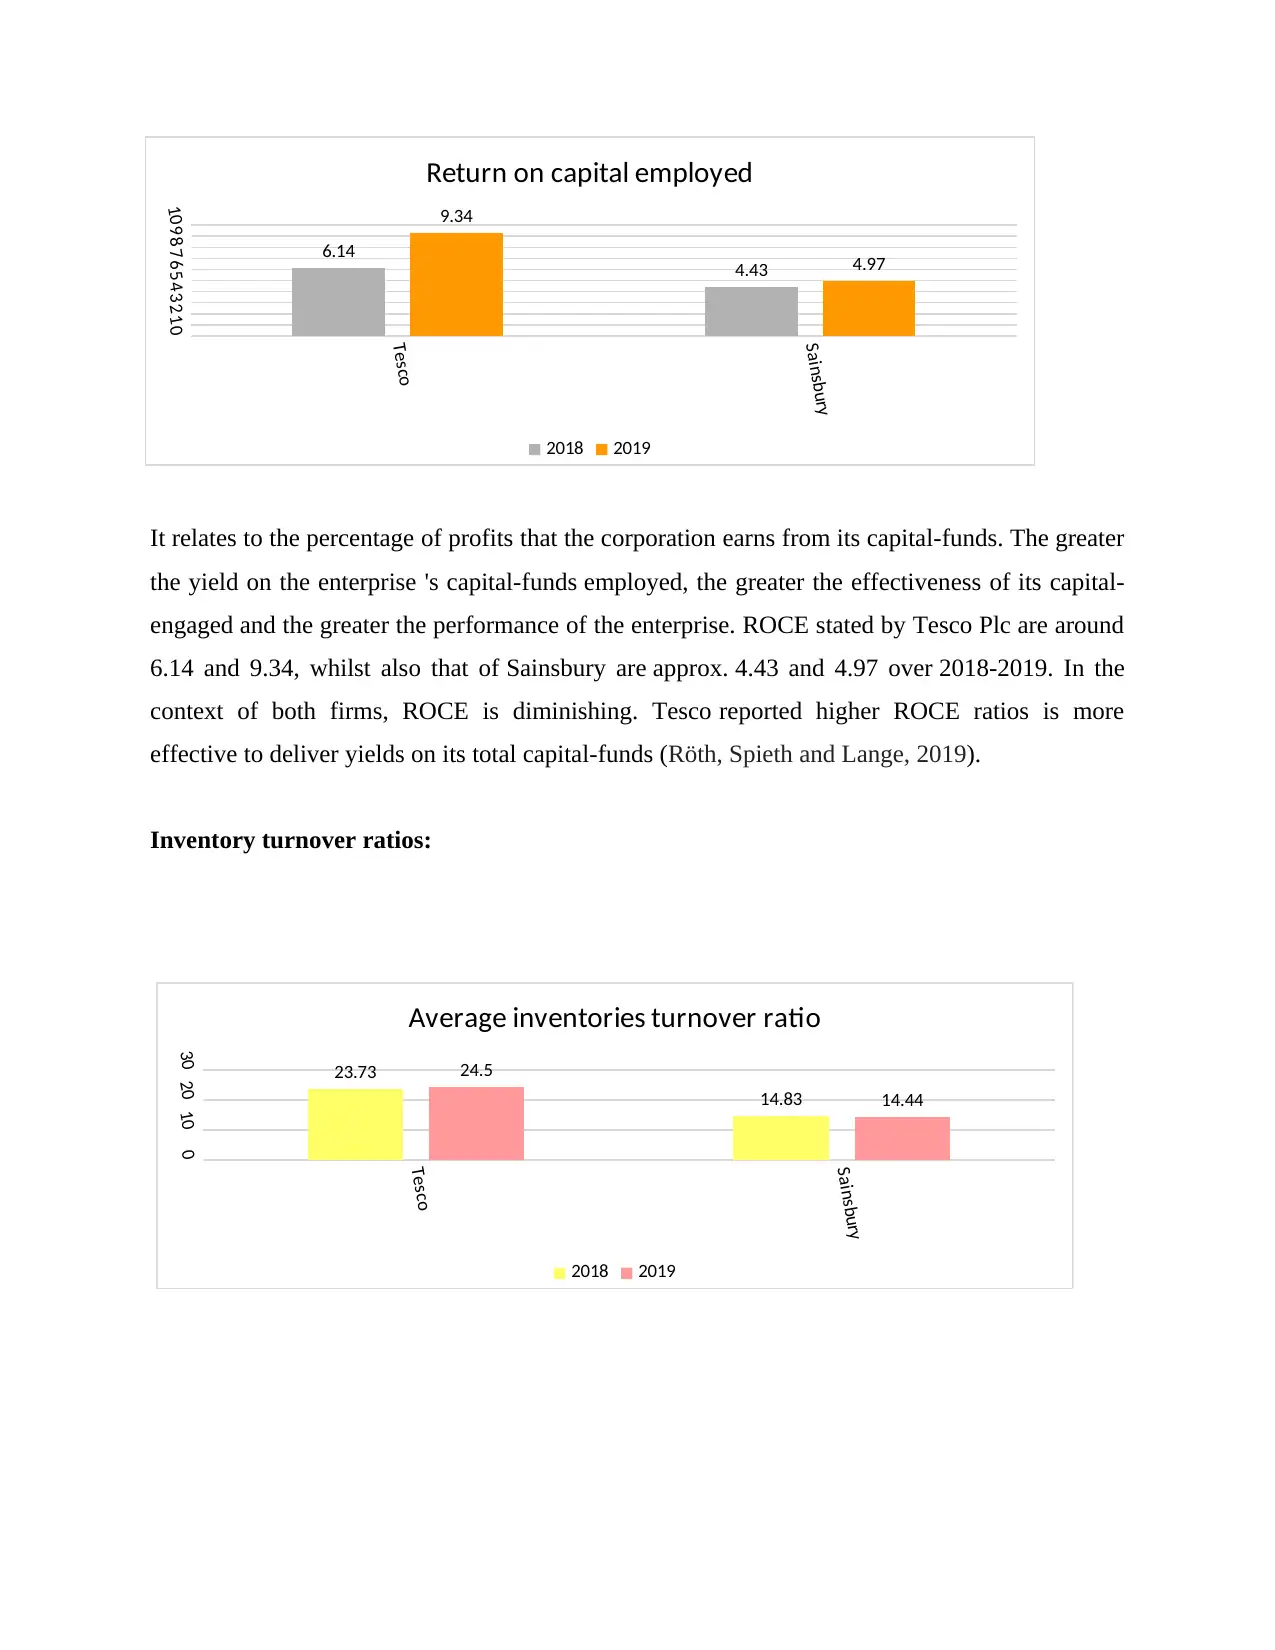
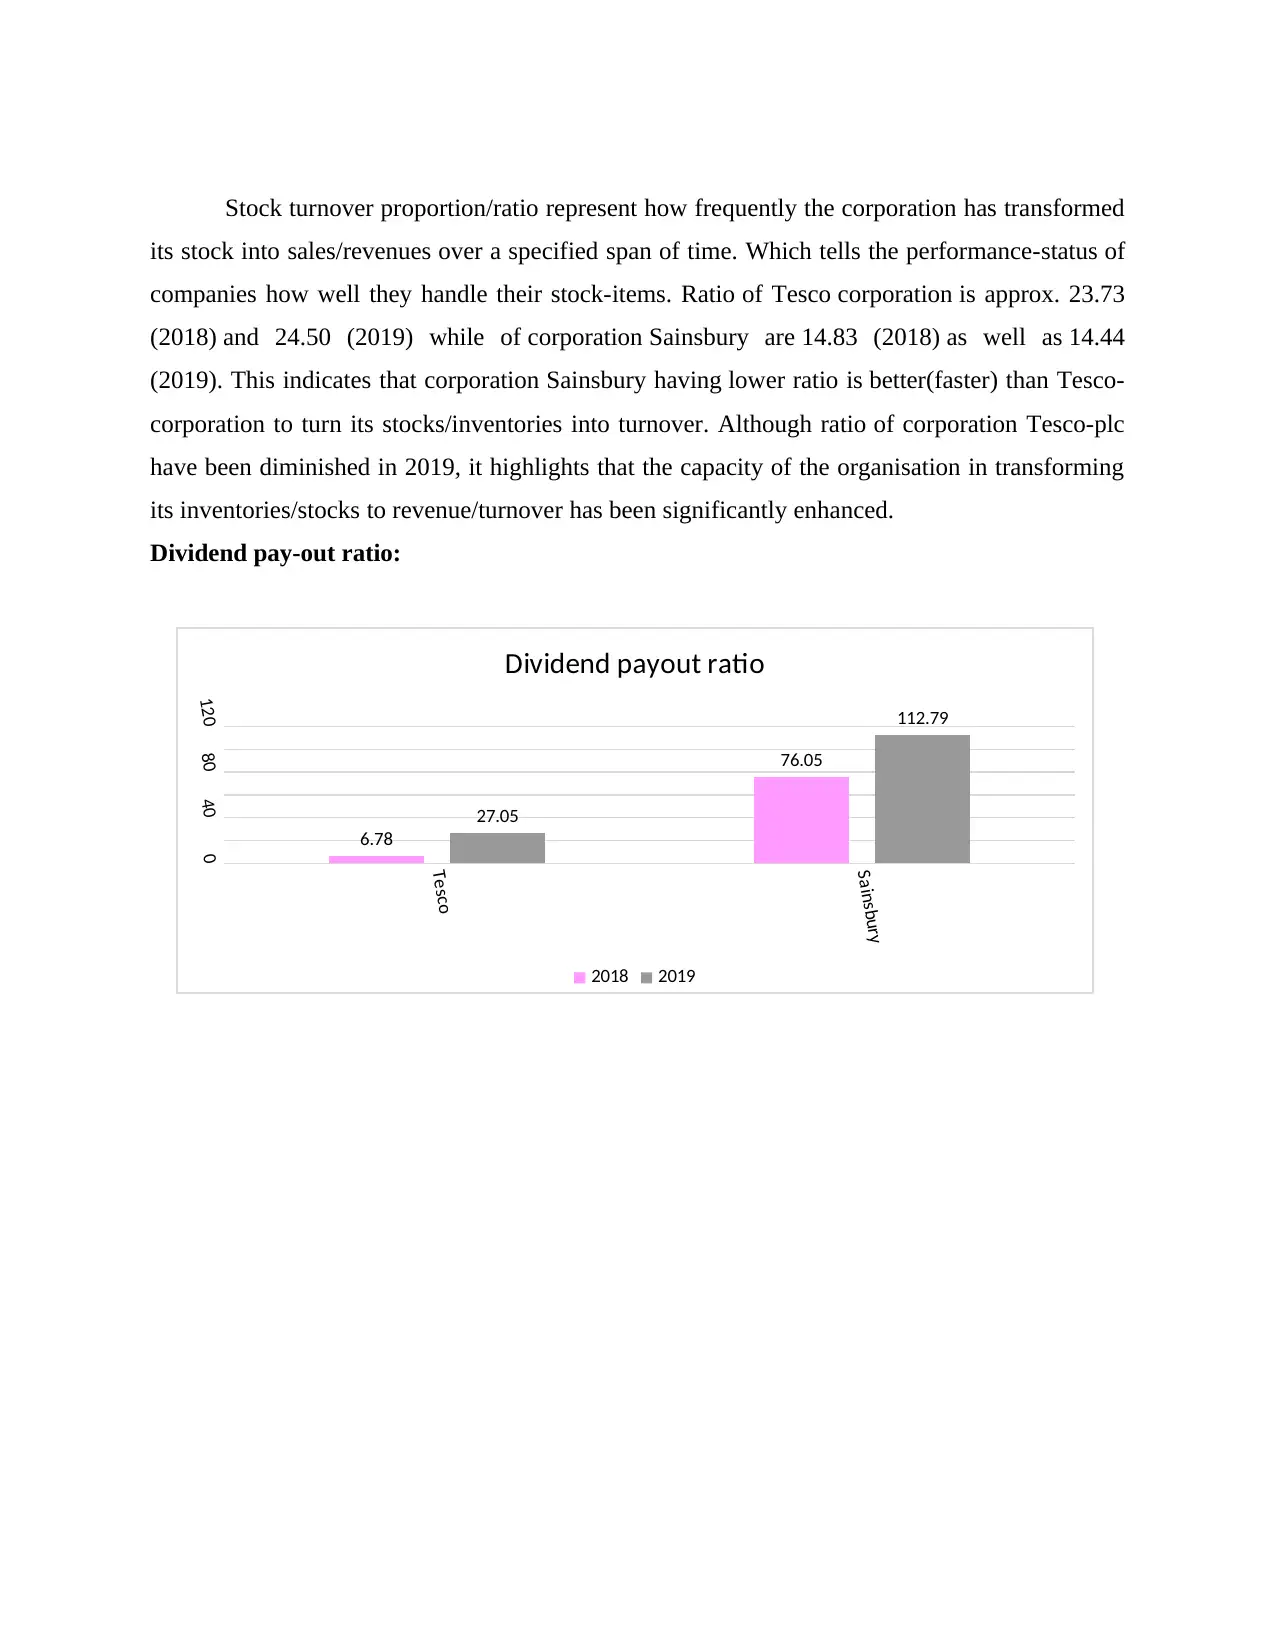
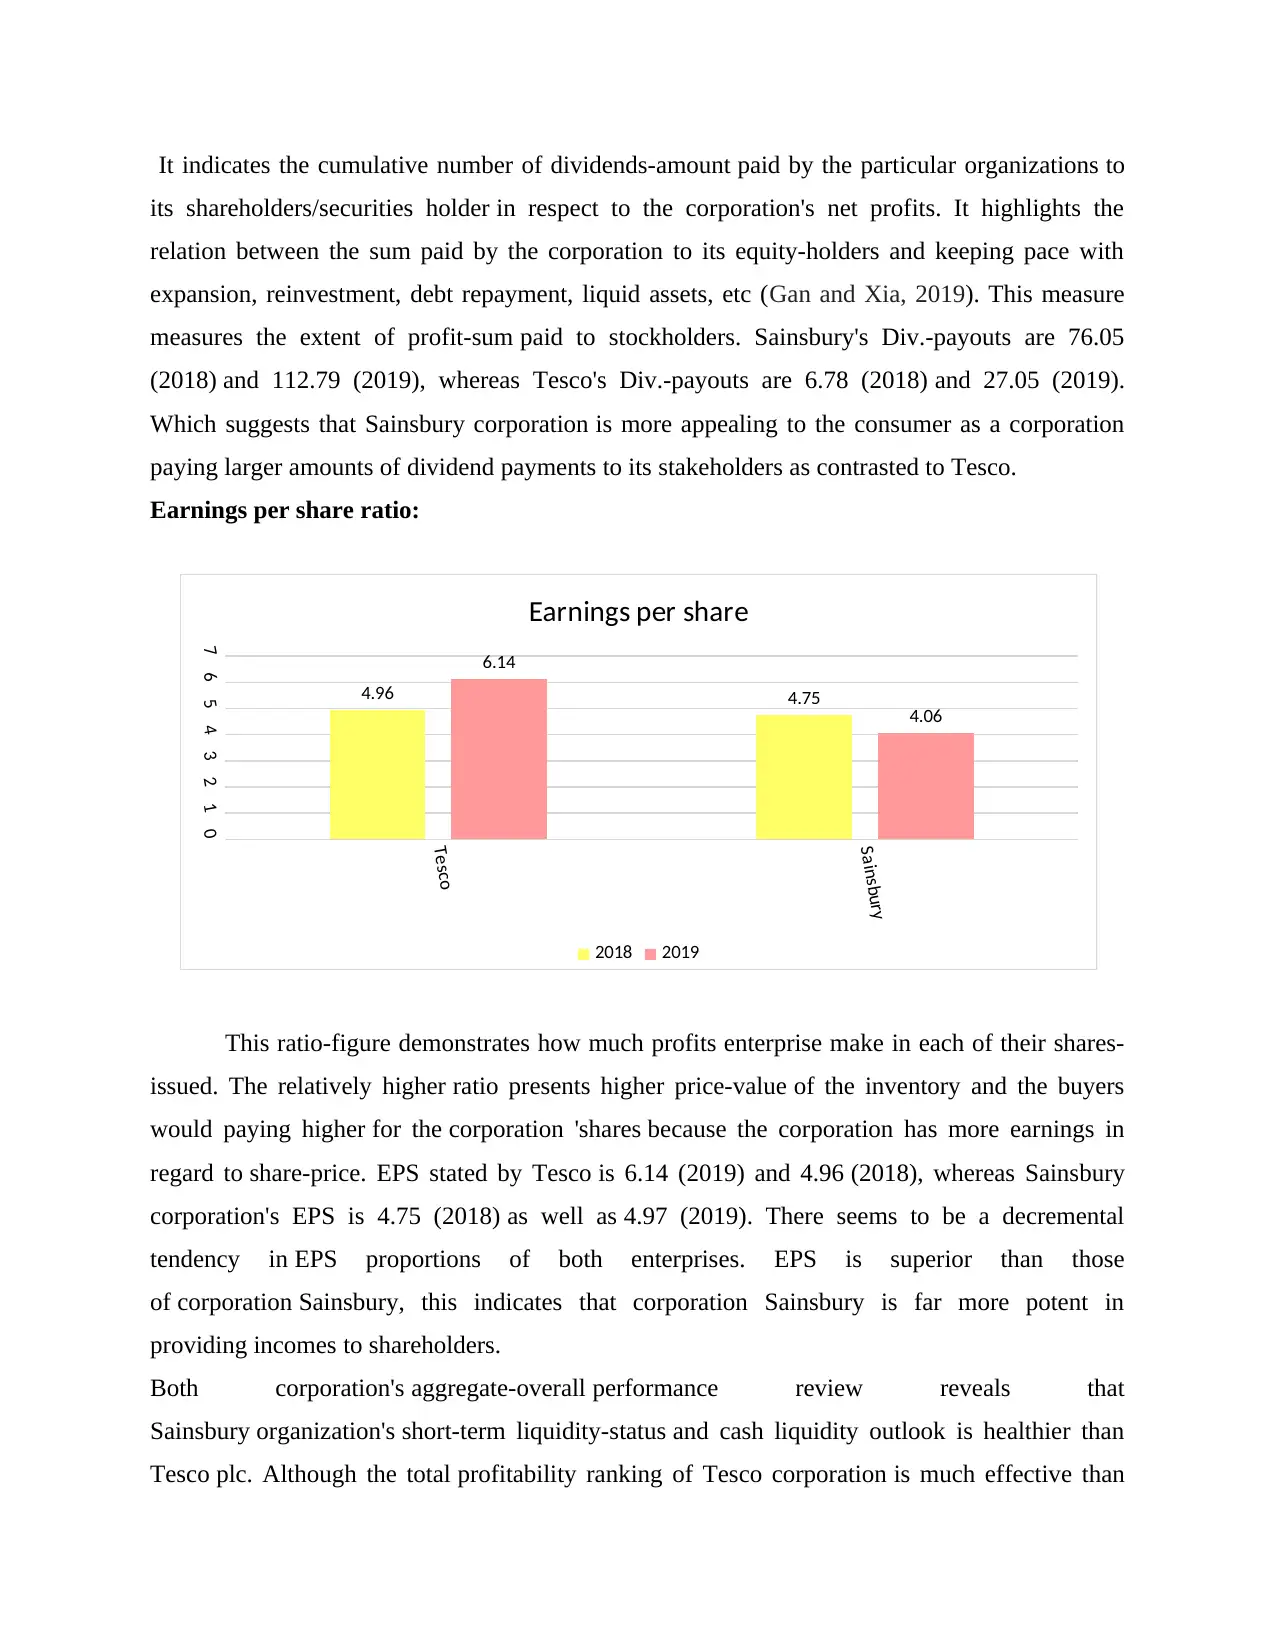
This report presents a comparative financial analysis of Tesco and Sainsbury, two prominent UK-based retail corporations. It begins with an introduction to managerial finance, defining key concepts and their importance in business operations. The core of the report focuses on ratio analysis, examining liquidity, profitability, and efficiency ratios for both companies over a two-year period. Detailed calculations and interpretations of current ratios, quick ratios, gross profit margins, net profit margins, price-to-earnings ratios, gearing ratios, return on capital employed, inventory turnover, dividend payout ratios, and earnings per share are provided. The analysis includes charts and tables to visually represent the financial performance of each company. Furthermore, the report explores investment appraisal techniques, although the specifics are not fully detailed in the provided text. It also addresses the limitations of using ratio analysis and investment appraisal techniques for long-term decision-making. The report concludes with a summary of findings and recommendations for each company, highlighting their strengths and weaknesses based on the financial data analyzed.

Managerial Financial
Paraphrase This Document
Need a fresh take? Get an instant paraphrase of this document with our AI Paraphraser

Table of Contents
INTRODUCTION...........................................................................................................................3
PORTFOLIO 1................................................................................................................................3
Ratio analysis:..............................................................................................................................3
Interpretation:..............................................................................................................................5
Recommendations:....................................................................................................................13
Limitations for using ratio analysis for knowing firms financial position:...............................13
PORTFOLIO 2..............................................................................................................................14
Investment appraisal techniques for project A and project B:...................................................14
a. Investment appraisal techniques:...........................................................................................14
Limitations of using investment appraisal techniques for long term decision-making:............16
CONCLUSION..............................................................................................................................18
REFERENCES..............................................................................................................................19

INTRODUCTION
In managerial finance, word Finance relates to managing funds, borrowing, credits,
liability, capital, investing and other financial operations. Finance aspect is mostly about
managing monies and the procurement of funding. Finance is core base of every corporation, as
it allows insights and money management for organisational operations within the entity.
Management finance is mainly relating to determining how the organisation uses accounting
strategies at different stages. That is the management finance inside a business how much the
company makes use of the existing capital through its operations. Every enterprise sought for
capital, finance operations help in the acquisition and disposal of resources of businesses (Ameer
and Othman, 2017). The businesses chosen for this study-assessment are Tesco Company
and Sainsbury Plc. Tesco is UK's international supermarket chain, incorporated in year-1919
while Sainsbury is a retail-based corporation incorporated in year-1869 and headquartered in
UK. This study-assessment covers issues such as the study of the ratios of these firms, the
shortcomings of the ratios including charts for the contrast of the two companies. In addition to
this, report also includes problems like the investments appraisal capital, the limitation/restraint
of ratios in relation to long-term decision-makings.
PORTFOLIO 1
Ratio analysis:
Particular Formula Sainsbury
2018 2019
Tesco
2018 2019
Current ratio Current
assets /
Current
liabilities
7857/ 10302 =
0.76
7581 / 11417
= 0.66
13600/ 19233
=0.71
12570/20980
=0.61
Quick ratio Quick assets/
Current
liabilities
6047/ 10302 =
0.59
5652/11417 =
0.50
11336/ 19233
= 0.57
9953/ 20680 =
0.48
Net profit ratio Net profit/ 1210/ 57493 = 1320/ 63911 = 309/ 28456 = 219/ 29007 =
⊘ This is a preview!⊘
Do you want full access?
Subscribe today to unlock all pages.

Trusted by 1+ million students worldwide

Sales*100 2.10 2.07 1.09 0.75
Gross profit
ratio
Gross profit/
Sales *100
1882/28456=
6.61
2007/ 29007 =
6.92
3352/ 57493 =
5.83
4144/ 63911 =
6.48
Gearing ratio Total debt /
Capital
employed
14590/ 7411 =
1.97
15085/ 8456 =
1.78
34404/ 10480
= 3.28
34213 / 14834
= 2.31
P/E ratio Market value
per share/
Earning per
share
264.9/ 2.49
=106.39
229.9 / 1.86 =
123.60
189.55/4.96 =
38.22
255.2/ 6.14 =
41.56
Earning per
share ratio
Net income/
Number of
outstanding
share
309/ 65 = 4.75 219/ 54 = 4.06 1210/ 244 =
4.96
1320/ 215 =
6.14
Return on
capital
employed
Operating
profit/ Capital
employed
518/ 11699 =
4.43
601/ 12097 =
4.97
1566 / 25502
= 6.14
2639 / 28269
= 9.34
Average stock
turnover
Cost of goods
sold/ Average
stock
26574/ 1792.5
= 14.83
27000/ 1869.5
= 14.44
54141/ 2282 =
23.73
59769/ 2440 =
24.50
Dividend
payout ratio
Dividend per
share/ Earning
per share
235 / 309 =
76.05
247/ 219 =
112.79
82/ 1210 =
6.78
357/ 1320 =
27.05
Capital employed = Total assets- Total current liabilities
Tesco
2018 2019
44735 – 19233 = 25502 48949 – 20680 = 28269
Paraphrase This Document
Need a fresh take? Get an instant paraphrase of this document with our AI Paraphraser

Sainsbury
2018 2019
22001 – 10302 = 11699 23514 – 11417 = 12097
Interpretation:
Ratio analysis can help to demonstrates the liquidity-state, financial stability, efficiency
of Tesco and Sainsbury corporations for understanding their financial status. The aforementioned
table shows ratios for year 2018 and year-2019 for the year that will help hep to identify
companies' financial position for said period. In this regard following is comprehensive and
thorough evaluation of different ratios, as follows:
Current ratio:
Tesco
Sainsbury
00.20.40.60.8 0.71 0.76
0.61 0.66
Current ratio
2018 2019
2018 2019
22001 – 10302 = 11699 23514 – 11417 = 12097
Interpretation:
Ratio analysis can help to demonstrates the liquidity-state, financial stability, efficiency
of Tesco and Sainsbury corporations for understanding their financial status. The aforementioned
table shows ratios for year 2018 and year-2019 for the year that will help hep to identify
companies' financial position for said period. In this regard following is comprehensive and
thorough evaluation of different ratios, as follows:
Current ratio:
Tesco
Sainsbury
00.20.40.60.8 0.71 0.76
0.61 0.66
Current ratio
2018 2019

The current ratios of Tesco corporation are around 0.71 and 0.61, accordingly, throughout
the 2018 and 2019, reflecting an improved performance during the two years, whereas current
ratios of Sainsbury reaches 0.76 and 0.64, across the said periods. Both businesses showed an
uptick in the ratio, although Sainsbury's efficiency, with greater current proportions in respect of
shorter liquidity status, is quite excellent comparable to Tesco corporation (Blanco-Oliver, A.
and Irimia-Diéguez, 2019).
Quick Ratio:
Quick ratios correspond to too much liquid assets and it displays the association among quick
assets and corporation's current obligations. Quick assets are those that will turn easily to
currency, since it displays just cash-funds and bank accounts that deduct inventories and prepaid
expenditures from overall shorter term current-assets (Filip, 2020). The greater the number tells
companies liquidity and sound financial stability for paying their short-term debts. The Quick
Ratio stated by Tesco corporation are .57 and.48, accordingly, throughout 2018 and year-2019,
whereas the that of Sainsbury for that period are around 0.59 and 0.50. Which is progressive
trend in company quick ratios, which demonstrates a progress in cash liquidity position/status of
both enterprises. Relatively speaking, Sainsbury's quick ratios are much better than that of Tesco
corporation.
Tesco
Sainsbury
00.40.8 0.59 0.59
0.48 0.5
Quick Ratio
2018 2019
⊘ This is a preview!⊘
Do you want full access?
Subscribe today to unlock all pages.

Trusted by 1+ million students worldwide

Gross profit ratio:
The gross profit/margin ratio reveals how efficient corporation is in generating profit by
company's core operations. This illustrates the relationship among revenues and gross margins.
The gross profitability margins reported by Tesco corporation are around 5.82 percent in
period 2018 and 6.48 per-cent in 2019, meanwhile the Sainsbury GP rates are 6.61 percent and
6.92 percent in 2018 and 2019. Research reveals that corporation Sainsbury, with a greater gross
margin percentage, is more potent than Sainsbury, through raising revenues from its main
business tasks (Jayanti, 2019).
Net Profit/margin ratio:
The sustainability(in terms of profit level) of all businesses can be efficiently assessed by net-
profit ratios and company's gross-margin percentages. Net profit percentage indicates the link
Tesco
Sainsbury
55.566.577.5
5.83
6.616.48
6.92
Gross profit margin
2018 2019
Tesco
Sainsbury
0123
2.1
1.09
2.07
0.75
Net profit margin
2018 2019
Paraphrase This Document
Need a fresh take? Get an instant paraphrase of this document with our AI Paraphraser

among the corporation's earnings/sales and net-income. Net profit is sum represent profit remain
after reduction of all expenditures, depreciation sum and income tax (Sibaroni, Ekaputra and
Prasetiyowati, 2020). Sainsbury corporation's net profit proportions are around 1.09 per cent and
around 0.75 per cent in period-2018 and 2019, exhibits a gradual rise, although the net profit
proportions are 2.10 percent and 2.07 per-cent in period2018 and 2019. Both corporations have
enhanced net profit-generating efficiency, but Tesco corporation has achieved greater profit
margins opposed to Sainsbury, which means that the profitability performance is much stronger
than Sainsbury corporation.
P/E ratio:
Tesco
Sainsbury
0
40
80
120
38.22
106.39
41.56
123.6
Price earnings ratio
2018 2019

Price earnings (PE) ratio suggests what investors are able to pay for company's securities/shares.
Increasing earnings imply that stock prices being overvalued and lower earnings suggest that
the share prices are lesser compared to earnings-per share. Upon this basis of the data from
Tesco-plc and Sainsbury corporation, the firm's eagerness to attain more profits relate to its share
prices. Tesco's PE ranges are approx. 38.22 as well as 41.56, accordingly, throughout 2018 as
well as in 2019, indicating a reducing pattern, although Sainsbury's PE proportions are
around 106.39 and 123.9 in respectively 2018 and 2019 demonstrating a declining trend in the
PE level. This reveals that Sainsbury corporation is relatively more effective in supplying its
owners with a gain per each equity they buy and also a greater fair value with Sainsbury's stock.
Capital gearing ratio:
Gearing ratio presents an insight over capital structure of corporation, which is measured by
dividing aggregate equity-funds of the owners by longer-term debts. The Gearing Ratio
demonstrates the corporation 's actual liquidity proportion. The corporation's gearing ratio
reaches 2.31 in year-2019 and 3.28 in 2018, although Sainsbury corporation's gearing rates are
around 1.97 and 1.78 percent (2018 and period-2019), respectively. Corporation Tesco has a
larger ratio than of Sainsbury corporation, which means that the debt/loans burden is
significantly high. As a factor, Sainsbury corporation's liquidity status-performance is healthier
than of Tesco corporation (Minnis and Sutherland, 2017).
Return on capital employed ratio:
Tesco
Sainsbury
01234 3.28
1.97
2.31 1.78
Gearing ratio
2018 2019
⊘ This is a preview!⊘
Do you want full access?
Subscribe today to unlock all pages.

Trusted by 1+ million students worldwide

It relates to the percentage of profits that the corporation earns from its capital-funds. The greater
the yield on the enterprise 's capital-funds employed, the greater the effectiveness of its capital-
engaged and the greater the performance of the enterprise. ROCE stated by Tesco Plc are around
6.14 and 9.34, whilst also that of Sainsbury are approx. 4.43 and 4.97 over 2018-2019. In the
context of both firms, ROCE is diminishing. Tesco reported higher ROCE ratios is more
effective to deliver yields on its total capital-funds (Röth, Spieth and Lange, 2019).
Inventory turnover ratios:
Tesco
Sainsbury
012345678910
6.14
4.43
9.34
4.97
Return on capital employed
2018 2019
Tesco
Sainsbury
0102030 23.73
14.83
24.5
14.44
Average inventories turnover ratio
2018 2019
Paraphrase This Document
Need a fresh take? Get an instant paraphrase of this document with our AI Paraphraser

Stock turnover proportion/ratio represent how frequently the corporation has transformed
its stock into sales/revenues over a specified span of time. Which tells the performance-status of
companies how well they handle their stock-items. Ratio of Tesco corporation is approx. 23.73
(2018) and 24.50 (2019) while of corporation Sainsbury are 14.83 (2018) as well as 14.44
(2019). This indicates that corporation Sainsbury having lower ratio is better(faster) than Tesco-
corporation to turn its stocks/inventories into turnover. Although ratio of corporation Tesco-plc
have been diminished in 2019, it highlights that the capacity of the organisation in transforming
its inventories/stocks to revenue/turnover has been significantly enhanced.
Dividend pay-out ratio:
Tesco
Sainsbury
04080120
6.78
76.05
27.05
112.79
Dividend payout ratio
2018 2019

It indicates the cumulative number of dividends-amount paid by the particular organizations to
its shareholders/securities holder in respect to the corporation's net profits. It highlights the
relation between the sum paid by the corporation to its equity-holders and keeping pace with
expansion, reinvestment, debt repayment, liquid assets, etc (Gan and Xia, 2019). This measure
measures the extent of profit-sum paid to stockholders. Sainsbury's Div.-payouts are 76.05
(2018) and 112.79 (2019), whereas Tesco's Div.-payouts are 6.78 (2018) and 27.05 (2019).
Which suggests that Sainsbury corporation is more appealing to the consumer as a corporation
paying larger amounts of dividend payments to its stakeholders as contrasted to Tesco.
Earnings per share ratio:
This ratio-figure demonstrates how much profits enterprise make in each of their shares-
issued. The relatively higher ratio presents higher price-value of the inventory and the buyers
would paying higher for the corporation 'shares because the corporation has more earnings in
regard to share-price. EPS stated by Tesco is 6.14 (2019) and 4.96 (2018), whereas Sainsbury
corporation's EPS is 4.75 (2018) as well as 4.97 (2019). There seems to be a decremental
tendency in EPS proportions of both enterprises. EPS is superior than those
of corporation Sainsbury, this indicates that corporation Sainsbury is far more potent in
providing incomes to shareholders.
Both corporation's aggregate-overall performance review reveals that
Sainsbury organization's short-term liquidity-status and cash liquidity outlook is healthier than
Tesco plc. Although the total profitability ranking of Tesco corporation is much effective than
Tesco
Sainsbury
01234567
4.96 4.75
6.14
4.06
Earnings per share
2018 2019
⊘ This is a preview!⊘
Do you want full access?
Subscribe today to unlock all pages.

Trusted by 1+ million students worldwide
1 out of 19
Related Documents

Your All-in-One AI-Powered Toolkit for Academic Success.
 +13062052269
info@desklib.com
Available 24*7 on WhatsApp / Email
Unlock your academic potential
Copyright © 2020–2025 A2Z Services. All Rights Reserved. Developed and managed by ZUCOL.