Managerial Finance Report: Comparative Analysis of Tesco and Sainsbury
VerifiedAdded on 2022/12/30
|16
|3852
|27
Report
AI Summary
This report offers a comprehensive financial analysis of two major retail companies, Tesco and Sainsbury. It begins with an introduction to managerial finance, outlining its importance in planning, organizing, and controlling financial activities. The report then delves into a detailed ratio analysis of both companies for the years 2018 and 2019, covering key financial ratios such as current ratio, liquidity ratio, gross profit margin, price-earning ratio, net profit margin, earnings per share, dividend payout ratio, inventory turnover ratio, capital gearing ratio, and return on capital employed. Each ratio is explained, calculated, and interpreted, with comparisons made between the two companies to assess their relative financial performance and identify strengths and weaknesses. The analysis includes graphical representations of key ratios. The report concludes with recommendations based on the findings and discusses the limitations of ratio analysis. Furthermore, it explores investment appraisal techniques and their limitations, providing a well-rounded view of the financial health and strategic considerations for both companies.

MANAGERIAL
FINANCE
FINANCE
Paraphrase This Document
Need a fresh take? Get an instant paraphrase of this document with our AI Paraphraser
Table of Contents
INTRODUCTION...........................................................................................................................1
PORTFOLIO 1.................................................................................................................................1
Ratio analysis of both company for the year 2018 and 2019 ......................................................1
Recommendation.........................................................................................................................9
Limitation of the ratio analysis ...................................................................................................9
PORTFOLIO 2...............................................................................................................................10
Investment appraisal techniques ...............................................................................................10
Limitations of investment appraisal techniques:........................................................................12
CONCLUSION .............................................................................................................................13
REFERENCES .............................................................................................................................14
INTRODUCTION
Managerial finance means the method use for the collecting the funds and managing
them according to the day to day activities which is used in other department for carry the
regular activities in the finance activity. It is about planning, organising, analysing, monitoring
and controlling the financial techniques for the better utilization of the resources. In simple terms
there is the use of the manager for manage the activities of the entity to accomplishment of the
business objectives and goal. In this report there is two company is selected which are Tesco and
Sinsburry. Tesco is the largest British Multinational retail based company which is found in
1919, their headquarter is located in UK. And second one is Sainsbury which has largest number
of the market chain in the retail sector (Atanasova, Gatev and Shapiro, 2016). It was founded in
1922, in which headquarter is located in London. In this report there are various topics are
covered such as ratio analysis of both company and limitation of the ratio analysis. Apart from
these limitations of the investment appraisal techniques for the given project.
PORTFOLIO 1
Ratio analysis of both company for the year 2018 and 2019
In context to Sainsbury
Basic Formulas Results for 2018 Results for 2019
Current ratio
Current assets / current
liabilities
7857/10302
=0.73:1
7550 /11849
=0.63:1
Liquid / quick ratio
Quick assets / current
liabilities
1933/10302
=0.19
1283 /11849
=0.19
Gross profit Ratio Gross profit / total sales
518/28456
=0.018%
601 /29007
=0.02%
P/E ratio
Market value per share /
Earnings per share
238.80/0.22
=10.85
213.40/46
=4.64
Net profit Ratio Net profit / total sales
309/28456
=0.11%
186/29007
=0.006%
Earnings per share Income available / total 22 46
1
⊘ This is a preview!⊘
Do you want full access?
Subscribe today to unlock all pages.
Trusted by 1+ million students worldwide
number of shares outstanding
Dividend pay-out ratio Dividend paid / net income
235/309
=0.76
247/186
=1.33
Capital gearing ratio Total debt / total equity 34.44 97.75
Average inventory
turnover period Net sales / average inventory
28456/1792.5
=15.87 days
29007/1869.5
=15.51 days
Return on capital
employed
Operating profit/ capital
employed 4.65 3.84
In Context to Tesco
Basics Formulas Results for 2018
Results for
2019
Current ratio
Current assets / current
liabilities
13,726 / 19,238
= 0.713
12668 / 20680
= 0.612
Liquid / quick ratio
Quick assets / current
liabilities
4379 / 19238
= 0.227
3373 / 20680
= 0.163
Gross profit Ratio Gross profit / total sales
(3350 /
57491)*100
= 5.82%
(4144/63911)*
100
= 6.48%
P/E ratio
Market value per share/
Earnings per share
229 / 9.35
=24.49
213.6/13.65
= 16.97
Net profit Ratio Net profit/ total sales
(1206 /
57491)*100
=2.097%
(1322/63911)*
100
= 2.07%
Earnings per share
Income available / total
number of shares
outstanding 9.35 13.65
Dividend pay-out ratio Dividend paid / net income 82/1206 357/1322
2
Paraphrase This Document
Need a fresh take? Get an instant paraphrase of this document with our AI Paraphraser
= 0.68 = 0.27
Average inventory
turnover period
Net sales / average
inventory
57491/2282.5
= 25.91 days
63911/2240.5
= 28.52 days
Capital gearing ratio Total debt / total equity
44862/10480
= 4.280%
49047 / 14858
= 3.301%
Return on capital
employed
Operating profit/ capital
employed 5.13 6.86
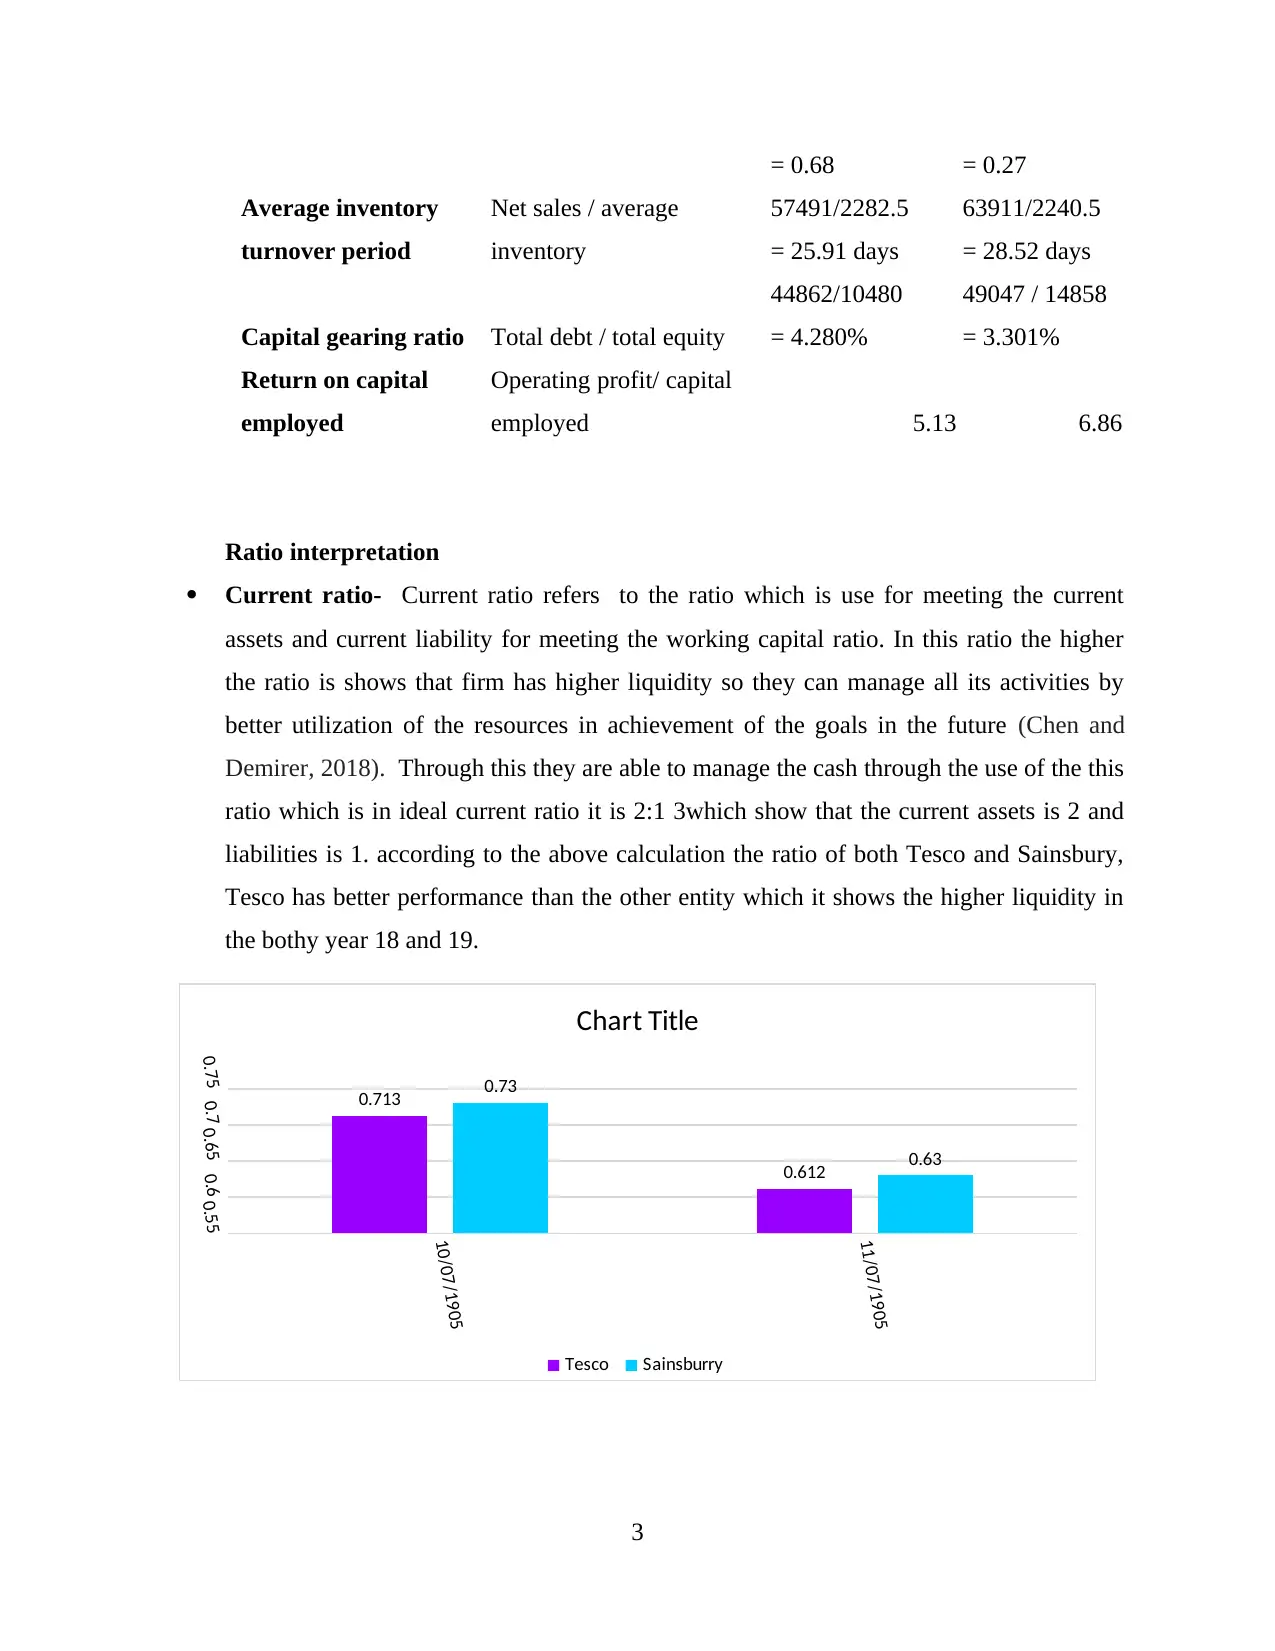
Ratio interpretation
Current ratio- Current ratio refers to the ratio which is use for meeting the current
assets and current liability for meeting the working capital ratio. In this ratio the higher
the ratio is shows that firm has higher liquidity so they can manage all its activities by
better utilization of the resources in achievement of the goals in the future (Chen and
Demirer, 2018). Through this they are able to manage the cash through the use of the this
ratio which is in ideal current ratio it is 2:1 3which show that the current assets is 2 and
liabilities is 1. according to the above calculation the ratio of both Tesco and Sainsbury,
Tesco has better performance than the other entity which it shows the higher liquidity in
the bothy year 18 and 19.
3
10/07/1905
11/07/1905
0.550.60.650.70.75 0.713
0.612
0.73
0.63
Chart Title
Tesco Sainsburry
Average inventory
turnover period
Net sales / average
inventory
57491/2282.5
= 25.91 days
63911/2240.5
= 28.52 days
Capital gearing ratio Total debt / total equity
44862/10480
= 4.280%
49047 / 14858
= 3.301%
Return on capital
employed
Operating profit/ capital
employed 5.13 6.86
Ratio interpretation
Current ratio- Current ratio refers to the ratio which is use for meeting the current
assets and current liability for meeting the working capital ratio. In this ratio the higher
the ratio is shows that firm has higher liquidity so they can manage all its activities by
better utilization of the resources in achievement of the goals in the future (Chen and
Demirer, 2018). Through this they are able to manage the cash through the use of the this
ratio which is in ideal current ratio it is 2:1 3which show that the current assets is 2 and
liabilities is 1. according to the above calculation the ratio of both Tesco and Sainsbury,
Tesco has better performance than the other entity which it shows the higher liquidity in
the bothy year 18 and 19.
3
10/07/1905
11/07/1905
0.550.60.650.70.75 0.713
0.612
0.73
0.63
Chart Title
Tesco Sainsburry
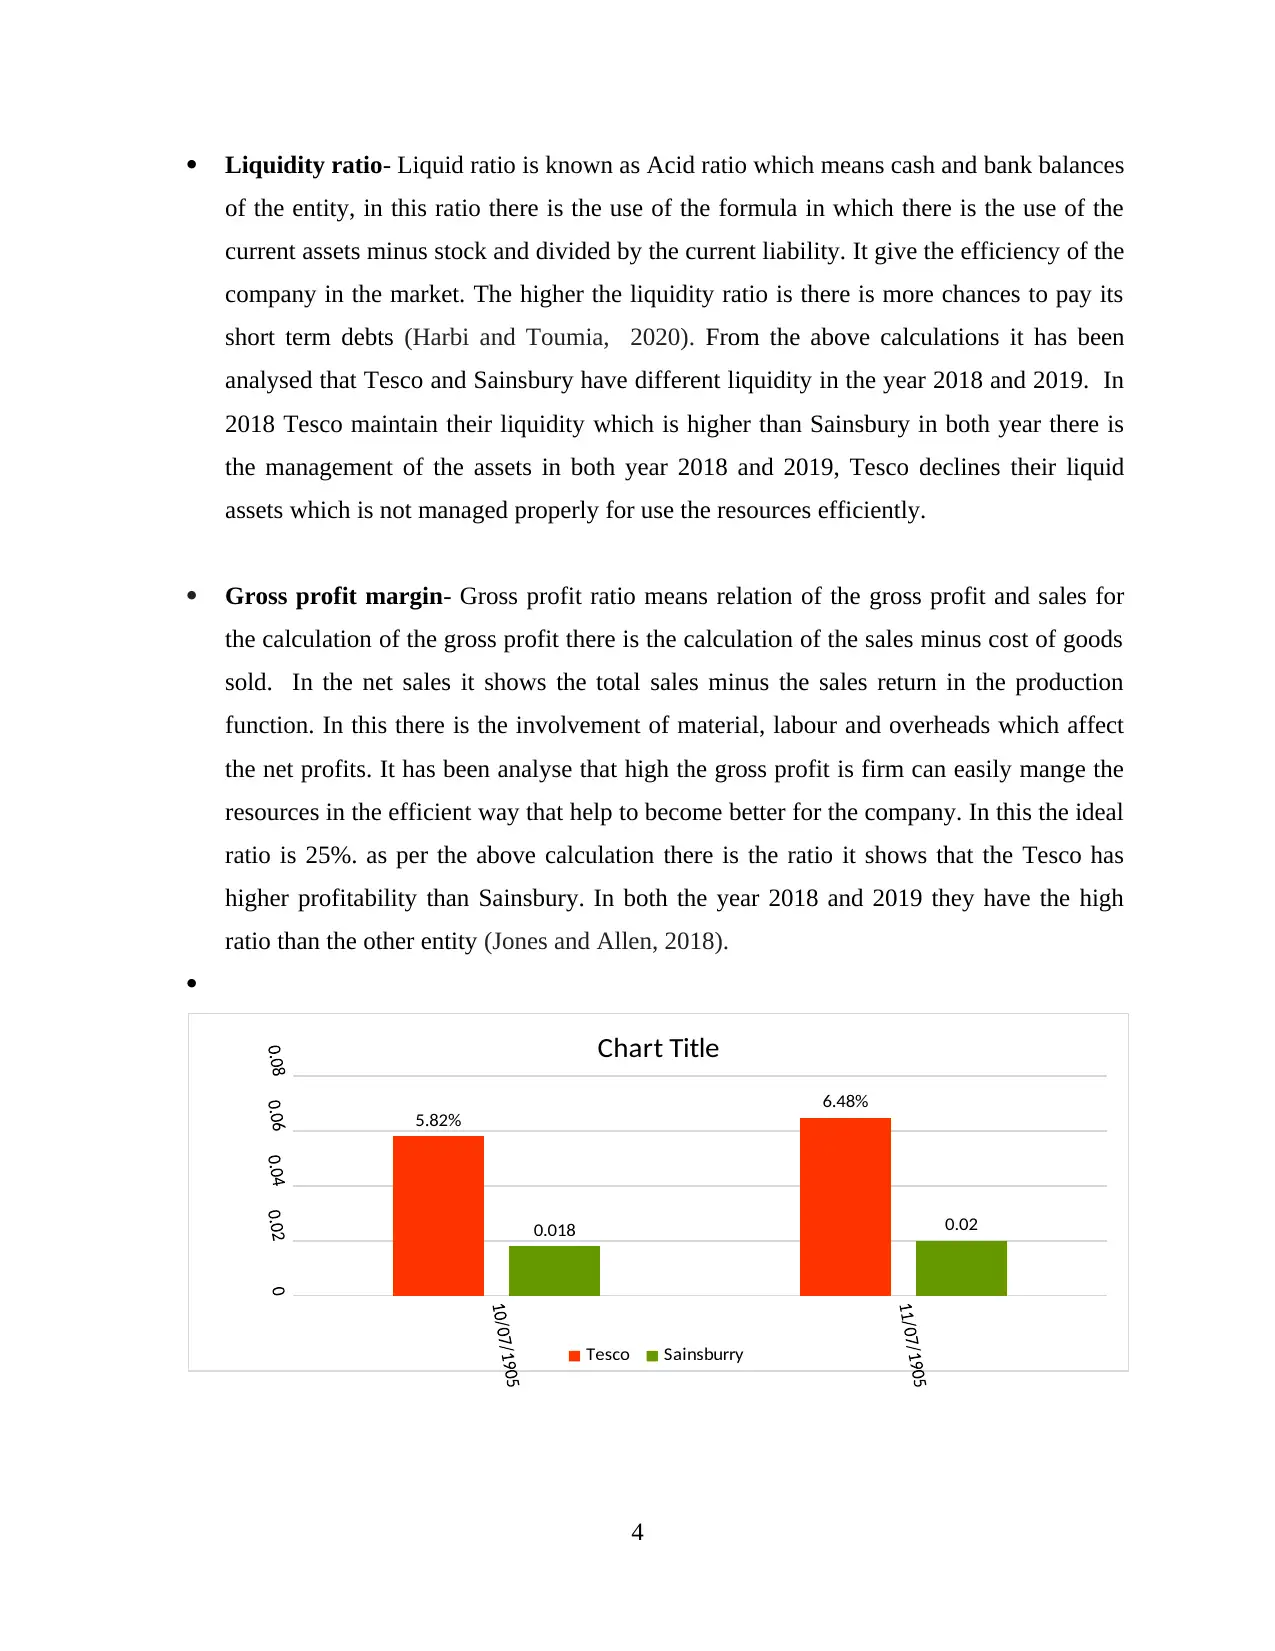
Liquidity ratio- Liquid ratio is known as Acid ratio which means cash and bank balances
of the entity, in this ratio there is the use of the formula in which there is the use of the
current assets minus stock and divided by the current liability. It give the efficiency of the
company in the market. The higher the liquidity ratio is there is more chances to pay its
short term debts (Harbi and Toumia, 2020). From the above calculations it has been
analysed that Tesco and Sainsbury have different liquidity in the year 2018 and 2019. In
2018 Tesco maintain their liquidity which is higher than Sainsbury in both year there is
the management of the assets in both year 2018 and 2019, Tesco declines their liquid
assets which is not managed properly for use the resources efficiently.
Gross profit margin- Gross profit ratio means relation of the gross profit and sales for
the calculation of the gross profit there is the calculation of the sales minus cost of goods
sold. In the net sales it shows the total sales minus the sales return in the production
function. In this there is the involvement of material, labour and overheads which affect
the net profits. It has been analyse that high the gross profit is firm can easily mange the
resources in the efficient way that help to become better for the company. In this the ideal
ratio is 25%. as per the above calculation there is the ratio it shows that the Tesco has
higher profitability than Sainsbury. In both the year 2018 and 2019 they have the high
ratio than the other entity (Jones and Allen, 2018).
5.82%
6.48%
0.018 0.02
Chart Title
Tesco Sainsburry
4
⊘ This is a preview!⊘
Do you want full access?
Subscribe today to unlock all pages.
Trusted by 1+ million students worldwide
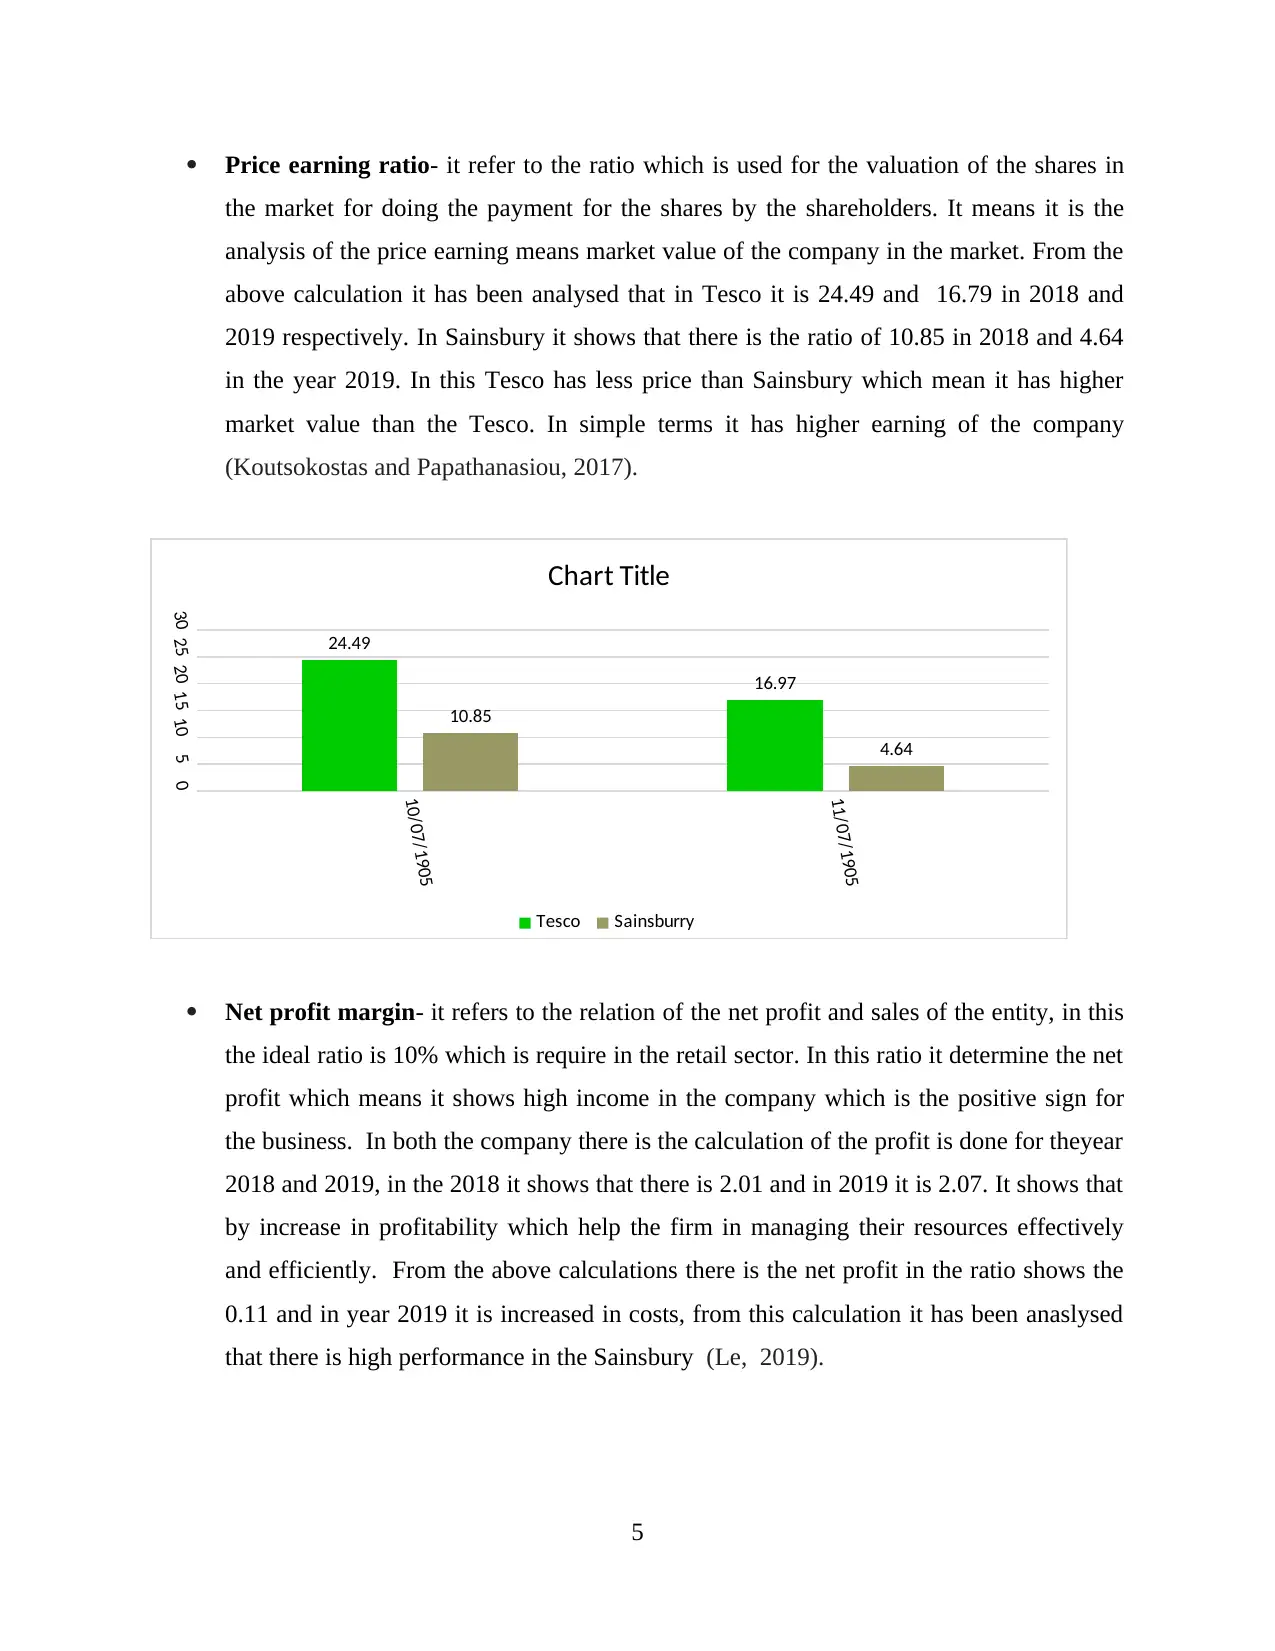
Price earning ratio- it refer to the ratio which is used for the valuation of the shares in
the market for doing the payment for the shares by the shareholders. It means it is the
analysis of the price earning means market value of the company in the market. From the
above calculation it has been analysed that in Tesco it is 24.49 and 16.79 in 2018 and
2019 respectively. In Sainsbury it shows that there is the ratio of 10.85 in 2018 and 4.64
in the year 2019. In this Tesco has less price than Sainsbury which mean it has higher
market value than the Tesco. In simple terms it has higher earning of the company
(Koutsokostas and Papathanasiou, 2017).
10/07/1905
11/07/1905
051015202530 24.49
16.97
10.85
4.64
Chart Title
Tesco Sainsburry
Net profit margin- it refers to the relation of the net profit and sales of the entity, in this
the ideal ratio is 10% which is require in the retail sector. In this ratio it determine the net
profit which means it shows high income in the company which is the positive sign for
the business. In both the company there is the calculation of the profit is done for theyear
2018 and 2019, in the 2018 it shows that there is 2.01 and in 2019 it is 2.07. It shows that
by increase in profitability which help the firm in managing their resources effectively
and efficiently. From the above calculations there is the net profit in the ratio shows the
0.11 and in year 2019 it is increased in costs, from this calculation it has been anaslysed
that there is high performance in the Sainsbury (Le, 2019).
5
Paraphrase This Document
Need a fresh take? Get an instant paraphrase of this document with our AI Paraphraser
10/07/1905
11/07/1905
00.511.522.5 2.097 2.07
0.11 0.006
Chart Title
Tesco Sainsburry
Earning per share ratio- It refer to the ratio which is used by the firm for each of its
share. It refers to the amount earns by the company on each shares. In this there is the
higher ratio means higher value for display the image of the entity. It helps the firm for
getting high investments from the investors which help in increase the firms value. This
ratio analyses that high ratio means better financial position among the both company. In
Context to Tesco and Sainsbury, it shows that Sainsbury has highest performance than
the Tesco, Tesco has higher value in the market (Lee and Park, 2018).
10/07/1905
11/07/1905
01020304050
9.35 13.65
22
46
Chart Title
Tesco Sainsburry
Dividend payout ratio- Dividend pay out ratio means efficiency of the firm in paying to
the shareholder, it describe the way in which company is able to pay dividend to the
shareholders. Higher the dividend higher the profitability of the company. It shows the
profitability of the company. From the above ratio it has been analysis that in 2018 and
6
11/07/1905
00.511.522.5 2.097 2.07
0.11 0.006
Chart Title
Tesco Sainsburry
Earning per share ratio- It refer to the ratio which is used by the firm for each of its
share. It refers to the amount earns by the company on each shares. In this there is the
higher ratio means higher value for display the image of the entity. It helps the firm for
getting high investments from the investors which help in increase the firms value. This
ratio analyses that high ratio means better financial position among the both company. In
Context to Tesco and Sainsbury, it shows that Sainsbury has highest performance than
the Tesco, Tesco has higher value in the market (Lee and Park, 2018).
10/07/1905
11/07/1905
01020304050
9.35 13.65
22
46
Chart Title
Tesco Sainsburry
Dividend payout ratio- Dividend pay out ratio means efficiency of the firm in paying to
the shareholder, it describe the way in which company is able to pay dividend to the
shareholders. Higher the dividend higher the profitability of the company. It shows the
profitability of the company. From the above ratio it has been analysis that in 2018 and
6
2019 it shows that in 1.33% in 2018 and in 2019 it is 0.79%. it shows that the
Sainsburry pay higher dividend then the Tesco which show the profit ratio.
10/07/1905
11/07/1905
00.511.5
0.68
0.27
0.76
1.33
Chart Title
Tesco Sainsburry
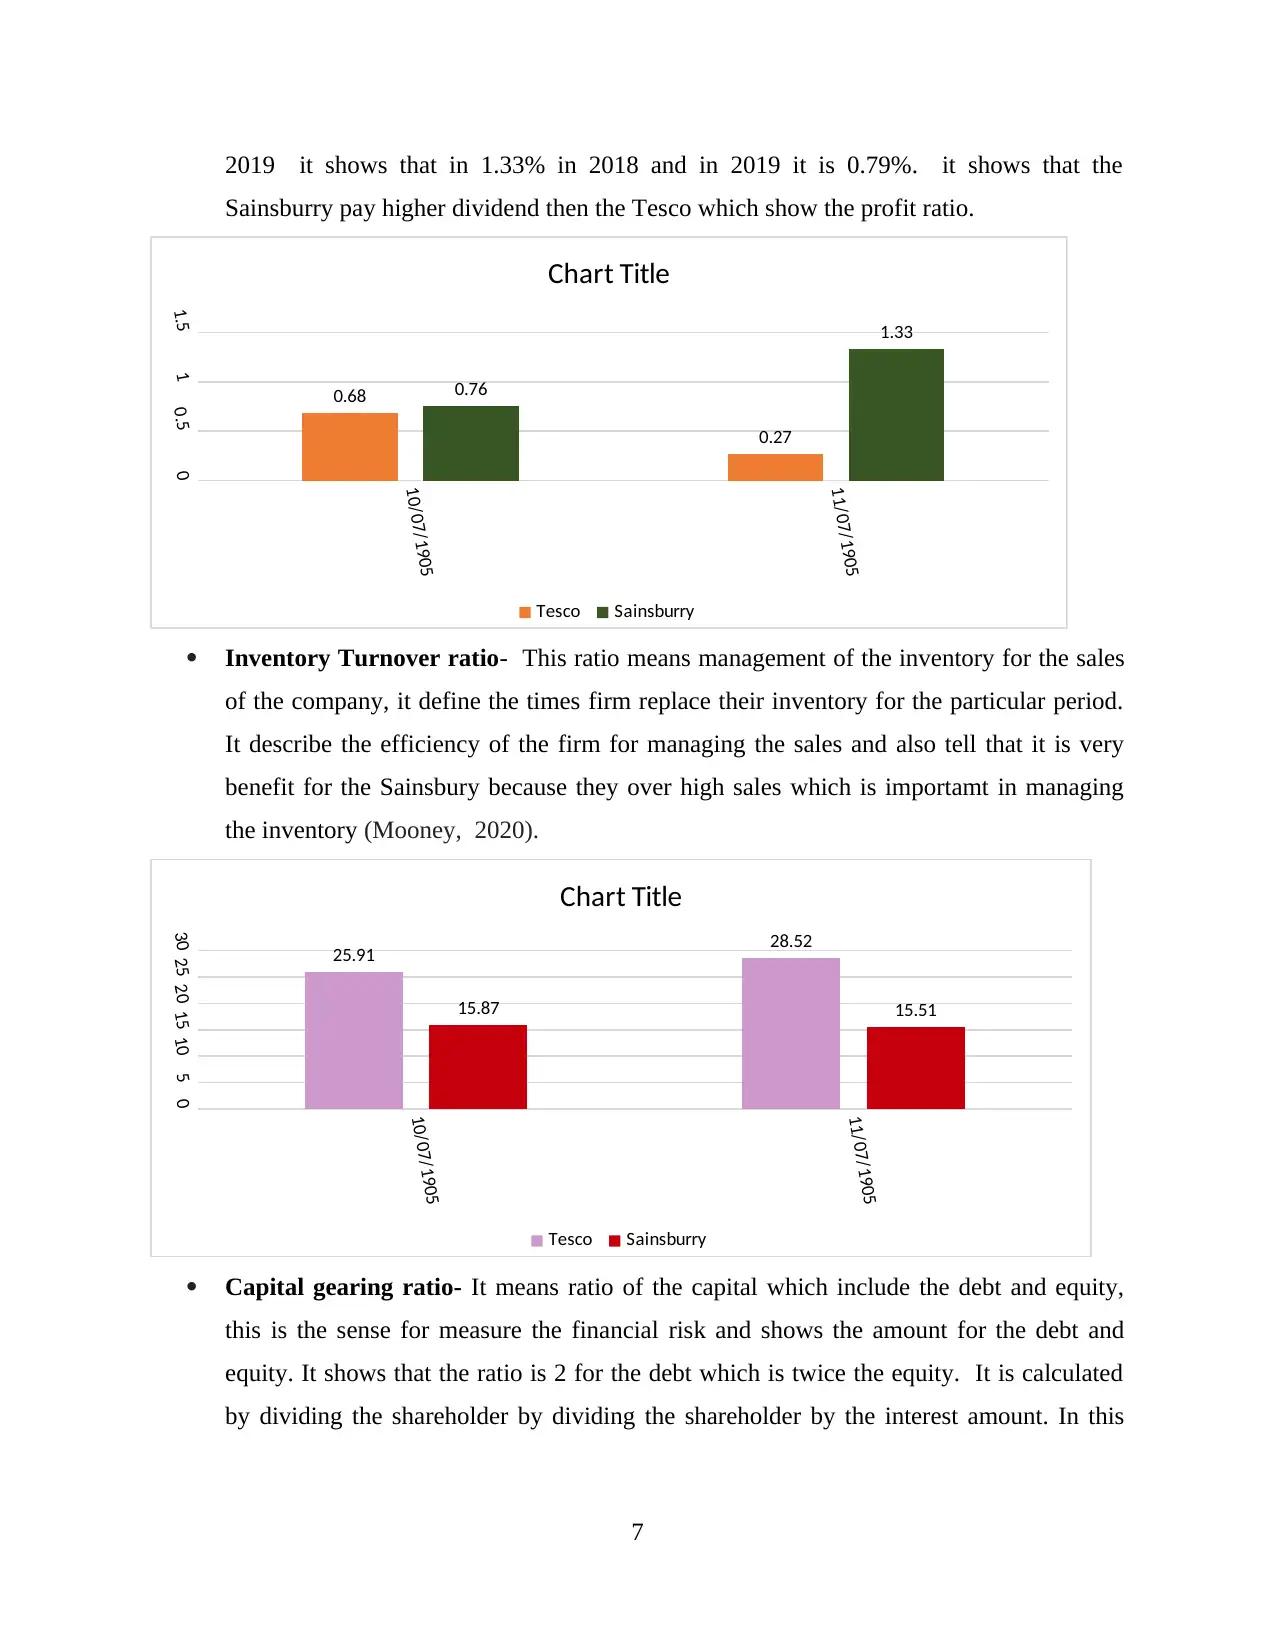
Inventory Turnover ratio- This ratio means management of the inventory for the sales
of the company, it define the times firm replace their inventory for the particular period.
It describe the efficiency of the firm for managing the sales and also tell that it is very
benefit for the Sainsbury because they over high sales which is importamt in managing
the inventory (Mooney, 2020).
10/07/1905
11/07/1905
051015202530 25.91 28.52
15.87 15.51
Chart Title
Tesco Sainsburry
Capital gearing ratio- It means ratio of the capital which include the debt and equity,
this is the sense for measure the financial risk and shows the amount for the debt and
equity. It shows that the ratio is 2 for the debt which is twice the equity. It is calculated
by dividing the shareholder by dividing the shareholder by the interest amount. In this
7
Sainsburry pay higher dividend then the Tesco which show the profit ratio.
10/07/1905
11/07/1905
00.511.5
0.68
0.27
0.76
1.33
Chart Title
Tesco Sainsburry
Inventory Turnover ratio- This ratio means management of the inventory for the sales
of the company, it define the times firm replace their inventory for the particular period.
It describe the efficiency of the firm for managing the sales and also tell that it is very
benefit for the Sainsbury because they over high sales which is importamt in managing
the inventory (Mooney, 2020).
10/07/1905
11/07/1905
051015202530 25.91 28.52
15.87 15.51
Chart Title
Tesco Sainsburry
Capital gearing ratio- It means ratio of the capital which include the debt and equity,
this is the sense for measure the financial risk and shows the amount for the debt and
equity. It shows that the ratio is 2 for the debt which is twice the equity. It is calculated
by dividing the shareholder by dividing the shareholder by the interest amount. In this
7
⊘ This is a preview!⊘
Do you want full access?
Subscribe today to unlock all pages.
Trusted by 1+ million students worldwide
ideal ratio is 25% and 50% as per the data of Tesco and Sainsbury, in 2018 it shows the
there is less risky in Sainsbury which is doubled in year 2019 (Panda and Kumar, 2020).
10/07...
11/07...
0100
4.28 3.301
34.44
97.75
Chart Title
Tesco Sainsburry
Return on capital employed- In this ratio it means the company earns for the capital, in
this company utilizes its resources for getting high return in the market. Higher the ratio
means better use of the resources. From the above calculation it has been interpreted that
in Sainsbury and Tesco, they has higher return than the other company. In Tesco it has
5.13 and 6.86 in 2018 and 2019. in Sainsbury it has 4.65 in 2018 and 3.84 in 2019.
10/07/1905
11/07/1905
012345678
5.13
6.86
4.65 3.84
Chart Title
Tesco Sainsburry
Recommendation
From the above calculation it has been recommended that analyst has high liquidity and
profits of the Tesco is higher than the Sainsbury because they utilize the resources in the
proper way. From the utilization of the resources leads to higher profit position of the
company (Riff and Yagil, 2020).
8
Paraphrase This Document
Need a fresh take? Get an instant paraphrase of this document with our AI Paraphraser
Tesco use the resources in the efficient manner because it has the less liquidity in paying
out the short term debts.
Tesco has to maintain the profits and sales because it is the reason of the lower value for
the expansion of the business for maintain their sales and getting investment from the
investor.
For the regular activities they have to maintain the cash and bank balances for paying the
debts to the outsider party.
They also manage the gross profit because due to increase the gross profit there is
increase in the net profit also.
In this it is very important to manage the resources effectively and efficiently for giving
the cost advantage which lead to higher profit of the company (Sakouvogui, 2020).
Limitation of the ratio analysis
This analysis is done for the analysis of the ratio which is based on the historical data in
this current data is not used for determine the position in the company.
In the ratio analysis there is the element is considered which is human element which
provide the negative result in the organization and they faces many problems.
In the organization there are various external factors which effect the entity because they
are provide the accurate information.
In the comparison of the ratio analysis of different company there is the same size, same
firm and same data which have different value for both for both the entity for making the
comparison (Sherrill and Upton, 2018).
There is the requirement of the information which is need by the business in research and
development for doing the ratio analysis which give major impact on the business
organization.
In the company there is the requirement of the past records because it is needed by the
company.
In the financial reports it has different incorporates in the situation of the inflation, in this
there is the value of the real prices is not given in financial reports. They have to control
the value according to the inflation conditions.
9
In ratio analysis they change their operational factor for making changes in the supply
chain for making the strategy during the selling times. It also effect the effective
decisions which is use by the company for managing the management.
In the seasonal factors there are some implications of the ratio analysis it effect the
performance of the business by interpret the financial ability of the ratio in accordance
with the wrong interpretation.
In the ratio analysis there is the understand of the financial information for making
financial statements, which result is comparison of actual result with the expected reason
for removing the conflicts of the finance information.
By making changes in the price level due to the inflation there is use of the historical data
which is based on the historical costs. Price level changes is also use for comparison of
the financial situation of the enterprise (Ashour, Rennie and Santamaria, 2019).
By the unavailability of the ratio analysis there is the use of the formulas which is utilized
by the company for the calculation of current ratio which consider all current liabilities
minus overdraft of bank.
One limitation is use of the application of ratio analysis for incorporating different
strategies for making in appropriate evolution.
According to accounting policies it has been noted that there is the recording of the same
transactions for the accounting which is not provide the appropriate results.
Business can not able to make alterations in the year end of its financial statements which
help in increasing the analysis of the ratio which lead to Window Dressing.
PORTFOLIO 2
Investment appraisal techniques
For the project A:
Net Profit Value Discount factor Present value
45,000..... 0.862..... 38,790.....
45,000.... 0.743..... 33,435.....
45,000..... 0.641.... 28,845.....
35,000..... 0.552..... 19,320.....
10
⊘ This is a preview!⊘
Do you want full access?
Subscribe today to unlock all pages.
Trusted by 1+ million students worldwide
1 out of 16
Related Documents


Your All-in-One AI-Powered Toolkit for Academic Success.
+13062052269
info@desklib.com
Available 24*7 on WhatsApp / Email
![[object Object]](/_next/static/media/star-bottom.7253800d.svg)
Unlock your academic potential
Copyright © 2020–2026 A2Z Services. All Rights Reserved. Developed and managed by ZUCOL.