Financial Performance Analysis: Tesco vs. Sainsbury (2018-2019)
VerifiedAdded on 2022/12/30
|18
|3676
|5
Report
AI Summary
This report presents a detailed financial analysis of Tesco Plc and Sainsbury Plc, two major retail companies in the UK, for the years 2018 and 2019. It utilizes various financial ratios, including current ratio, quick ratio, gross profit margin, P/E ratio, and gearing ratios, to assess and compare their financial performance, liquidity, and profitability. The analysis interprets the ratios, providing insights into each company's strengths and weaknesses, and offers recommendations for improvement. Furthermore, the report explores investment appraisal techniques and discusses the limitations of ratio analysis and investment appraisal methods. The study aims to provide a comprehensive understanding of managerial finance concepts and their application in real-world business scenarios, offering valuable insights for financial decision-making and performance evaluation.
Managerial Finance
Paraphrase This Document
Need a fresh take? Get an instant paraphrase of this document with our AI Paraphraser
Table of Contents
INTRODUCTION...........................................................................................................................1
PORTFOLIO 1.................................................................................................................................1
Ratio analysis for Tesco and Sainsburry for the year 2018 and 2019:........................................1
Interpretation:...............................................................................................................................3
Recommendation:......................................................................................................................10
Limitations of ratio analysis:.....................................................................................................10
PORTFOLIO 2...............................................................................................................................11
Investment appraisal techniques for the project A and project B:.............................................11
Limitations for investment appraisal techniques:......................................................................12
CONCLUSION..............................................................................................................................14
REFERENCES................................................................................................................................1

⊘ This is a preview!⊘
Do you want full access?
Subscribe today to unlock all pages.
Trusted by 1+ million students worldwide
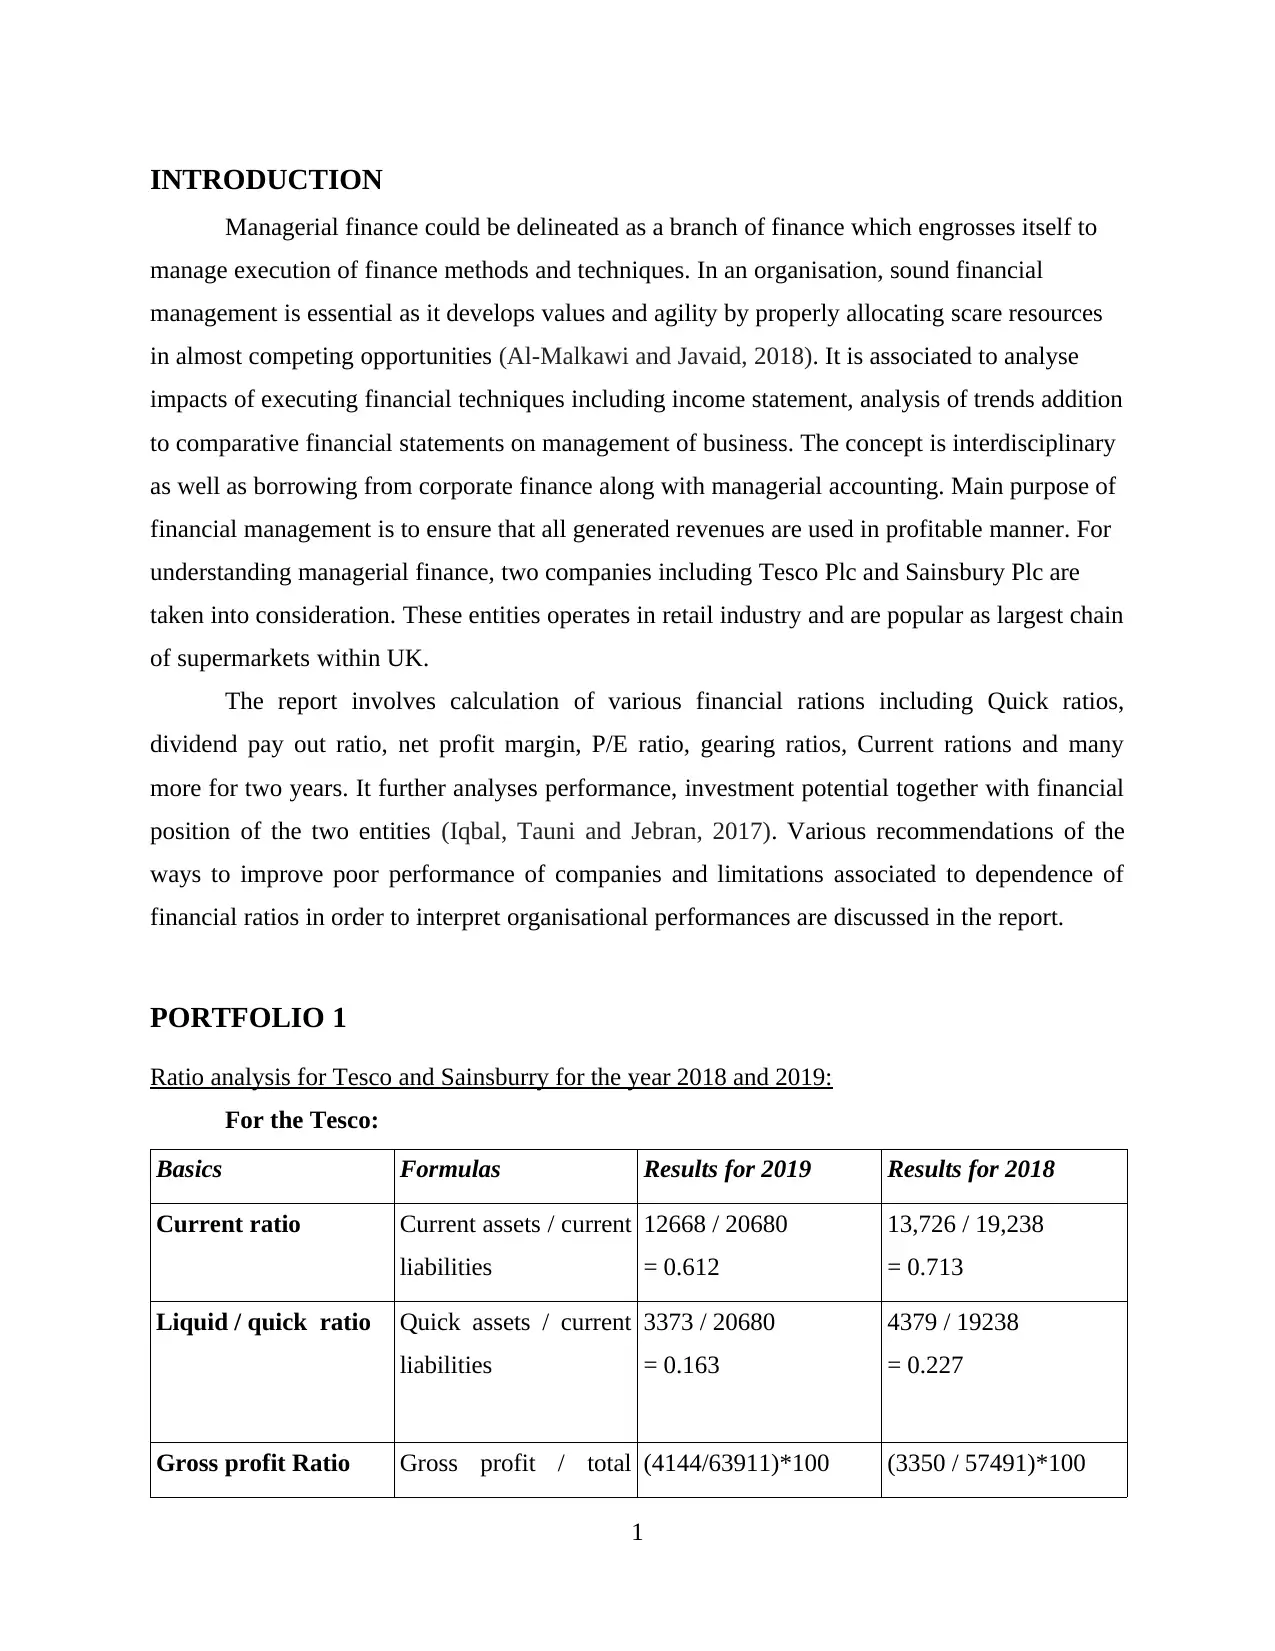
INTRODUCTION
Managerial finance could be delineated as a branch of finance which engrosses itself to
manage execution of finance methods and techniques. In an organisation, sound financial
management is essential as it develops values and agility by properly allocating scare resources
in almost competing opportunities (Al-Malkawi and Javaid, 2018). It is associated to analyse
impacts of executing financial techniques including income statement, analysis of trends addition
to comparative financial statements on management of business. The concept is interdisciplinary
as well as borrowing from corporate finance along with managerial accounting. Main purpose of
financial management is to ensure that all generated revenues are used in profitable manner. For
understanding managerial finance, two companies including Tesco Plc and Sainsbury Plc are
taken into consideration. These entities operates in retail industry and are popular as largest chain
of supermarkets within UK.
The report involves calculation of various financial rations including Quick ratios,
dividend pay out ratio, net profit margin, P/E ratio, gearing ratios, Current rations and many
more for two years. It further analyses performance, investment potential together with financial
position of the two entities (Iqbal, Tauni and Jebran, 2017). Various recommendations of the
ways to improve poor performance of companies and limitations associated to dependence of
financial ratios in order to interpret organisational performances are discussed in the report.
PORTFOLIO 1
Ratio analysis for Tesco and Sainsburry for the year 2018 and 2019:
For the Tesco:
Basics Formulas Results for 2019 Results for 2018
Current ratio Current assets / current
liabilities
12668 / 20680
= 0.612
13,726 / 19,238
= 0.713
Liquid / quick ratio Quick assets / current
liabilities
3373 / 20680
= 0.163
4379 / 19238
= 0.227
Gross profit Ratio Gross profit / total (4144/63911)*100 (3350 / 57491)*100
1
Paraphrase This Document
Need a fresh take? Get an instant paraphrase of this document with our AI Paraphraser
sales = 6.48% = 5.82%
P/E ratio Market value per
share/ Earnings per
share
213.6/13.65
= 16.97
229 / 9.35
=24.49
Net profit Ratio Net profit/ total sales (1322/63911)*100
= 2.07%
(1206 / 57491)*100
=2.097%
Earnings per share Income available /
total number of shares
outstanding
13.65 9.35
Dividend pay-out
ratio
Dividend paid / net
income
357/1322
= 0.27
82/1206
= 0.68
Average inventory
turnover period
Net sales / average
inventory
63911/2240.5
= 28.52 days
57491/2282.5
= 25.91 days
Capital gearing ratio Total debt / total
equity
49047 / 14858
= 3.301%
44862/10480
= 4.280%
Return on capital
employed
Operating profit/
capital employed
6.86 5.13
For the Sainsburry:
Basic Formulas Results for 2019 Results for 2018
Current ratio Current assets / current
liabilities
7550 /11849
=0.63:1
7857/10302
=0.73:1
Liquid / quick ratio Quick assets / current
liabilities
1283 /11849
=0.19
1933/10302
=0.19
Gross profit Ratio Gross profit / total
sales
601 /29007
=0.02%
518/28456
=0.018%
P/E ratio Market value per share 213.40/46 238.80/0.22
2
/ Earnings per share =4.64
=10.85
Net profit Ratio Net profit / total sales 186/29007
=0.006%
309/28456
=0.11%
Earnings per share Income available /
total number of shares
outstanding
46 22
Dividend pay-out
ratio
Dividend paid / net
income
247/186
=1.33
235/309
=0.76
Capital gearing ratio Total debt / total
equity
97.75 34.44
Average inventory
turnover period
Net sales / average
inventory
29007/1869.5
=15.51 days
28456/1792.5
=15.87 days
Return on capital
employed
Operating profit/
capital employed
3.84 4.65
Interpretation:
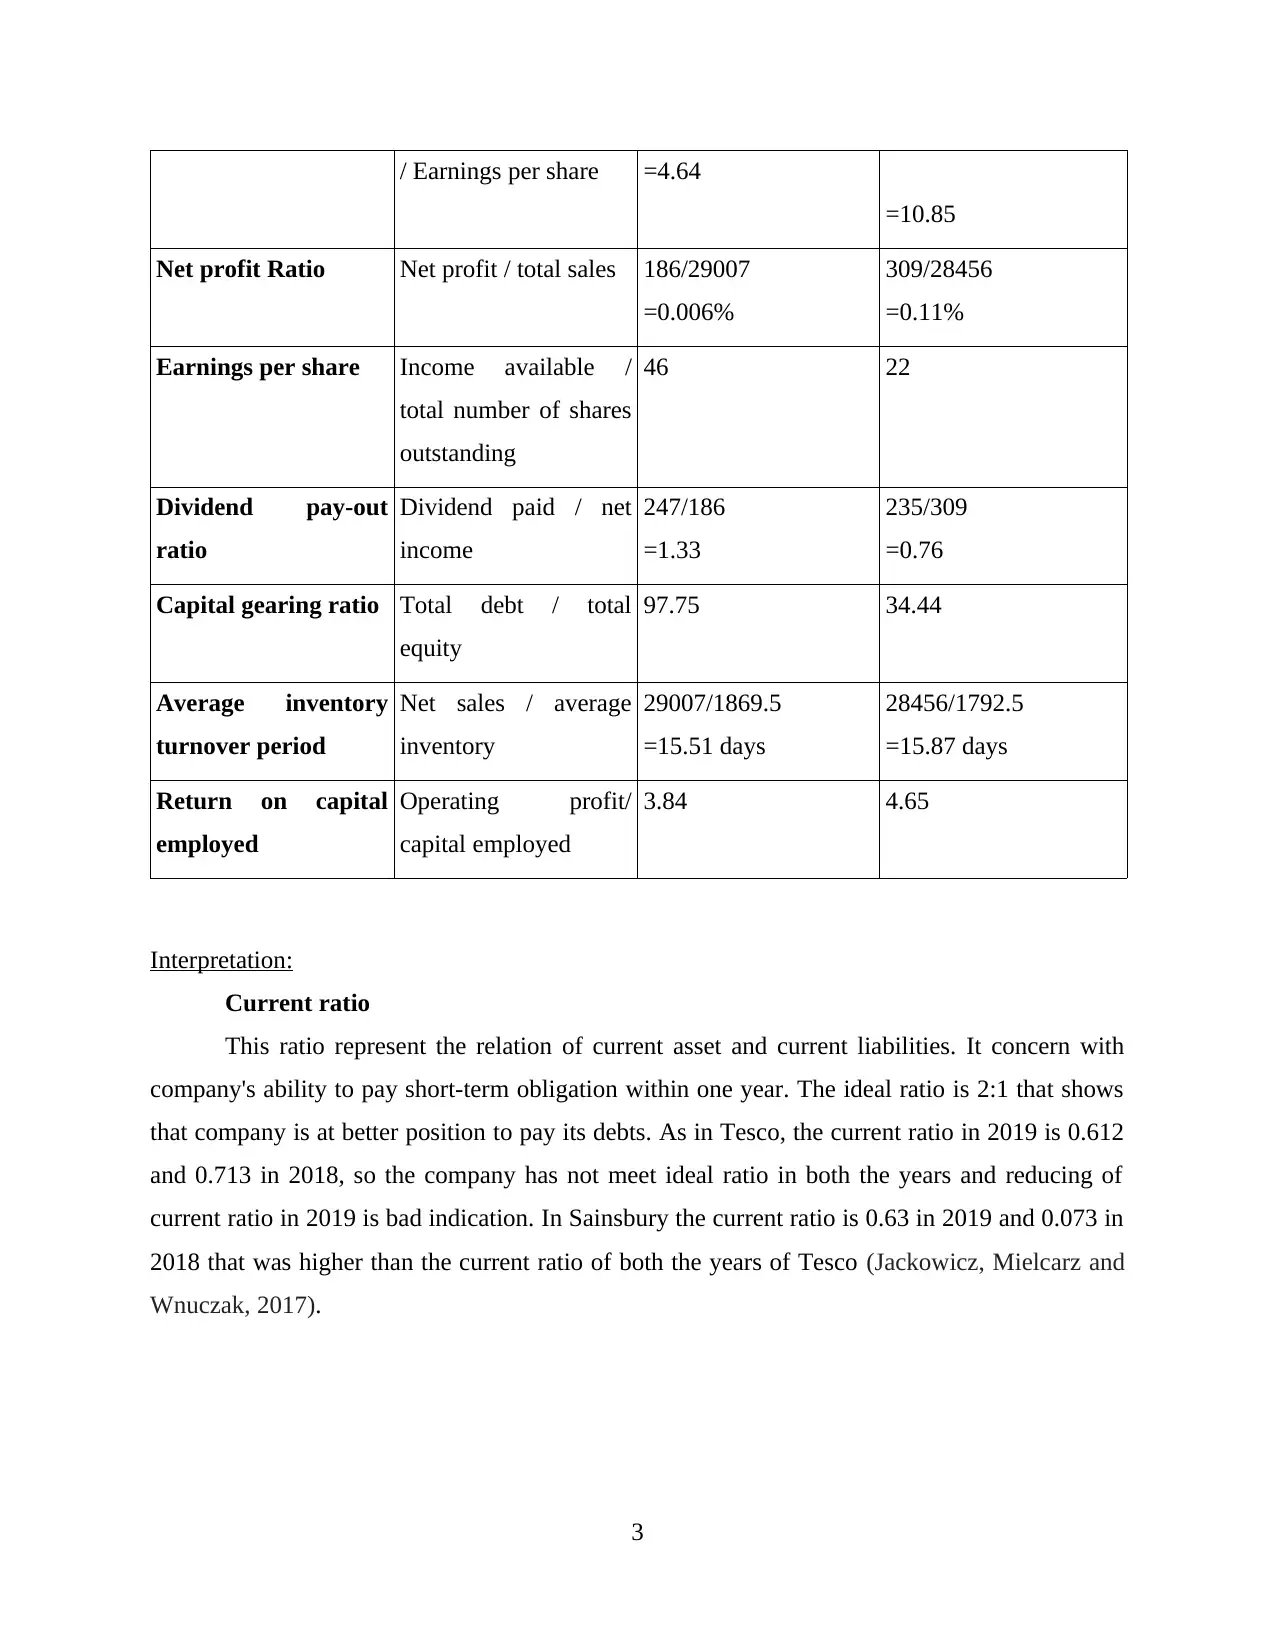
Current ratio
This ratio represent the relation of current asset and current liabilities. It concern with
company's ability to pay short-term obligation within one year. The ideal ratio is 2:1 that shows
that company is at better position to pay its debts. As in Tesco, the current ratio in 2019 is 0.612
and 0.713 in 2018, so the company has not meet ideal ratio in both the years and reducing of
current ratio in 2019 is bad indication. In Sainsbury the current ratio is 0.63 in 2019 and 0.073 in
2018 that was higher than the current ratio of both the years of Tesco (Jackowicz, Mielcarz and
Wnuczak, 2017).
3
=10.85
Net profit Ratio Net profit / total sales 186/29007
=0.006%
309/28456
=0.11%
Earnings per share Income available /
total number of shares
outstanding
46 22
Dividend pay-out
ratio
Dividend paid / net
income
247/186
=1.33
235/309
=0.76
Capital gearing ratio Total debt / total
equity
97.75 34.44
Average inventory
turnover period
Net sales / average
inventory
29007/1869.5
=15.51 days
28456/1792.5
=15.87 days
Return on capital
employed
Operating profit/
capital employed
3.84 4.65
Interpretation:
Current ratio
This ratio represent the relation of current asset and current liabilities. It concern with
company's ability to pay short-term obligation within one year. The ideal ratio is 2:1 that shows
that company is at better position to pay its debts. As in Tesco, the current ratio in 2019 is 0.612
and 0.713 in 2018, so the company has not meet ideal ratio in both the years and reducing of
current ratio in 2019 is bad indication. In Sainsbury the current ratio is 0.63 in 2019 and 0.073 in
2018 that was higher than the current ratio of both the years of Tesco (Jackowicz, Mielcarz and
Wnuczak, 2017).
3
⊘ This is a preview!⊘
Do you want full access?
Subscribe today to unlock all pages.
Trusted by 1+ million students worldwide
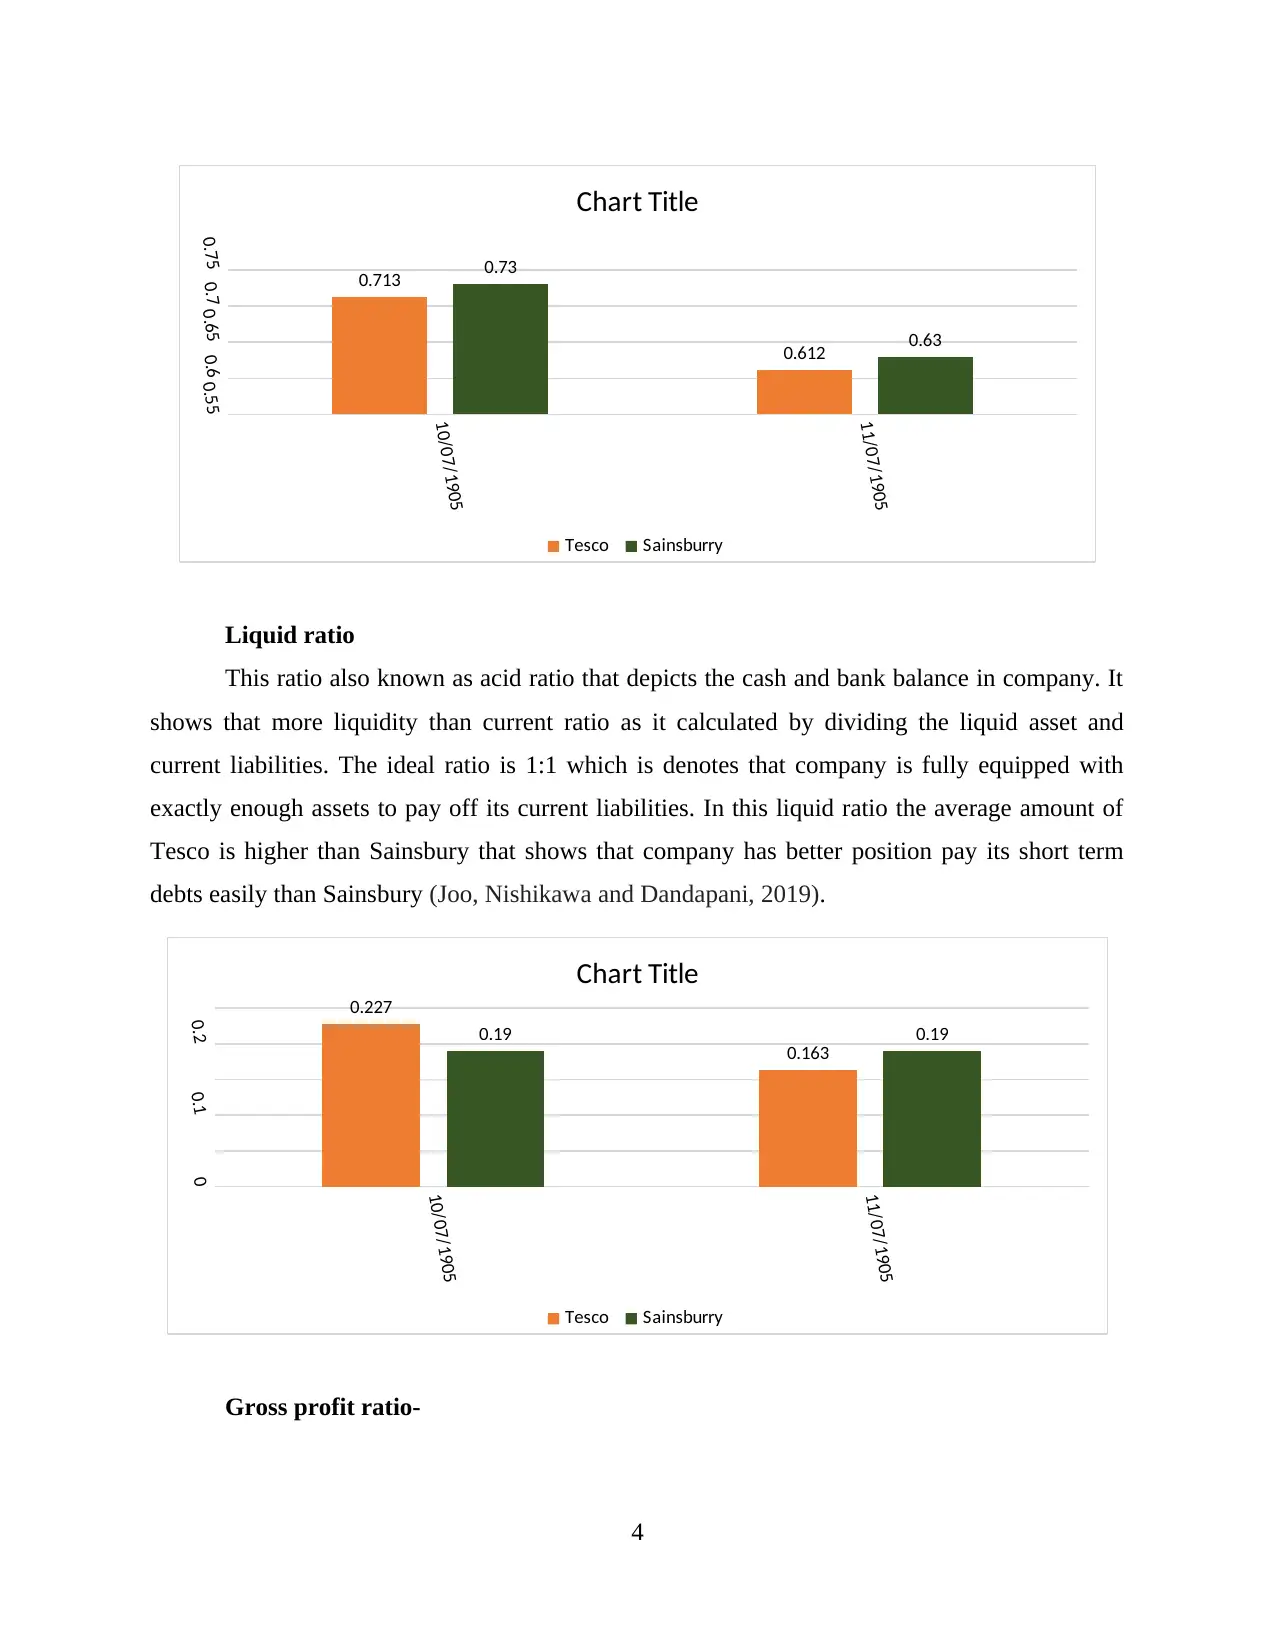
Liquid ratio
This ratio also known as acid ratio that depicts the cash and bank balance in company. It
shows that more liquidity than current ratio as it calculated by dividing the liquid asset and
current liabilities. The ideal ratio is 1:1 which is denotes that company is fully equipped with
exactly enough assets to pay off its current liabilities. In this liquid ratio the average amount of
Tesco is higher than Sainsbury that shows that company has better position pay its short term
debts easily than Sainsbury (Joo, Nishikawa and Dandapani, 2019).
Gross profit ratio-
4
10/07/1905
11/07/1905
0.550.60.650.70.75 0.713
0.612
0.73
0.63
Chart Title
Tesco Sainsburry
10/07/1905
11/07/1905
0
0.1
0.2
0.227
0.163
0.19 0.19
Chart Title
Tesco Sainsburry
Paraphrase This Document
Need a fresh take? Get an instant paraphrase of this document with our AI Paraphraser
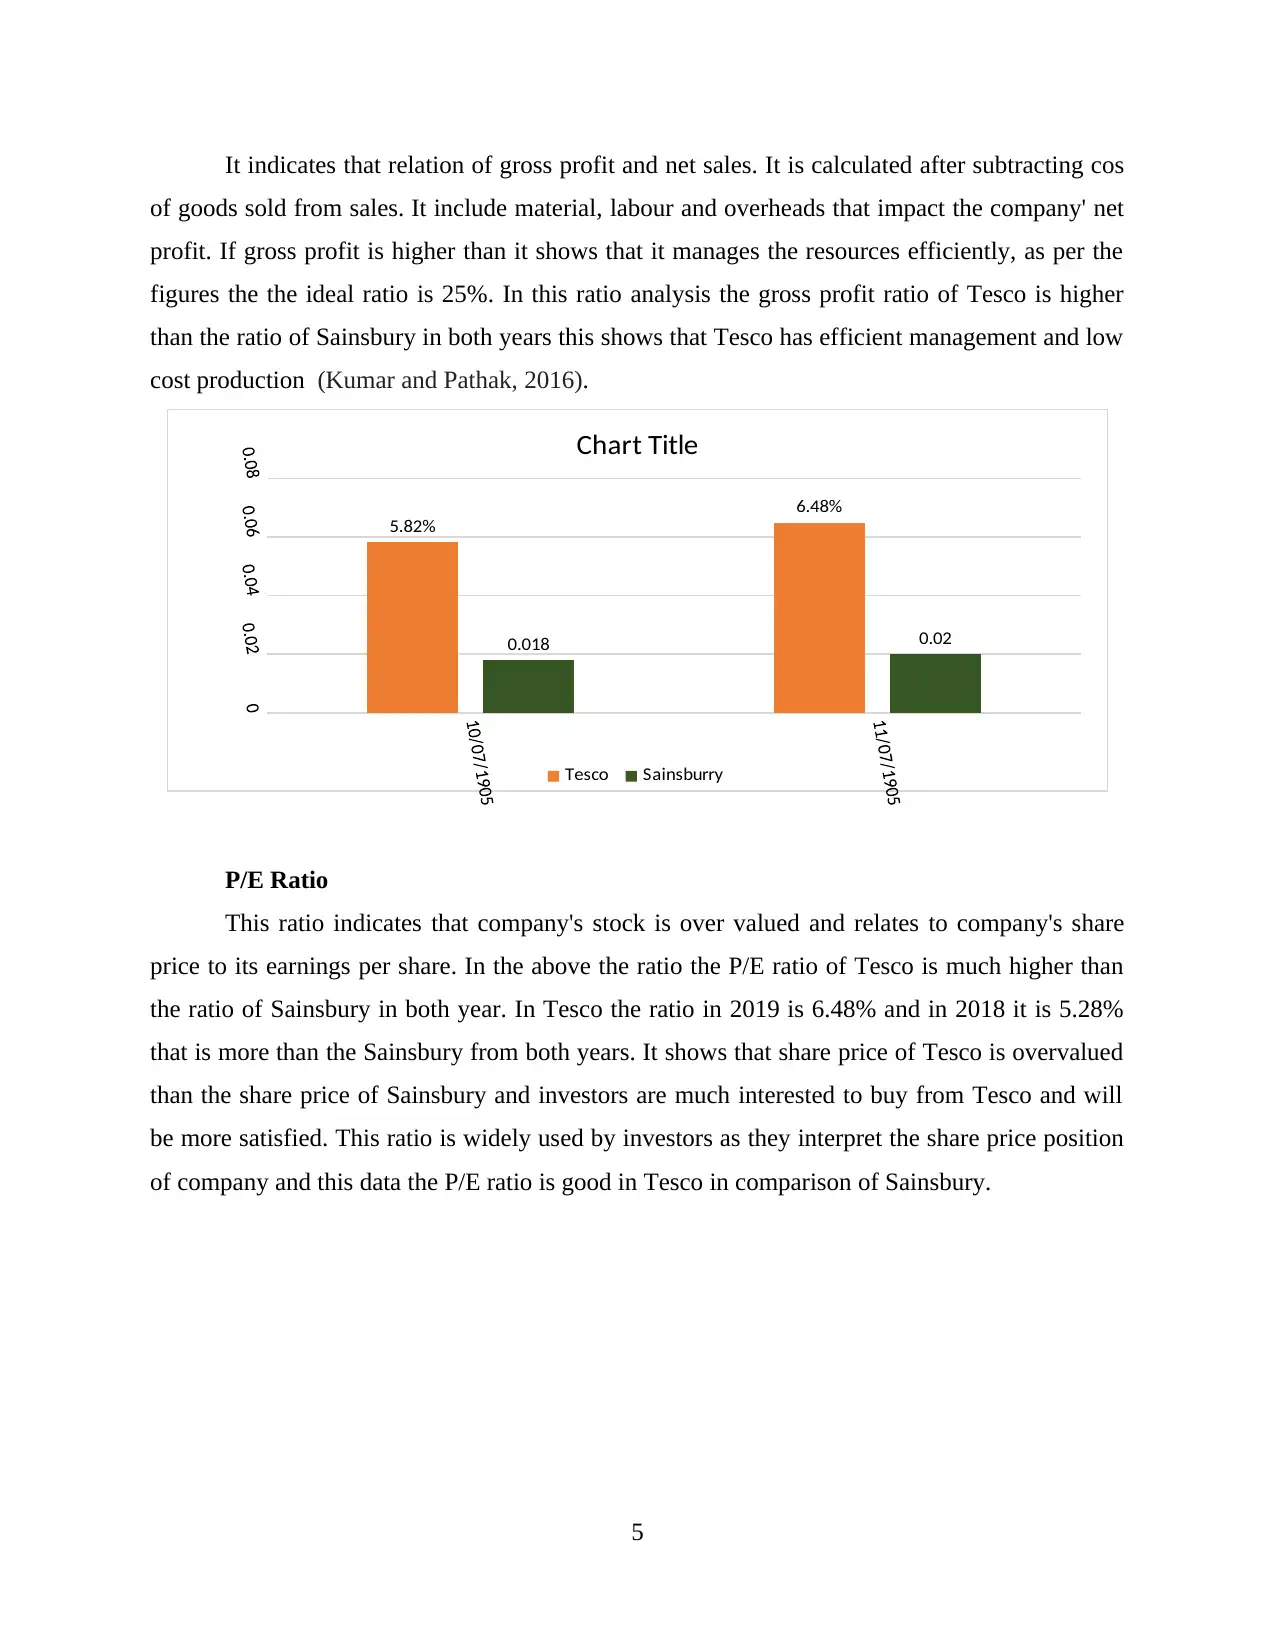
It indicates that relation of gross profit and net sales. It is calculated after subtracting cos
of goods sold from sales. It include material, labour and overheads that impact the company' net
profit. If gross profit is higher than it shows that it manages the resources efficiently, as per the
figures the the ideal ratio is 25%. In this ratio analysis the gross profit ratio of Tesco is higher
than the ratio of Sainsbury in both years this shows that Tesco has efficient management and low
cost production (Kumar and Pathak, 2016).
P/E Ratio
This ratio indicates that company's stock is over valued and relates to company's share
price to its earnings per share. In the above the ratio the P/E ratio of Tesco is much higher than
the ratio of Sainsbury in both year. In Tesco the ratio in 2019 is 6.48% and in 2018 it is 5.28%
that is more than the Sainsbury from both years. It shows that share price of Tesco is overvalued
than the share price of Sainsbury and investors are much interested to buy from Tesco and will
be more satisfied. This ratio is widely used by investors as they interpret the share price position
of company and this data the P/E ratio is good in Tesco in comparison of Sainsbury.
5
5.82%
6.48%
0.018 0.02
Chart Title
Tesco Sainsburry
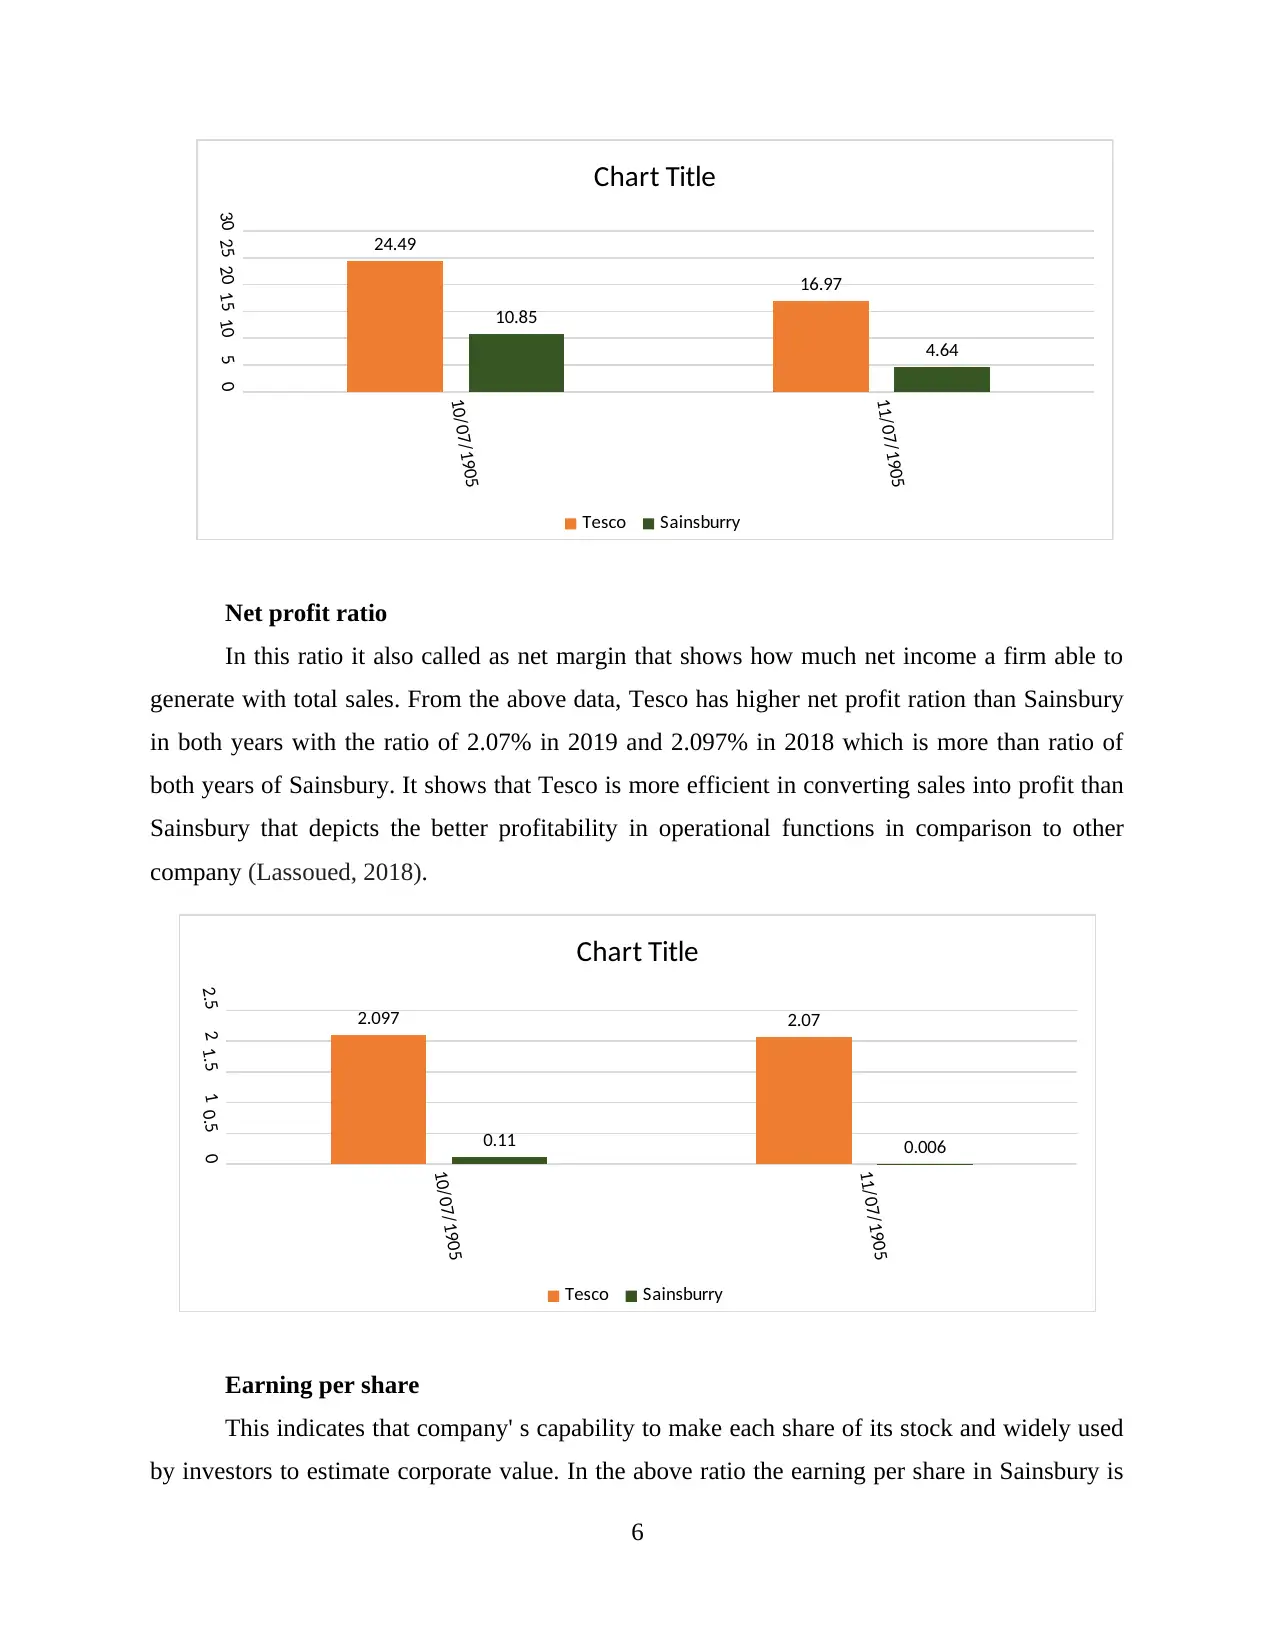
Net profit ratio
In this ratio it also called as net margin that shows how much net income a firm able to
generate with total sales. From the above data, Tesco has higher net profit ration than Sainsbury
in both years with the ratio of 2.07% in 2019 and 2.097% in 2018 which is more than ratio of
both years of Sainsbury. It shows that Tesco is more efficient in converting sales into profit than
Sainsbury that depicts the better profitability in operational functions in comparison to other
company (Lassoued, 2018).
Earning per share
This indicates that company' s capability to make each share of its stock and widely used
by investors to estimate corporate value. In the above ratio the earning per share in Sainsbury is
6
10/07/1905
11/07/1905
051015202530 24.49
16.97
10.85
4.64
Chart Title
Tesco Sainsburry
10/07/1905
11/07/1905
00.511.522.5 2.097 2.07
0.11 0.006
Chart Title
Tesco Sainsburry
⊘ This is a preview!⊘
Do you want full access?
Subscribe today to unlock all pages.
Trusted by 1+ million students worldwide
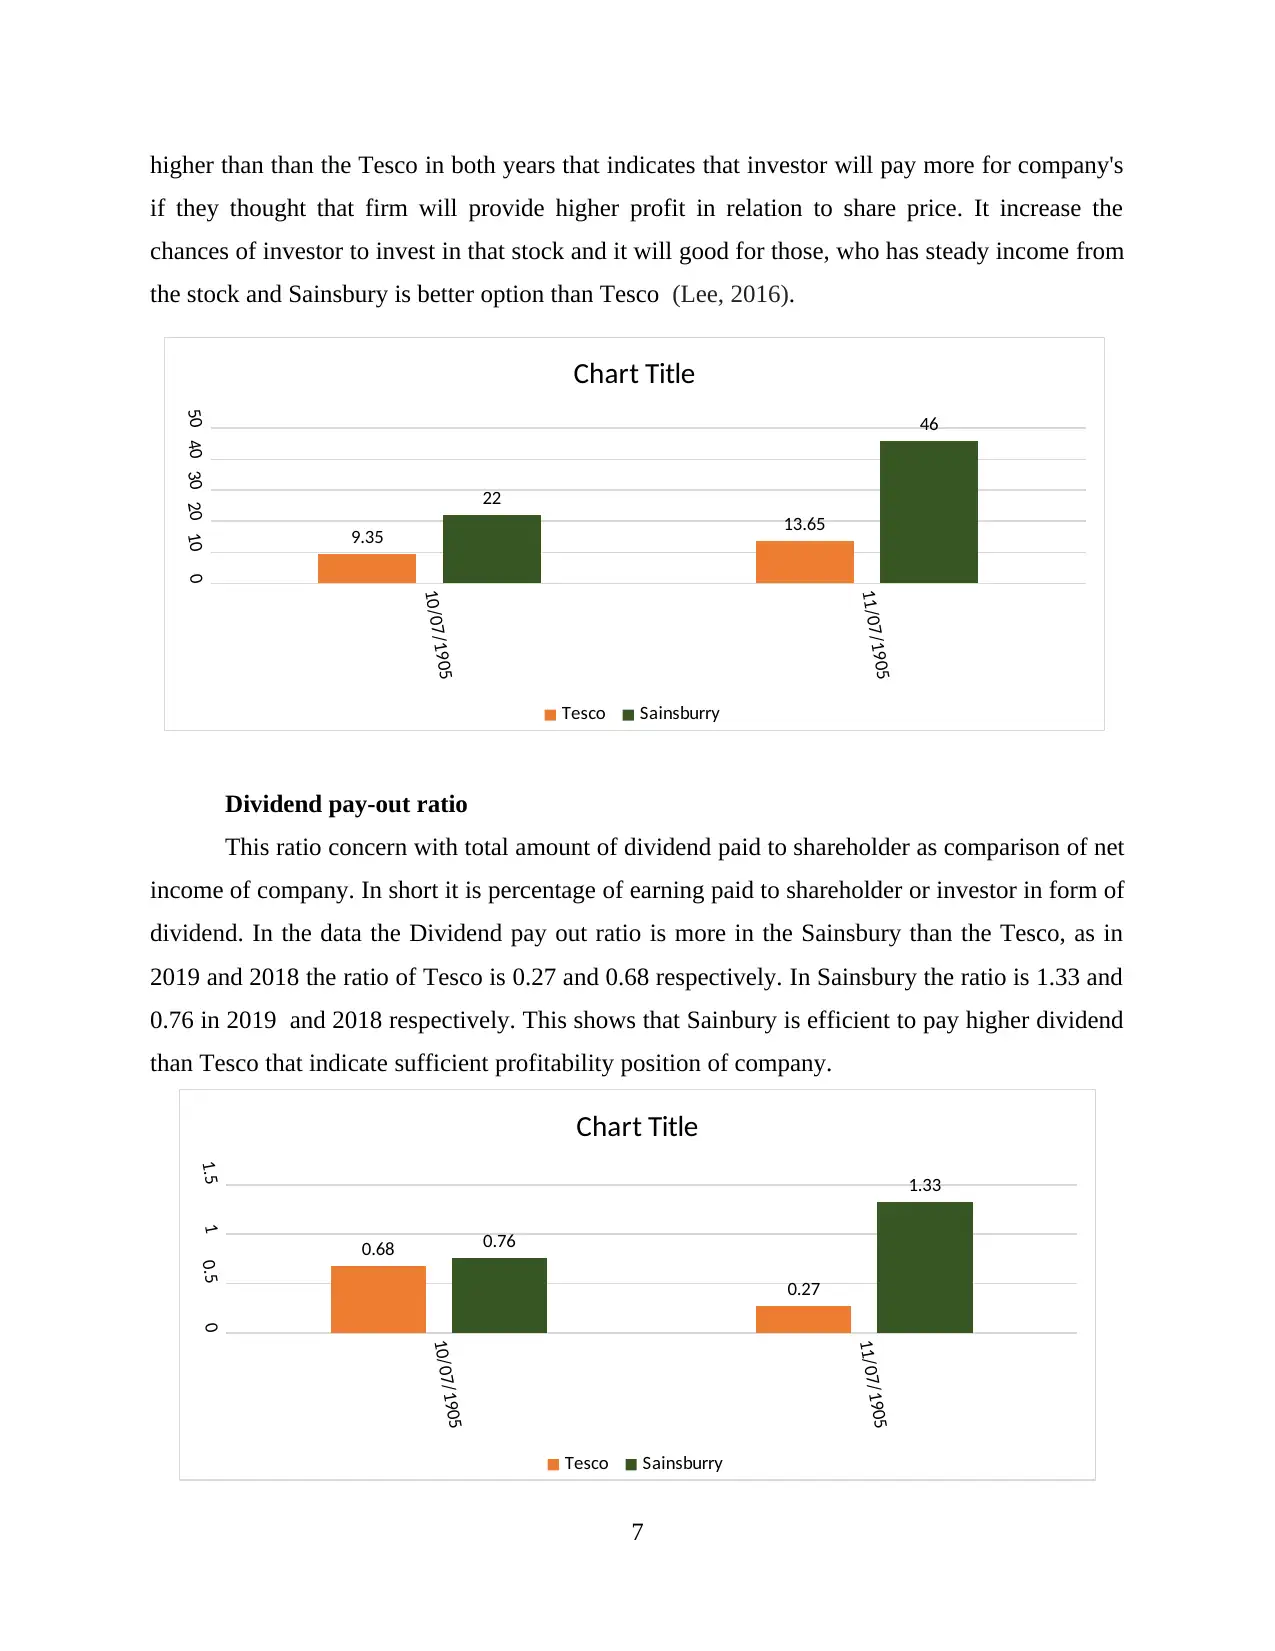
higher than than the Tesco in both years that indicates that investor will pay more for company's
if they thought that firm will provide higher profit in relation to share price. It increase the
chances of investor to invest in that stock and it will good for those, who has steady income from
the stock and Sainsbury is better option than Tesco (Lee, 2016).
Dividend pay-out ratio
This ratio concern with total amount of dividend paid to shareholder as comparison of net
income of company. In short it is percentage of earning paid to shareholder or investor in form of
dividend. In the data the Dividend pay out ratio is more in the Sainsbury than the Tesco, as in
2019 and 2018 the ratio of Tesco is 0.27 and 0.68 respectively. In Sainsbury the ratio is 1.33 and
0.76 in 2019 and 2018 respectively. This shows that Sainbury is efficient to pay higher dividend
than Tesco that indicate sufficient profitability position of company.
7
10/07/1905
11/07/1905
01020304050
9.35 13.65
22
46
Chart Title
Tesco Sainsburry
10/07/1905
11/07/1905
00.511.5
0.68
0.27
0.76
1.33
Chart Title
Tesco Sainsburry
Paraphrase This Document
Need a fresh take? Get an instant paraphrase of this document with our AI Paraphraser
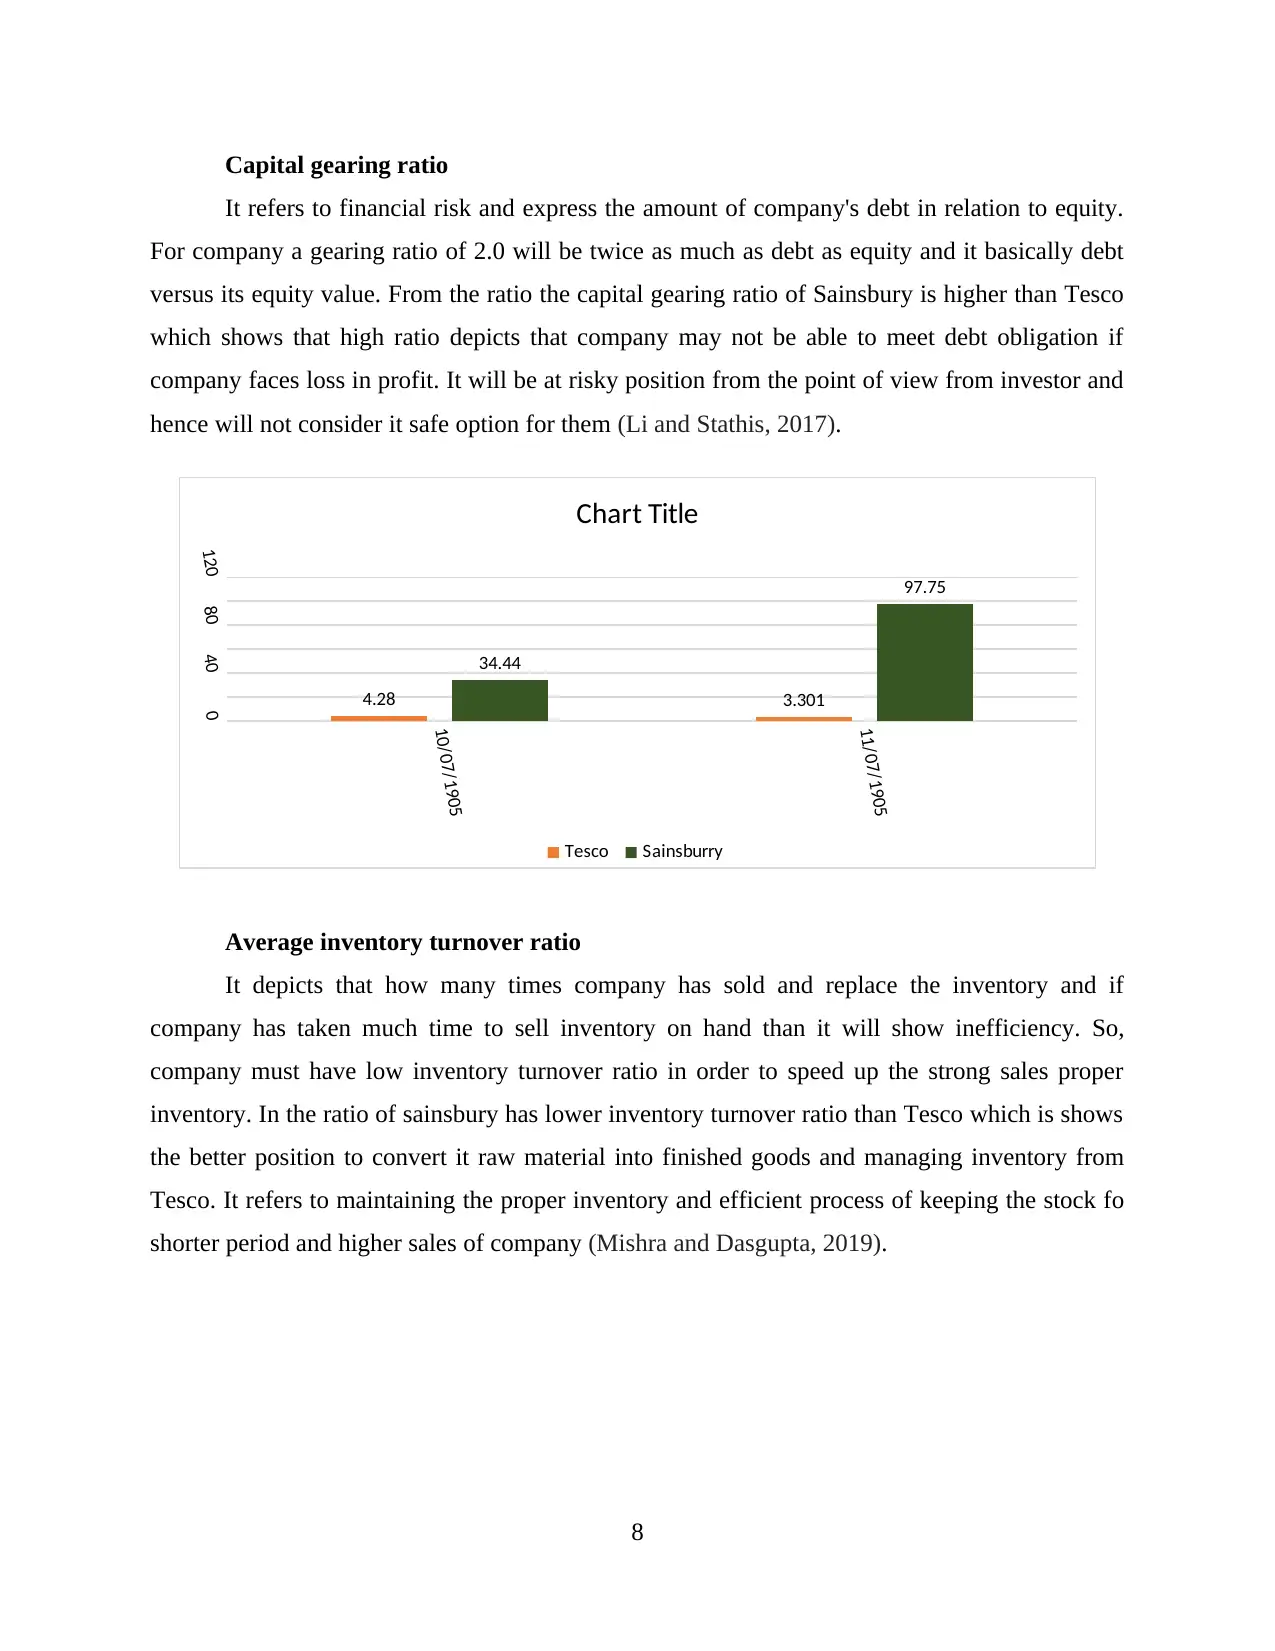
Capital gearing ratio
It refers to financial risk and express the amount of company's debt in relation to equity.
For company a gearing ratio of 2.0 will be twice as much as debt as equity and it basically debt
versus its equity value. From the ratio the capital gearing ratio of Sainsbury is higher than Tesco
which shows that high ratio depicts that company may not be able to meet debt obligation if
company faces loss in profit. It will be at risky position from the point of view from investor and
hence will not consider it safe option for them (Li and Stathis, 2017).
Average inventory turnover ratio
It depicts that how many times company has sold and replace the inventory and if
company has taken much time to sell inventory on hand than it will show inefficiency. So,
company must have low inventory turnover ratio in order to speed up the strong sales proper
inventory. In the ratio of sainsbury has lower inventory turnover ratio than Tesco which is shows
the better position to convert it raw material into finished goods and managing inventory from
Tesco. It refers to maintaining the proper inventory and efficient process of keeping the stock fo
shorter period and higher sales of company (Mishra and Dasgupta, 2019).
8
10/07/1905
11/07/1905
04080120
4.28 3.301
34.44
97.75
Chart Title
Tesco Sainsburry
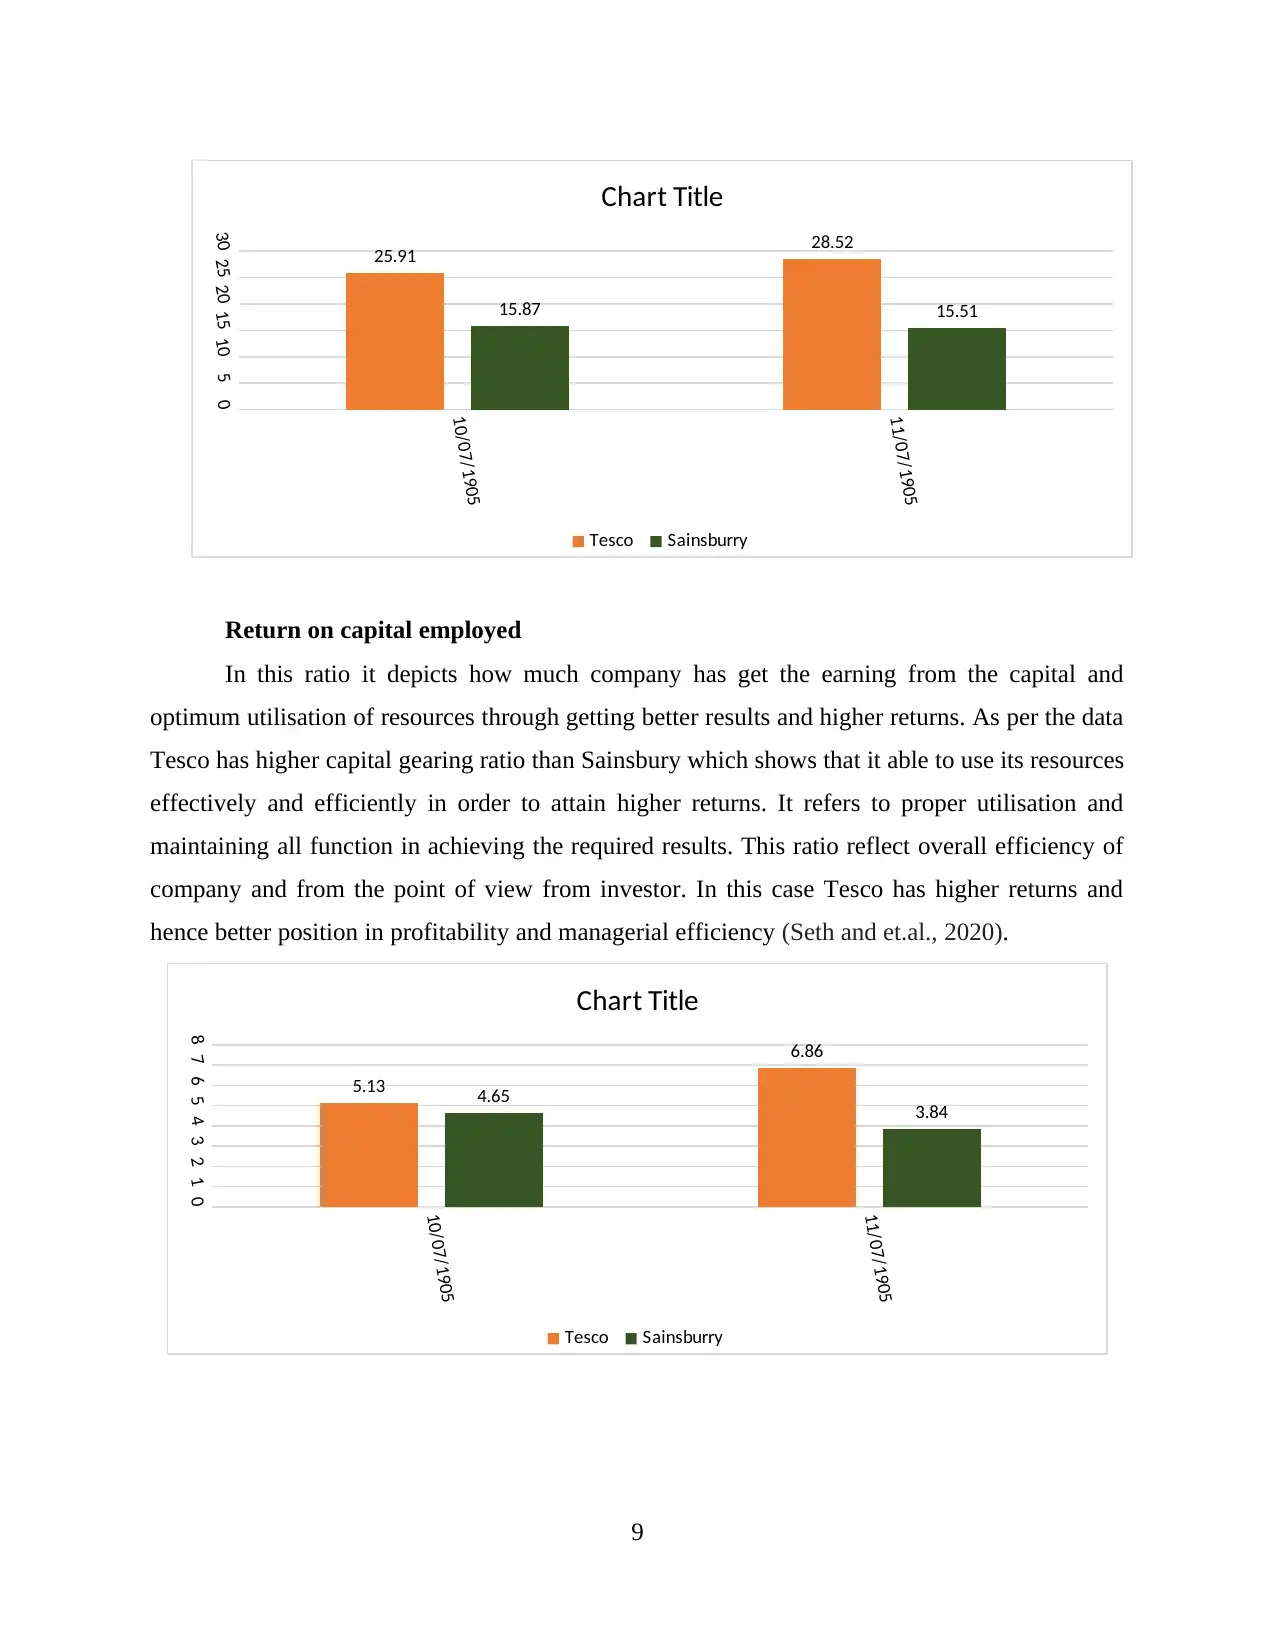
Return on capital employed
In this ratio it depicts how much company has get the earning from the capital and
optimum utilisation of resources through getting better results and higher returns. As per the data
Tesco has higher capital gearing ratio than Sainsbury which shows that it able to use its resources
effectively and efficiently in order to attain higher returns. It refers to proper utilisation and
maintaining all function in achieving the required results. This ratio reflect overall efficiency of
company and from the point of view from investor. In this case Tesco has higher returns and
hence better position in profitability and managerial efficiency (Seth and et.al., 2020).
9
10/07/1905
11/07/1905
051015202530 25.91 28.52
15.87 15.51
Chart Title
Tesco Sainsburry
10/07/1905
11/07/1905
012345678
5.13
6.86
4.65 3.84
Chart Title
Tesco Sainsburry
⊘ This is a preview!⊘
Do you want full access?
Subscribe today to unlock all pages.
Trusted by 1+ million students worldwide
1 out of 18
Related Documents


Your All-in-One AI-Powered Toolkit for Academic Success.
+13062052269
info@desklib.com
Available 24*7 on WhatsApp / Email
![[object Object]](/_next/static/media/star-bottom.7253800d.svg)
Unlock your academic potential
Copyright © 2020–2026 A2Z Services. All Rights Reserved. Developed and managed by ZUCOL.