Financial Management: Tesco vs. Sainsbury Ratio Analysis Report
VerifiedAdded on 2020/02/12
|17
|3284
|417
Report
AI Summary
This report provides a financial ratio analysis of Tesco and Sainsbury, two leading UK retail organizations, over a five-year period (2012-2016). The analysis focuses on profitability ratios (gross profit, operating profit, and net profit margins), liquidity ratios (current and quick ratios), solvency ratios (debt-equity ratio), and efficiency ratios (inventory and debtor turnover ratios). The report compares the financial performance of the two companies, highlighting trends and key differences. The analysis reveals that Sainsbury generally maintained a better financial position in terms of profitability and solvency compared to Tesco during the evaluated period. The report concludes with recommendations for Tesco to improve its financial performance, including focusing on product quality and inventory management. The report uses financial statements and ratio analysis to assess the financial health and efficiency of both firms, providing insights into their performance and competitive positions within the retail sector. The analysis underscores the importance of effective financial management in achieving organizational objectives and navigating market competition.

Financial Management
Paraphrase This Document
Need a fresh take? Get an instant paraphrase of this document with our AI Paraphraser
Table of Contents
INTRODUCTION...........................................................................................................................3
MAIN BODY..................................................................................................................................3
Financial ratio analysis of Tesco and Sainsbury for the period of Five years ‘...........................3
CONCLUSION................................................................................................................................7
RECOMMENDATIONS.................................................................................................................7
REFERENCES................................................................................................................................9
APPENDIX ].................................................................................................................................10
INTRODUCTION
Financial management is highly concerned with making suitable decision by making
evaluation of the monetary health and performance. In the present times, effectual management
of fund is highly required to attain organizational aims and objectives. Hence, by using ratio
analysis tool business unit can assess the extent to which it has made optimum use of funds over
the time frame and as compared to the competitors. This project report is based on Tesco and
Sainsbury which are the leading retail organizations of UK. Both the firms are competing with
each other in terms of customer base and market position.Hence, in this, report will shed light on
the financial health and performance ofTesco over the period of five years. Besides this, it also
entails the extent to which Tesco has generated enough profitability in against to the rival firm.
MAIN BODY
Financial ratio analysis of Tesco and Sainsbury for the period of Five years ‘
Profitability ratios
Enclosed in Appendix 2
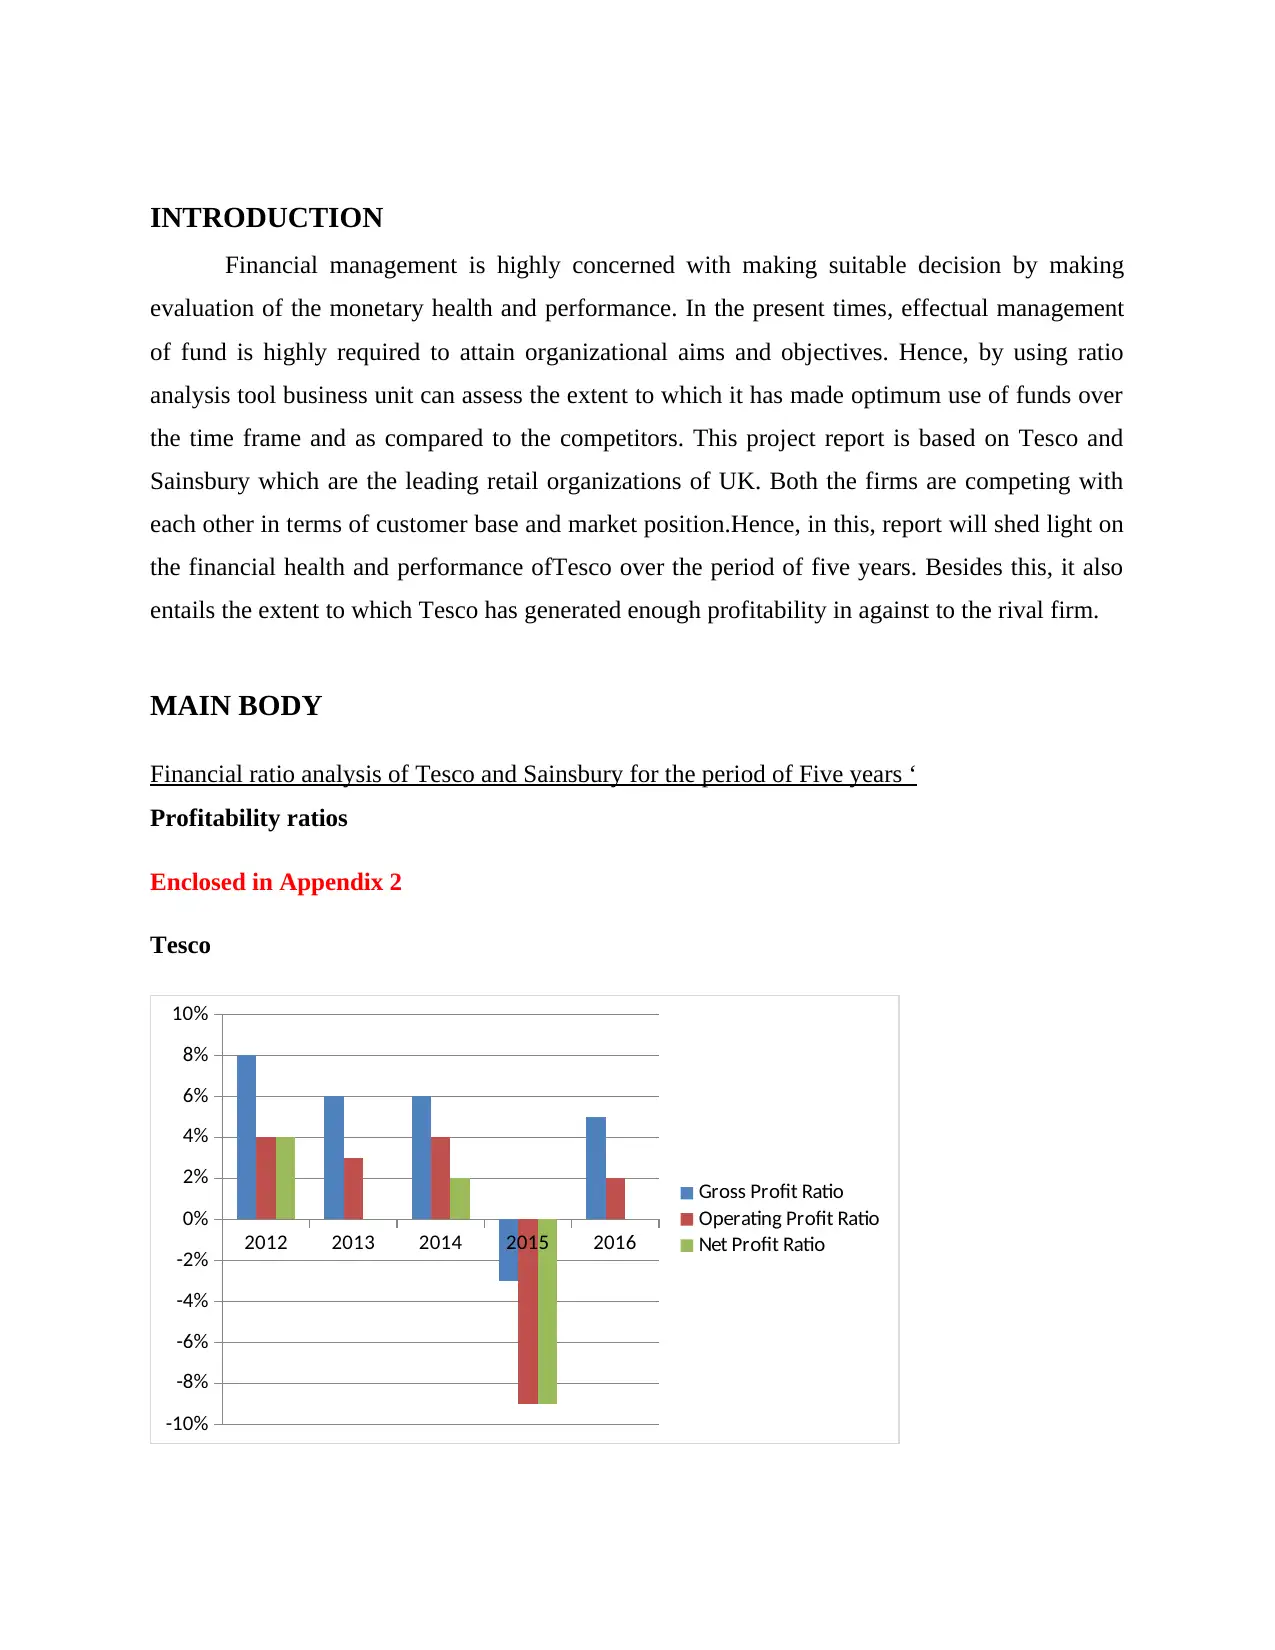
Tesco
2012 2013 2014 2015 2016
-10%
-8%
-6%
-4%
-2%
0%
2%
4%
6%
8%
10%
Gross Profit Ratio
Operating Profit Ratio
Net Profit Ratio
Financial management is highly concerned with making suitable decision by making
evaluation of the monetary health and performance. In the present times, effectual management
of fund is highly required to attain organizational aims and objectives. Hence, by using ratio
analysis tool business unit can assess the extent to which it has made optimum use of funds over
the time frame and as compared to the competitors. This project report is based on Tesco and
Sainsbury which are the leading retail organizations of UK. Both the firms are competing with
each other in terms of customer base and market position.Hence, in this, report will shed light on
the financial health and performance ofTesco over the period of five years. Besides this, it also
entails the extent to which Tesco has generated enough profitability in against to the rival firm.
MAIN BODY
Financial ratio analysis of Tesco and Sainsbury for the period of Five years ‘
Profitability ratios
Enclosed in Appendix 2
Tesco
2012 2013 2014 2015 2016
-10%
-8%
-6%
-4%
-2%
0%
2%
4%
6%
8%
10%
Gross Profit Ratio
Operating Profit Ratio
Net Profit Ratio
⊘ This is a preview!⊘
Do you want full access?
Subscribe today to unlock all pages.
Trusted by 1+ million students worldwide
Enclosed in Appendix 1
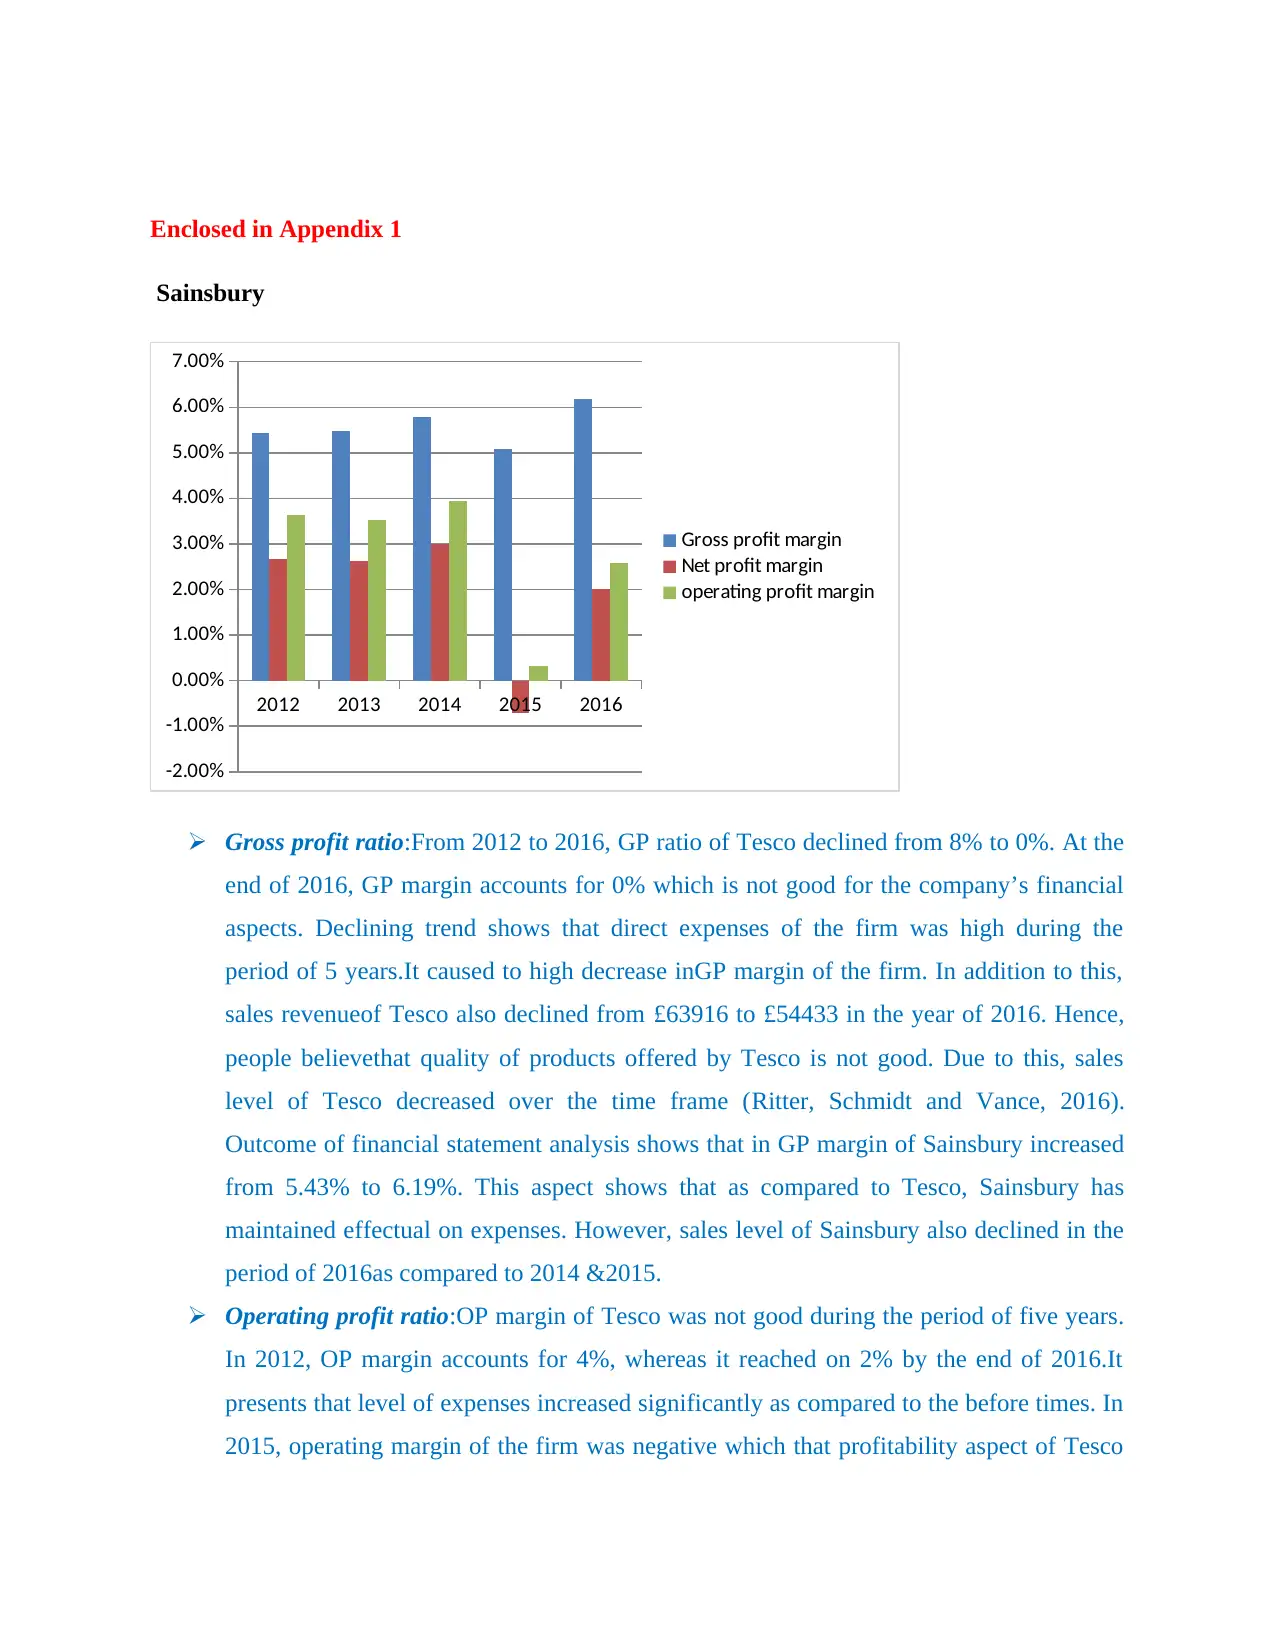
Sainsbury
2012 2013 2014 2015 2016
-2.00%
-1.00%
0.00%
1.00%
2.00%
3.00%
4.00%
5.00%
6.00%
7.00%
Gross profit margin
Net profit margin
operating profit margin
Gross profit ratio:From 2012 to 2016, GP ratio of Tesco declined from 8% to 0%. At the
end of 2016, GP margin accounts for 0% which is not good for the company’s financial
aspects. Declining trend shows that direct expenses of the firm was high during the
period of 5 years.It caused to high decrease inGP margin of the firm. In addition to this,
sales revenueof Tesco also declined from £63916 to £54433 in the year of 2016. Hence,
people believethat quality of products offered by Tesco is not good. Due to this, sales
level of Tesco decreased over the time frame (Ritter, Schmidt and Vance, 2016).
Outcome of financial statement analysis shows that in GP margin of Sainsbury increased
from 5.43% to 6.19%. This aspect shows that as compared to Tesco, Sainsbury has
maintained effectual on expenses. However, sales level of Sainsbury also declined in the
period of 2016as compared to 2014 &2015.
Operating profit ratio:OP margin of Tesco was not good during the period of five years.
In 2012, OP margin accounts for 4%, whereas it reached on 2% by the end of 2016.It
presents that level of expenses increased significantly as compared to the before times. In
2015, operating margin of the firm was negative which that profitability aspect of Tesco
Paraphrase This Document
Need a fresh take? Get an instant paraphrase of this document with our AI Paraphraser
is worst.On the other side, operating profit margin of Sainsburydeclined over the time
frame (Jami and Bahar, 2016). However, operating profit ratio of Sainsbury was .32%
and 2.58%. Hence, it can be stated that operating margin of Sainsbury was good in
against to Tesco.
Net profit ratio: By applying the tools and techniques of ratio analysis, it has been
assessed that NP margin of Tesco wasNIL in the year of 2013 and 2016. On the other
hand, NP margin of Tesco was negative such -9% in period of2015. By considering this,
it can be stated that as compared to sales revenue, indirect expense level of business unit
was high. Hence, due to the high expense level NP margin of Tesco decreased
significantly. Along with this, due to the existence of high competition during the period
of 2015 Sainsbury also placed more emphasis on the promotional aspect. Hence, due to
this, NP margin of the firm accounts for negative -0.70. In comparison to Tesco,
Sainsbury generated positive profit margin of 2%. It is still lowerbut from the perspective
of existence of competition and competitors Sainsbury’s profitability aspectgood
(Goldmann, 2017). Hence, from overall evaluation, it can be stated that profitability
position of Sainsbury was sound in comparison to Tesco.
Liquidity ratios
Enclosed in Appendix 2
Tesco
2012 2013 2014 2015 2016
0
0.1
0.2
0.3
0.4
0.5
0.6
0.7
0.8
Current Ratio
Quick Ratio
Enclosed in Appendix 1
Sainsbury
2012 2013 2014 2015 2016
0
0.1
0.2
0.3
0.4
0.5
0.6
0.7
Current ratio
Quick ratio/acid test ratio
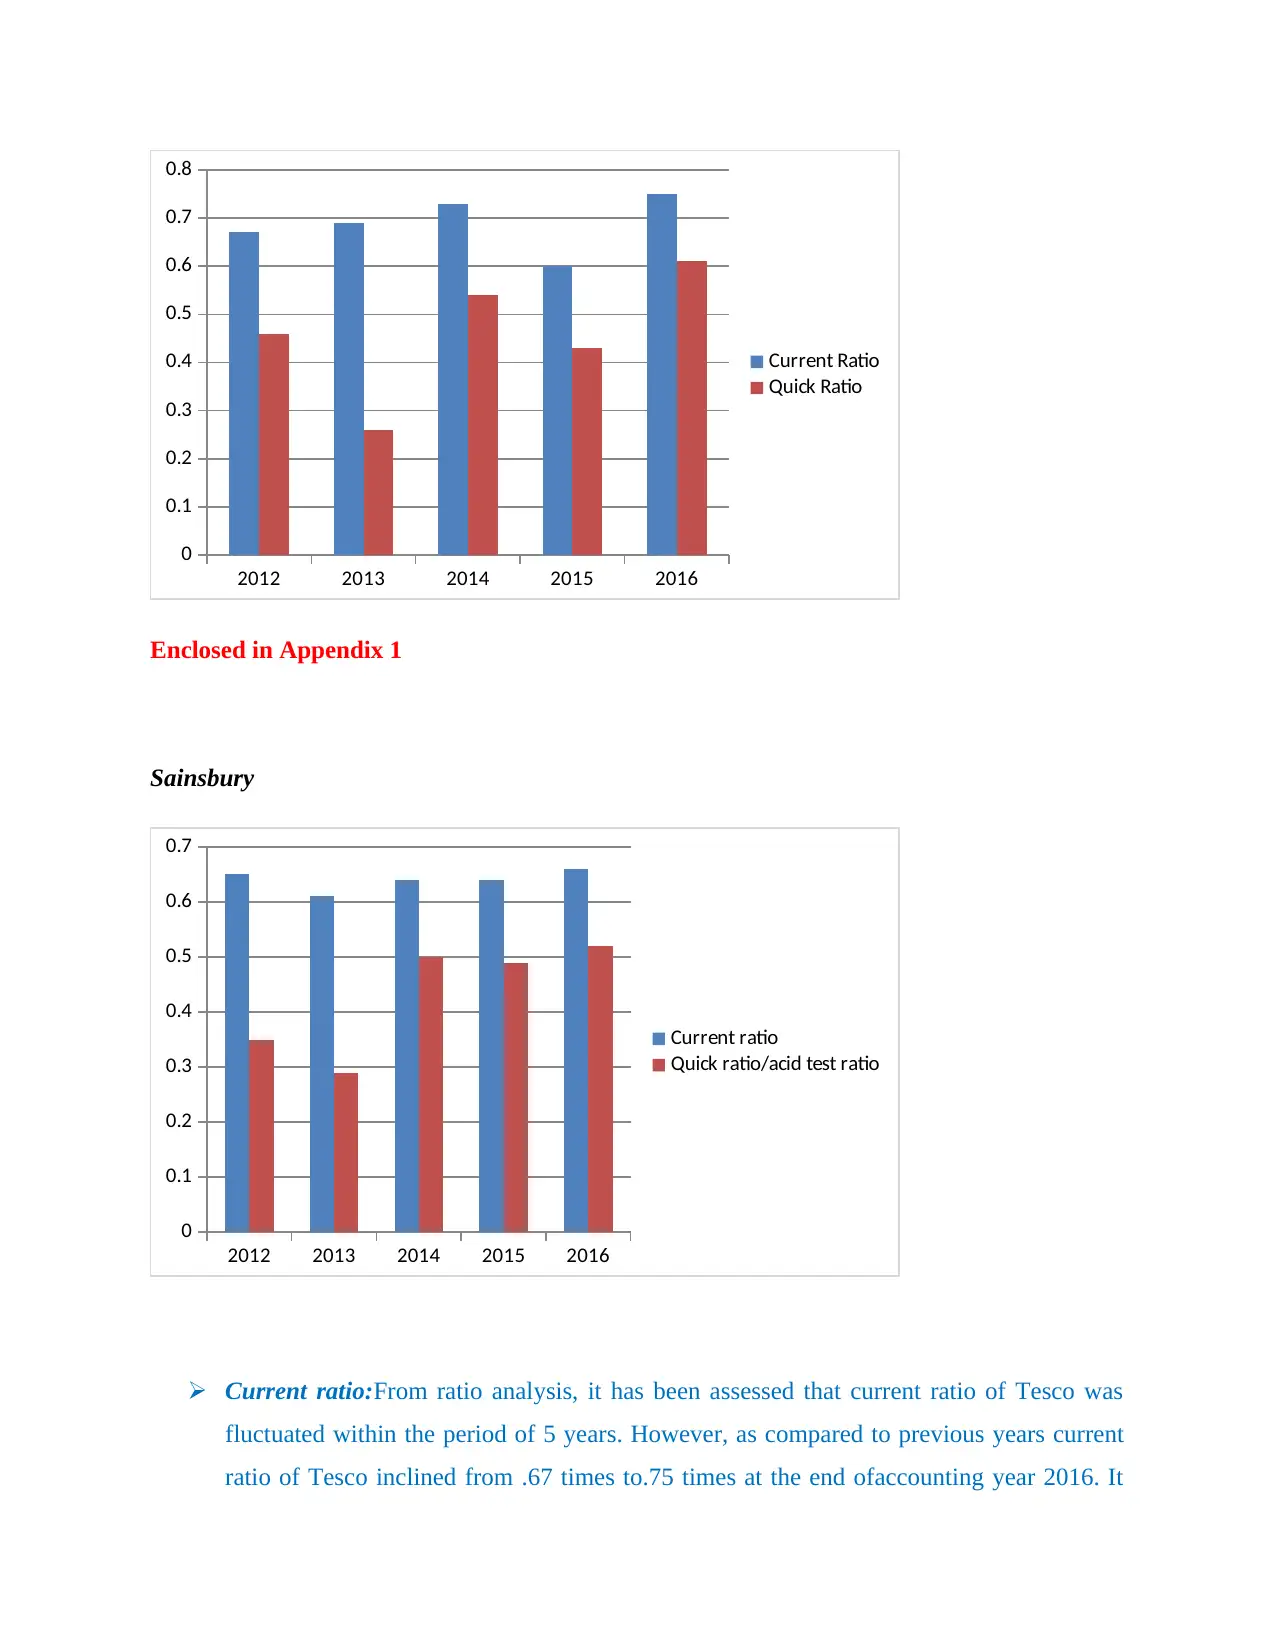
Current ratio:From ratio analysis, it has been assessed that current ratio of Tesco was
fluctuated within the period of 5 years. However, as compared to previous years current
ratio of Tesco inclined from .67 times to.75 times at the end ofaccounting year 2016. It
0
0.1
0.2
0.3
0.4
0.5
0.6
0.7
0.8
Current Ratio
Quick Ratio
Enclosed in Appendix 1
Sainsbury
2012 2013 2014 2015 2016
0
0.1
0.2
0.3
0.4
0.5
0.6
0.7
Current ratio
Quick ratio/acid test ratio
Current ratio:From ratio analysis, it has been assessed that current ratio of Tesco was
fluctuated within the period of 5 years. However, as compared to previous years current
ratio of Tesco inclined from .67 times to.75 times at the end ofaccounting year 2016. It
⊘ This is a preview!⊘
Do you want full access?
Subscribe today to unlock all pages.
Trusted by 1+ million students worldwide
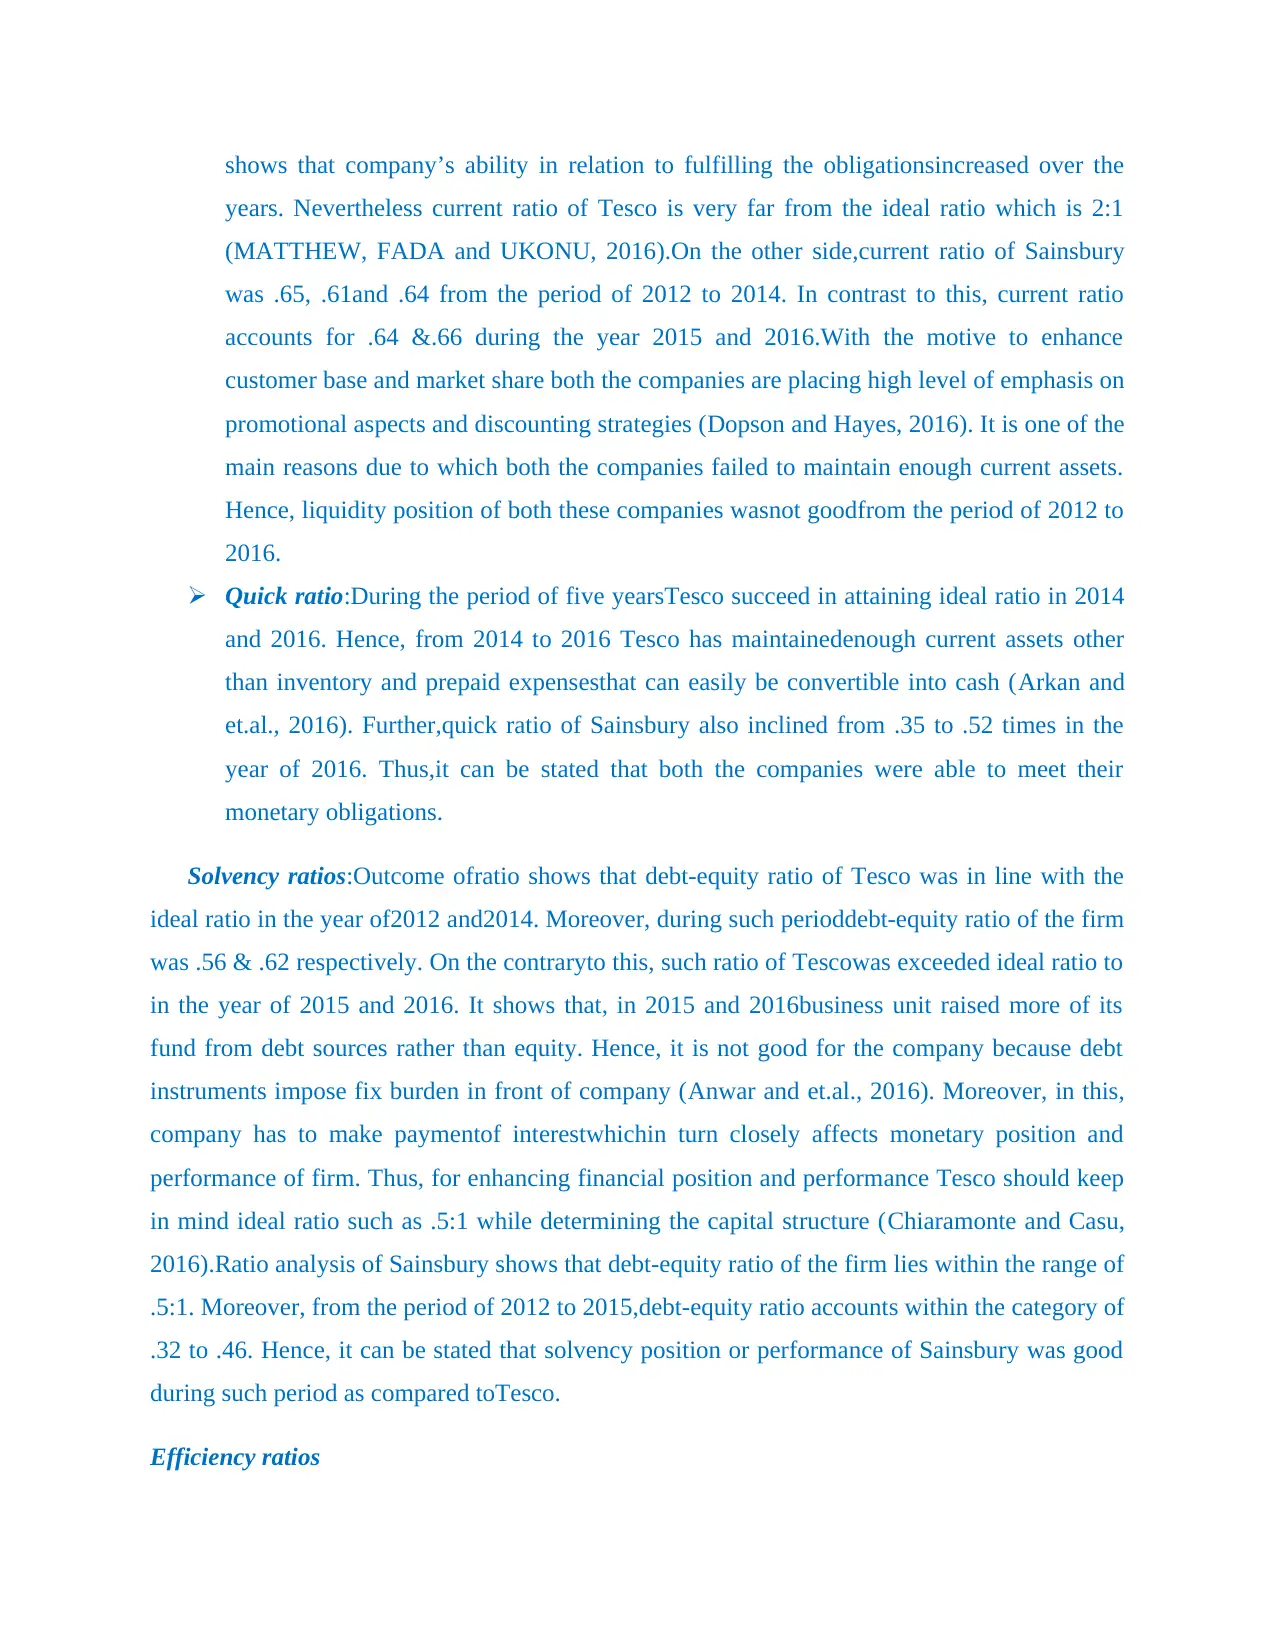
shows that company’s ability in relation to fulfilling the obligationsincreased over the
years. Nevertheless current ratio of Tesco is very far from the ideal ratio which is 2:1
(MATTHEW, FADA and UKONU, 2016).On the other side,current ratio of Sainsbury
was .65, .61and .64 from the period of 2012 to 2014. In contrast to this, current ratio
accounts for .64 &.66 during the year 2015 and 2016.With the motive to enhance
customer base and market share both the companies are placing high level of emphasis on
promotional aspects and discounting strategies (Dopson and Hayes, 2016). It is one of the
main reasons due to which both the companies failed to maintain enough current assets.
Hence, liquidity position of both these companies wasnot goodfrom the period of 2012 to
2016.
Quick ratio:During the period of five yearsTesco succeed in attaining ideal ratio in 2014
and 2016. Hence, from 2014 to 2016 Tesco has maintainedenough current assets other
than inventory and prepaid expensesthat can easily be convertible into cash (Arkan and
et.al., 2016). Further,quick ratio of Sainsbury also inclined from .35 to .52 times in the
year of 2016. Thus,it can be stated that both the companies were able to meet their
monetary obligations.
Solvency ratios:Outcome ofratio shows that debt-equity ratio of Tesco was in line with the
ideal ratio in the year of2012 and2014. Moreover, during such perioddebt-equity ratio of the firm
was .56 & .62 respectively. On the contraryto this, such ratio of Tescowas exceeded ideal ratio to
in the year of 2015 and 2016. It shows that, in 2015 and 2016business unit raised more of its
fund from debt sources rather than equity. Hence, it is not good for the company because debt
instruments impose fix burden in front of company (Anwar and et.al., 2016). Moreover, in this,
company has to make paymentof interestwhichin turn closely affects monetary position and
performance of firm. Thus, for enhancing financial position and performance Tesco should keep
in mind ideal ratio such as .5:1 while determining the capital structure (Chiaramonte and Casu,
2016).Ratio analysis of Sainsbury shows that debt-equity ratio of the firm lies within the range of
.5:1. Moreover, from the period of 2012 to 2015,debt-equity ratio accounts within the category of
.32 to .46. Hence, it can be stated that solvency position or performance of Sainsbury was good
during such period as compared toTesco.
Efficiency ratios
Paraphrase This Document
Need a fresh take? Get an instant paraphrase of this document with our AI Paraphraser
Debtor’s turnover ratio is the one of the main elements of working capital management.
Moreover, company’s ability in relation to meeting the financial obligation is highly influenced
from the time period within which it will receive or collect money from debtors (Ahmad, 2016).
Hence, credit which is provided by the business organization to the customer has high level of
impact on working capital management. Moreover, in the absence of having enough funds it is
not possible for Tesco to carry out day to day activities more effectively and efficiently
(Inventory to Working Capital Analysis, 2016). Moreover, business organization itself purchases
material on a credit basis from suppliers. In this, if firm receives payment from debtors after long
time then it will find difficulty in making payment to creditors. Hence, by considering such
aspect it can be stated that debtor’s turnover ratio has significant impact on the aspects of
working capital management.
Along with this, high and low inventory turnover ratio also closely influences the aspects
of effective working capital management (Rakićević and et.al., 2016). Moreover, high inventory
turnover ratio presents that company is able to convert inventory into sales or cash more quickly.
Hence, such aspect has significant impact on company’s ability in relation to meeting of
monetary obligations (Bergo and et.al., 2016). Moreover, in the case of low inventory turnover
ratio, company is not in position to generate cash quickly by selling assets. Hence, both these are
the main two elements which in turn closely influences theworking capital management or
aspects of business organization.
Enclosed in Appendix 2
Tesco
Enclosed in Appendix 1
Sainsbury
2012 2013 2014 2015 2016
0
50
100
150
200
250
300
debtors turnover ratio
Inventory turnover ratio
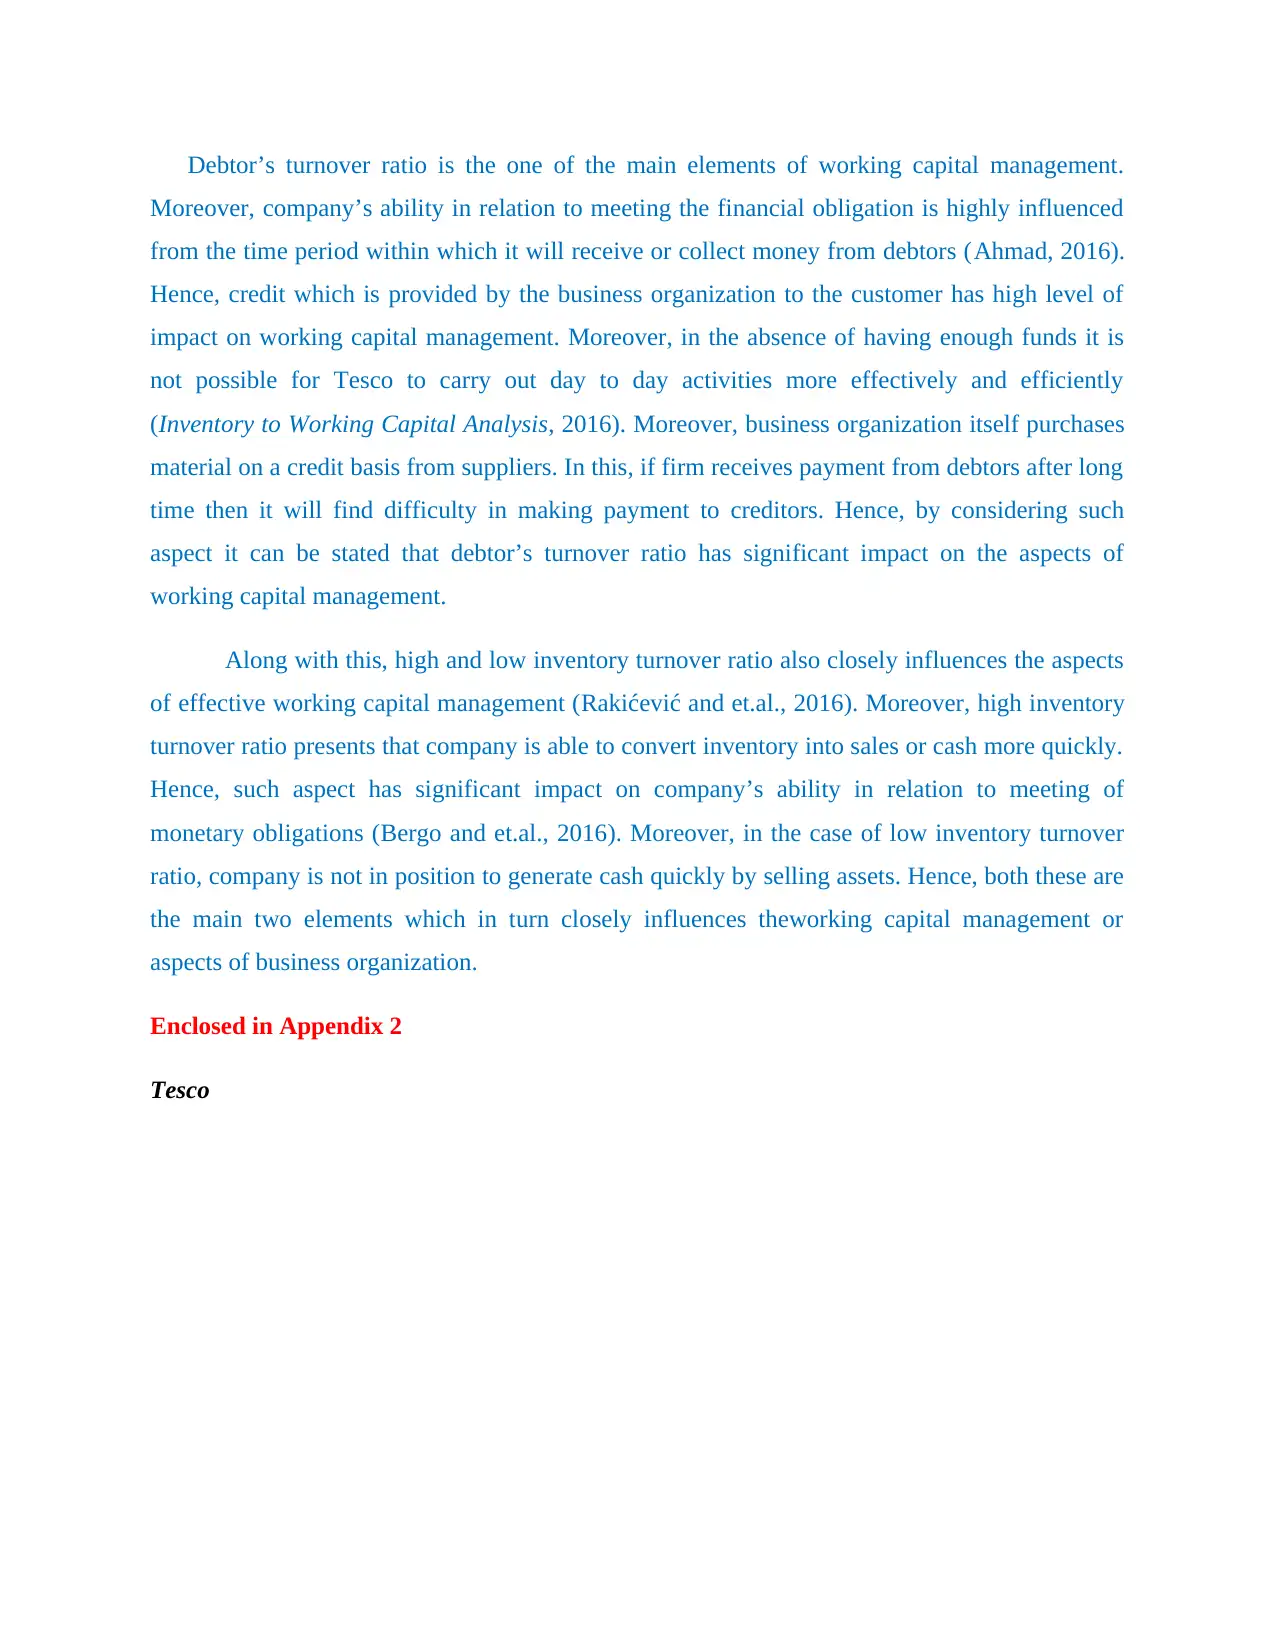
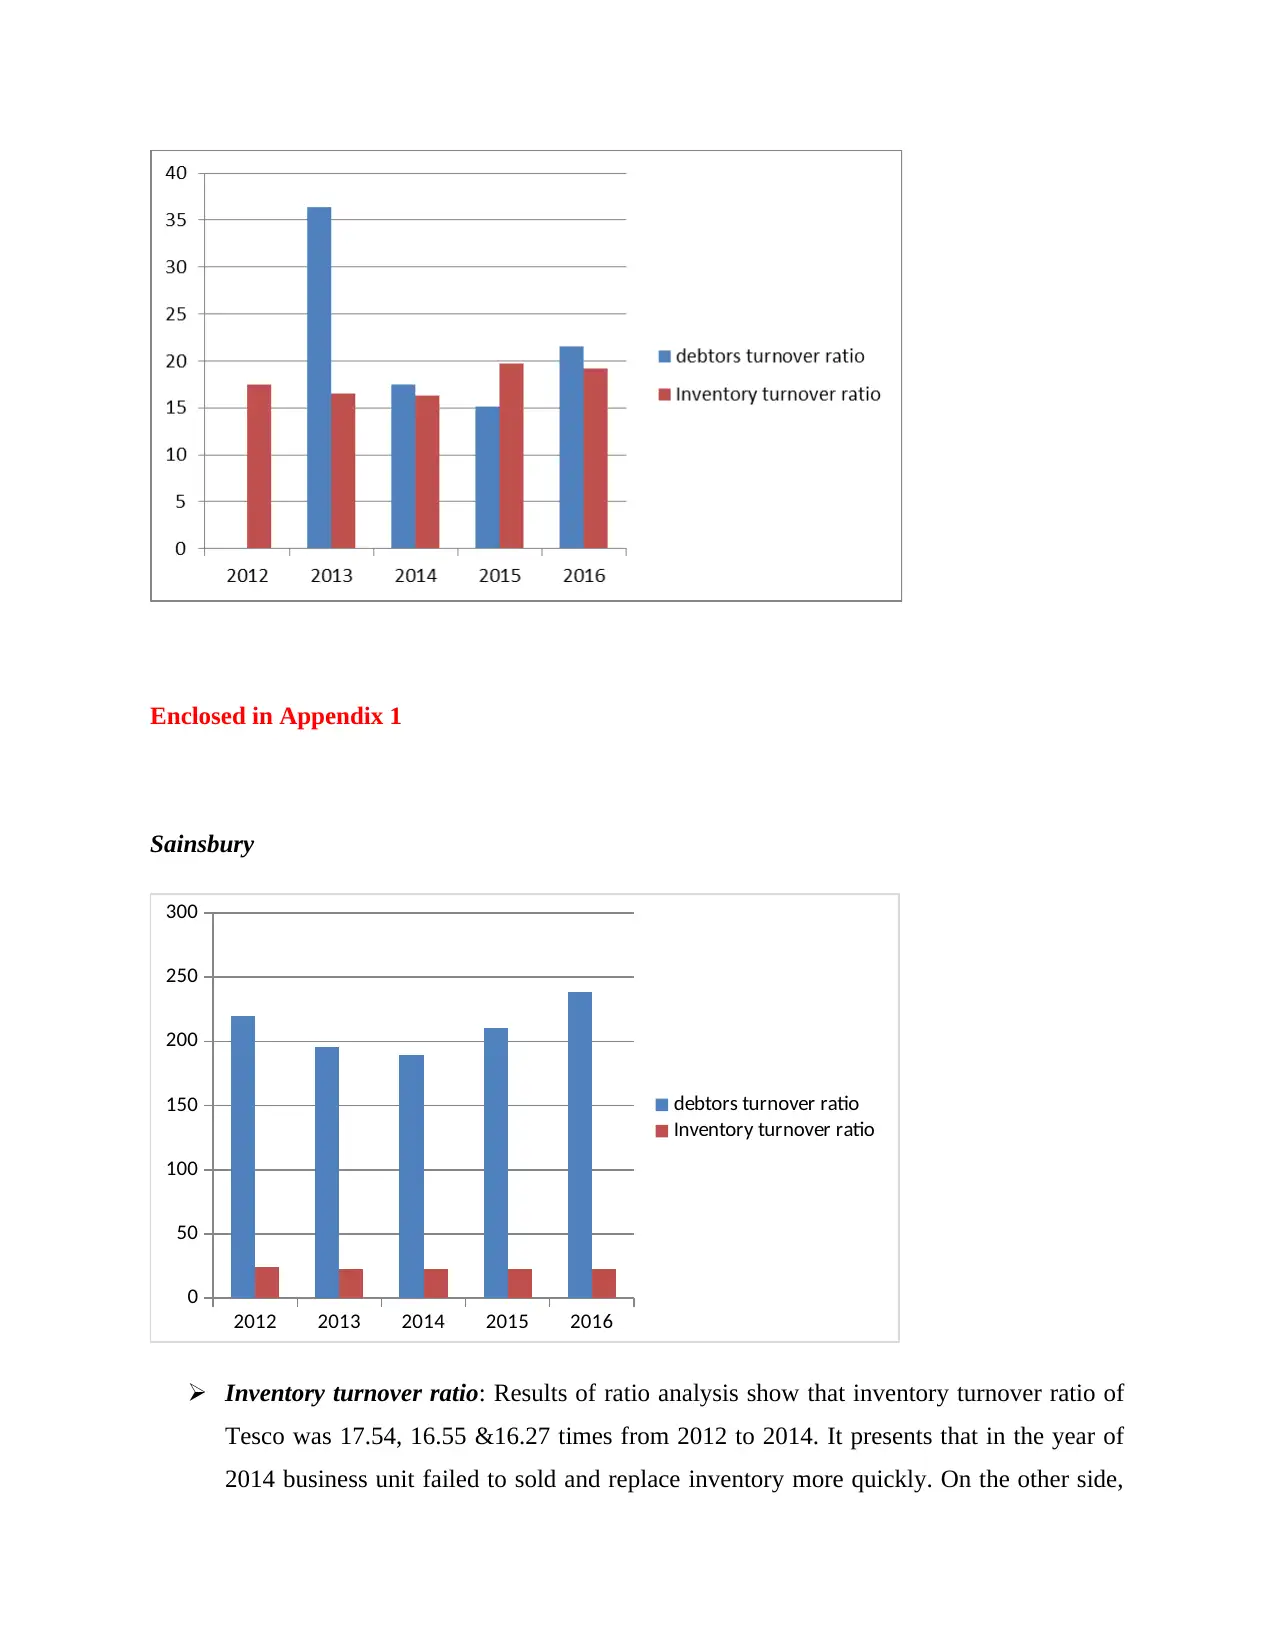
Inventory turnover ratio: Results of ratio analysis show that inventory turnover ratio of
Tesco was 17.54, 16.55 &16.27 times from 2012 to 2014. It presents that in the year of
2014 business unit failed to sold and replace inventory more quickly. On the other side,
Sainsbury
2012 2013 2014 2015 2016
0
50
100
150
200
250
300
debtors turnover ratio
Inventory turnover ratio
Inventory turnover ratio: Results of ratio analysis show that inventory turnover ratio of
Tesco was 17.54, 16.55 &16.27 times from 2012 to 2014. It presents that in the year of
2014 business unit failed to sold and replace inventory more quickly. On the other side,
⊘ This is a preview!⊘
Do you want full access?
Subscribe today to unlock all pages.
Trusted by 1+ million students worldwide
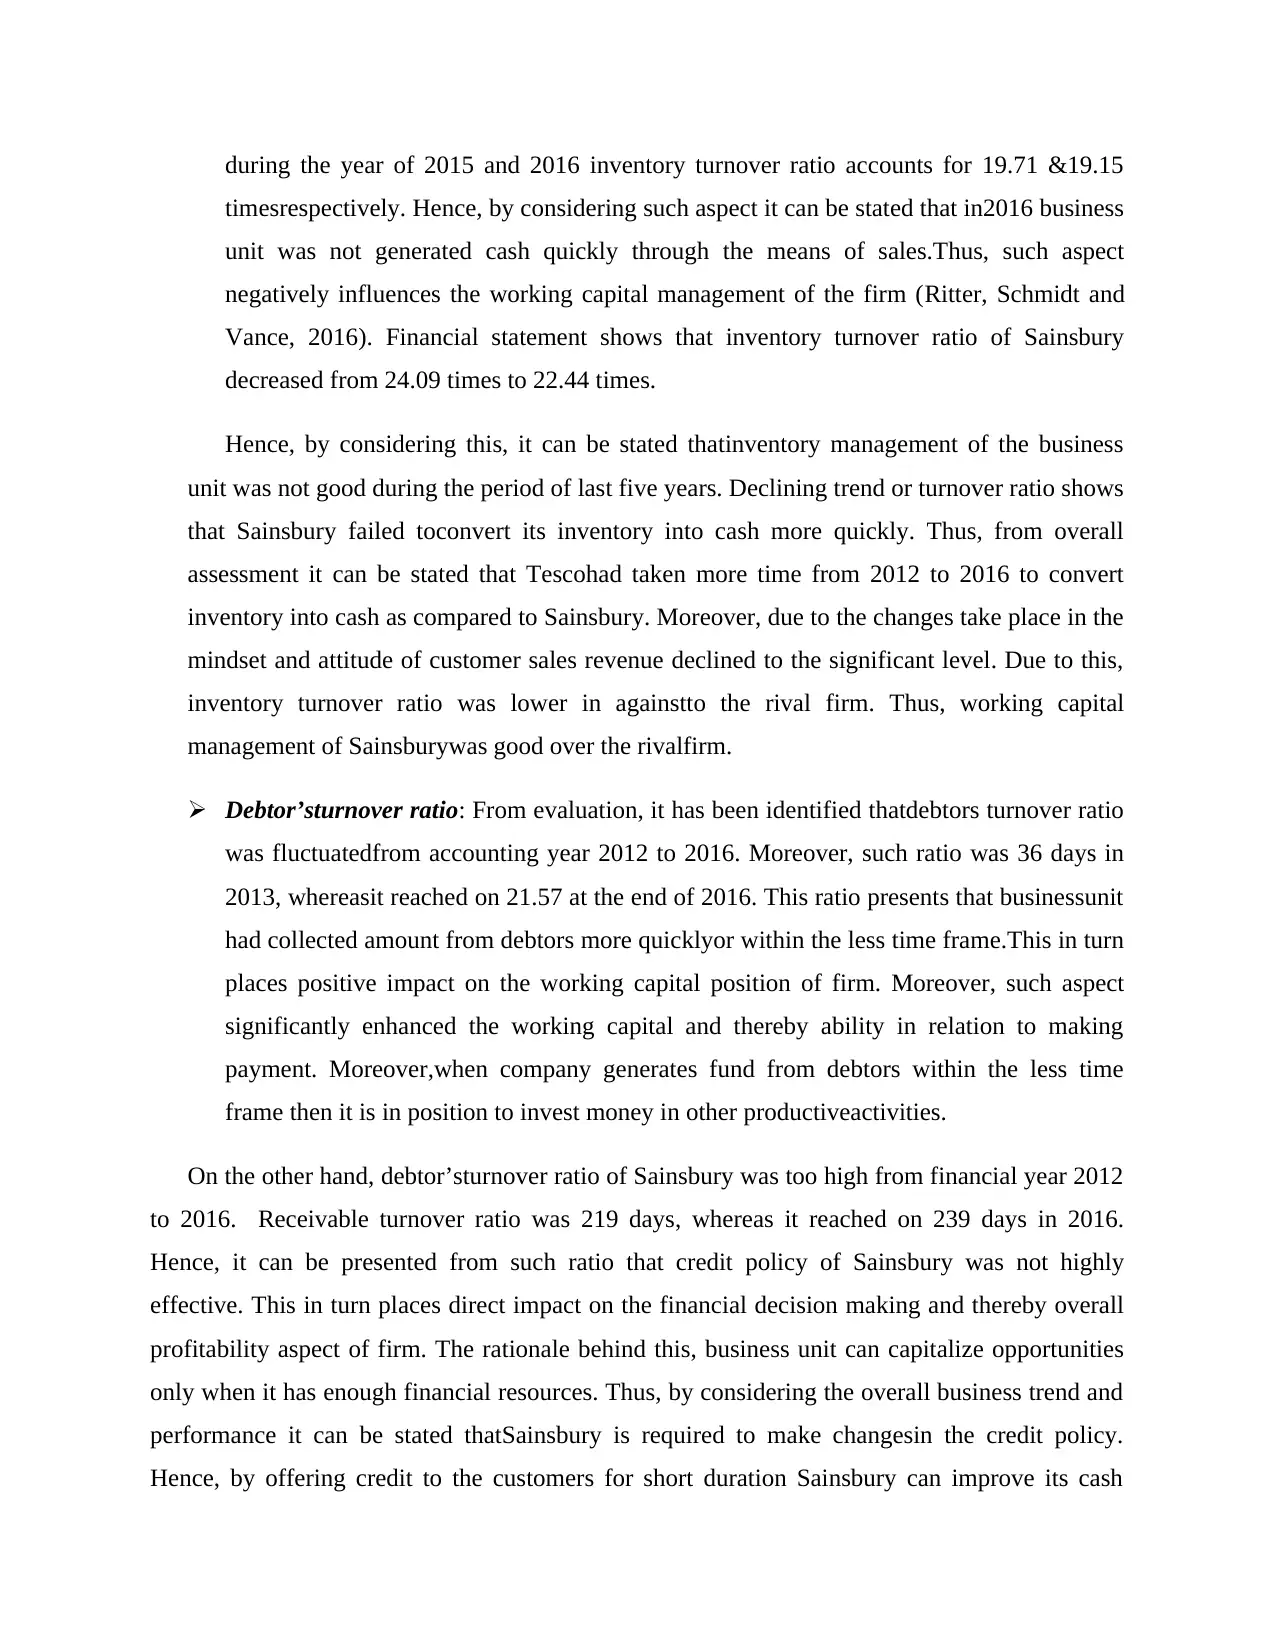
during the year of 2015 and 2016 inventory turnover ratio accounts for 19.71 &19.15
timesrespectively. Hence, by considering such aspect it can be stated that in2016 business
unit was not generated cash quickly through the means of sales.Thus, such aspect
negatively influences the working capital management of the firm (Ritter, Schmidt and
Vance, 2016). Financial statement shows that inventory turnover ratio of Sainsbury
decreased from 24.09 times to 22.44 times.
Hence, by considering this, it can be stated thatinventory management of the business
unit was not good during the period of last five years. Declining trend or turnover ratio shows
that Sainsbury failed toconvert its inventory into cash more quickly. Thus, from overall
assessment it can be stated that Tescohad taken more time from 2012 to 2016 to convert
inventory into cash as compared to Sainsbury. Moreover, due to the changes take place in the
mindset and attitude of customer sales revenue declined to the significant level. Due to this,
inventory turnover ratio was lower in againstto the rival firm. Thus, working capital
management of Sainsburywas good over the rivalfirm.
Debtor’sturnover ratio: From evaluation, it has been identified thatdebtors turnover ratio
was fluctuatedfrom accounting year 2012 to 2016. Moreover, such ratio was 36 days in
2013, whereasit reached on 21.57 at the end of 2016. This ratio presents that businessunit
had collected amount from debtors more quicklyor within the less time frame.This in turn
places positive impact on the working capital position of firm. Moreover, such aspect
significantly enhanced the working capital and thereby ability in relation to making
payment. Moreover,when company generates fund from debtors within the less time
frame then it is in position to invest money in other productiveactivities.
On the other hand, debtor’sturnover ratio of Sainsbury was too high from financial year 2012
to 2016. Receivable turnover ratio was 219 days, whereas it reached on 239 days in 2016.
Hence, it can be presented from such ratio that credit policy of Sainsbury was not highly
effective. This in turn places direct impact on the financial decision making and thereby overall
profitability aspect of firm. The rationale behind this, business unit can capitalize opportunities
only when it has enough financial resources. Thus, by considering the overall business trend and
performance it can be stated thatSainsbury is required to make changesin the credit policy.
Hence, by offering credit to the customers for short duration Sainsbury can improve its cash
Paraphrase This Document
Need a fresh take? Get an instant paraphrase of this document with our AI Paraphraser
conversion cycle to the significant level. Moreover, less turnover entails that business unit
receives payment from debtors within the fewer time frames.
CONCLUSION
From this report, it has been concluded that profitability aspect or position ofTesco was
not sound in the last 5 years. In comparison to this, rival firm such as Sainsbury has generated
high profit in the highly stiff competitive situation. Besides this, it can be revealed from the
report thatboth the do not have amount of assets for meeting the current financial obligations.
This in turn closely influences the decision making of investors in the negative direction. Further,
it has been articulated that financial structure of Sainsbury wassound from 2012 to 2016 as
compared to rival firm. It can be summarized that Tesco needs to undertake significant action or
measure for making improvementin theinventory turnover ratio. By this, Tesco can enhance
working capital aspect or position and becomes able to meet obligations more quickly.
RECOMMENDATIONS
It is recommendedto Tesco that it should focus on the improvement of product quality
and services. Moreover, now customers consider and make evaluationof both the factors
such as price and quality aspects while making decision about purchase. Hence, by
making focus on such aspects Tesco can improve its productivity and thereby
profitability. Along with this, in the advertisements Tesco should the quality aspectof
product which in turn helps in enticing the decision making of large of customers and
thereby profitability.
Besides this, it is advised to Tesco to undertake either zero base or activity based
budgeting technique. This in turn helps them in making control on expenses to a great
extent. Moreover, such techniques facilitate optimum allocation of funds thereby helps in
reducing the level of expenses.
Further, Tesco needs to make focus onthe maintenance of current assetssuch as cash,
debtors etc. Hence, by maintainingsuch assets unit can improve its liquidity position and
aspects. For this purpose, Tesco needs to make continuous monitoring of expenses.By
doing this, company can maintain high level of liquidity.
To prepare highly balanced financial Tesco should raise funds from equity sources in the
near future. It enables firm to ensure proper balance in thefinancial structureand thereby
makes improvement in the solvency position or aspects.
Tesco is required to develop positive image in the mind of customers regarding the
quality of products or services offered by it. Through this, business unit would become
ableto generate high cash by selling inventory more quickly.
⊘ This is a preview!⊘
Do you want full access?
Subscribe today to unlock all pages.
Trusted by 1+ million students worldwide
1 out of 17
Related Documents


Your All-in-One AI-Powered Toolkit for Academic Success.
+13062052269
info@desklib.com
Available 24*7 on WhatsApp / Email
![[object Object]](/_next/static/media/star-bottom.7253800d.svg)
Unlock your academic potential
Copyright © 2020–2026 A2Z Services. All Rights Reserved. Developed and managed by ZUCOL.