Ratio Evaluation and Financial Analysis: Tesco Group & Sainsbury Plc
VerifiedAdded on 2022/12/30
|18
|3959
|4
Report
AI Summary
This report presents a comprehensive financial analysis of Tesco and Sainsbury, two major players in the UK retail market. The analysis begins with a detailed ratio evaluation of both companies, covering key financial ratios such as current ratio, quick ratio, gross profit ratio, net profit ratio, P/E ratio, gearing, return on capital employed, inventory turnover, dividend pay-out ratio, and earnings per share. The study compares the financial performance of Tesco and Sainsbury over the period of 2018-2019. The report further explores investment appraisal methods for hypothetical projects and discusses the limitations of these methods in future decision-making. Finally, the report concludes with recommendations for both companies, focusing on strategies to improve financial performance and enhance shareholder value. The analysis highlights that Sainsbury's short-term profitability and monetary sustainability forecast is better than Tesco, but Tesco is more efficient in gross net and overall efficiency score. The report also highlights the importance of considering various ratios to understand financial health and make informed investment decisions.

Portfolio 1 and Portfolio 2
Paraphrase This Document
Need a fresh take? Get an instant paraphrase of this document with our AI Paraphraser
Contents
PORTFOLIO 1.................................................................................................................................3
Ratio evaluation of both companies:......................................................................................3
Recommendations:...............................................................................................................12
Restrictions for consuming ratio breakdown for determining firms financial status...........12
PORTFOLIO 2...............................................................................................................................13
Investment appraisal methods for both project A and B:.....................................................13
b. Limits of implementing investment appraisal methods for future decision:....................16
CONCLUSION..............................................................................................................................17
REFERENCES..............................................................................................................................18
INTRODUCTION
Finance refers to the management of the money, borrowing, lending, liabilities, capital
investments as well as other investment operations in management finance. The financial factor
involves mainly money accounting and financing procurement (Claessens and Yurtoglu, 2013).
Finance seems to be the central pillar of a company, because it offers knowledge and funds for
strategic management inside the business. The key aim of management financing would be to
decide how the business uses managerial accounting at multiple levels. That is whether the
organisation utilises established resources in its activities, the manager finance within a firm.
Any corporation pursued to obtain capital which finance helps to acquire and dispose of market
resources with the help of ratio analysis (Ratio analysis, 2020). Tesco Group and Sainsbury Plc
seem to be the firms selected for this analysis. In 1919 Tesco was formed and a retail-based
company founded and headquartered in 1869, it is a UK-based multinational grocery chain. This
report addresses concerns along with the analysis of those same proportions of these enterprises,
the flaws of the measures and the comparison charts of both companies. Moreover, the study also
addresses topics such as investment assessment money, limiting/reducing the proportion of
future decision-making.
PORTFOLIO 1
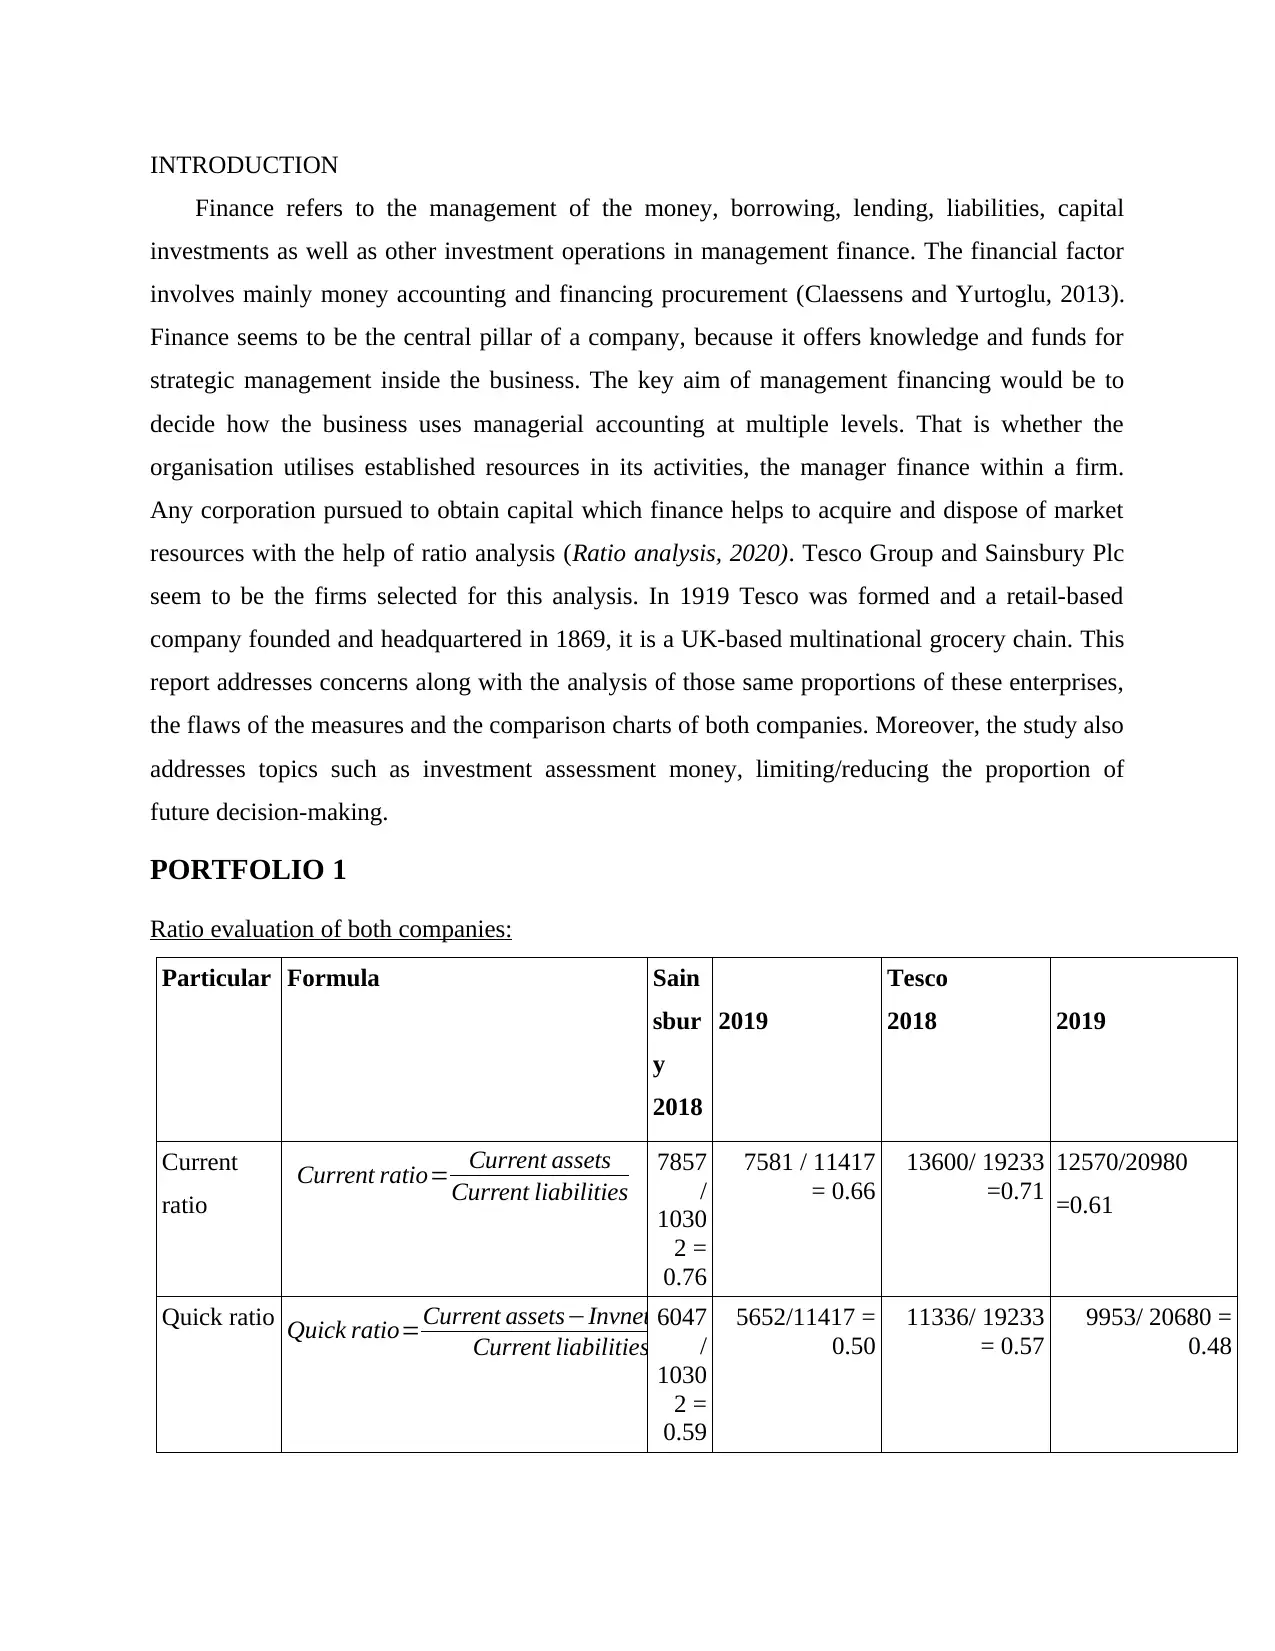
Ratio evaluation of both companies:
Particular Formula Sain
sbur
y
2018
2019
Tesco
2018 2019
Current
ratio
Current ratio= Current assets
Current liabilities
7857
/
1030
2 =
0.76
7581 / 11417
= 0.66
13600/ 19233
=0.71
12570/20980
=0.61
Quick ratio Quick ratio=Current assets−Invnetories
Current liabilities
6047
/
1030
2 =
0.59
5652/11417 =
0.50
11336/ 19233
= 0.57
9953/ 20680 =
0.48
Finance refers to the management of the money, borrowing, lending, liabilities, capital
investments as well as other investment operations in management finance. The financial factor
involves mainly money accounting and financing procurement (Claessens and Yurtoglu, 2013).
Finance seems to be the central pillar of a company, because it offers knowledge and funds for
strategic management inside the business. The key aim of management financing would be to
decide how the business uses managerial accounting at multiple levels. That is whether the
organisation utilises established resources in its activities, the manager finance within a firm.
Any corporation pursued to obtain capital which finance helps to acquire and dispose of market
resources with the help of ratio analysis (Ratio analysis, 2020). Tesco Group and Sainsbury Plc
seem to be the firms selected for this analysis. In 1919 Tesco was formed and a retail-based
company founded and headquartered in 1869, it is a UK-based multinational grocery chain. This
report addresses concerns along with the analysis of those same proportions of these enterprises,
the flaws of the measures and the comparison charts of both companies. Moreover, the study also
addresses topics such as investment assessment money, limiting/reducing the proportion of
future decision-making.
PORTFOLIO 1
Ratio evaluation of both companies:
Particular Formula Sain
sbur
y
2018
2019
Tesco
2018 2019
Current
ratio
Current ratio= Current assets
Current liabilities
7857
/
1030
2 =
0.76
7581 / 11417
= 0.66
13600/ 19233
=0.71
12570/20980
=0.61
Quick ratio Quick ratio=Current assets−Invnetories
Current liabilities
6047
/
1030
2 =
0.59
5652/11417 =
0.50
11336/ 19233
= 0.57
9953/ 20680 =
0.48
⊘ This is a preview!⊘
Do you want full access?
Subscribe today to unlock all pages.
Trusted by 1+ million students worldwide
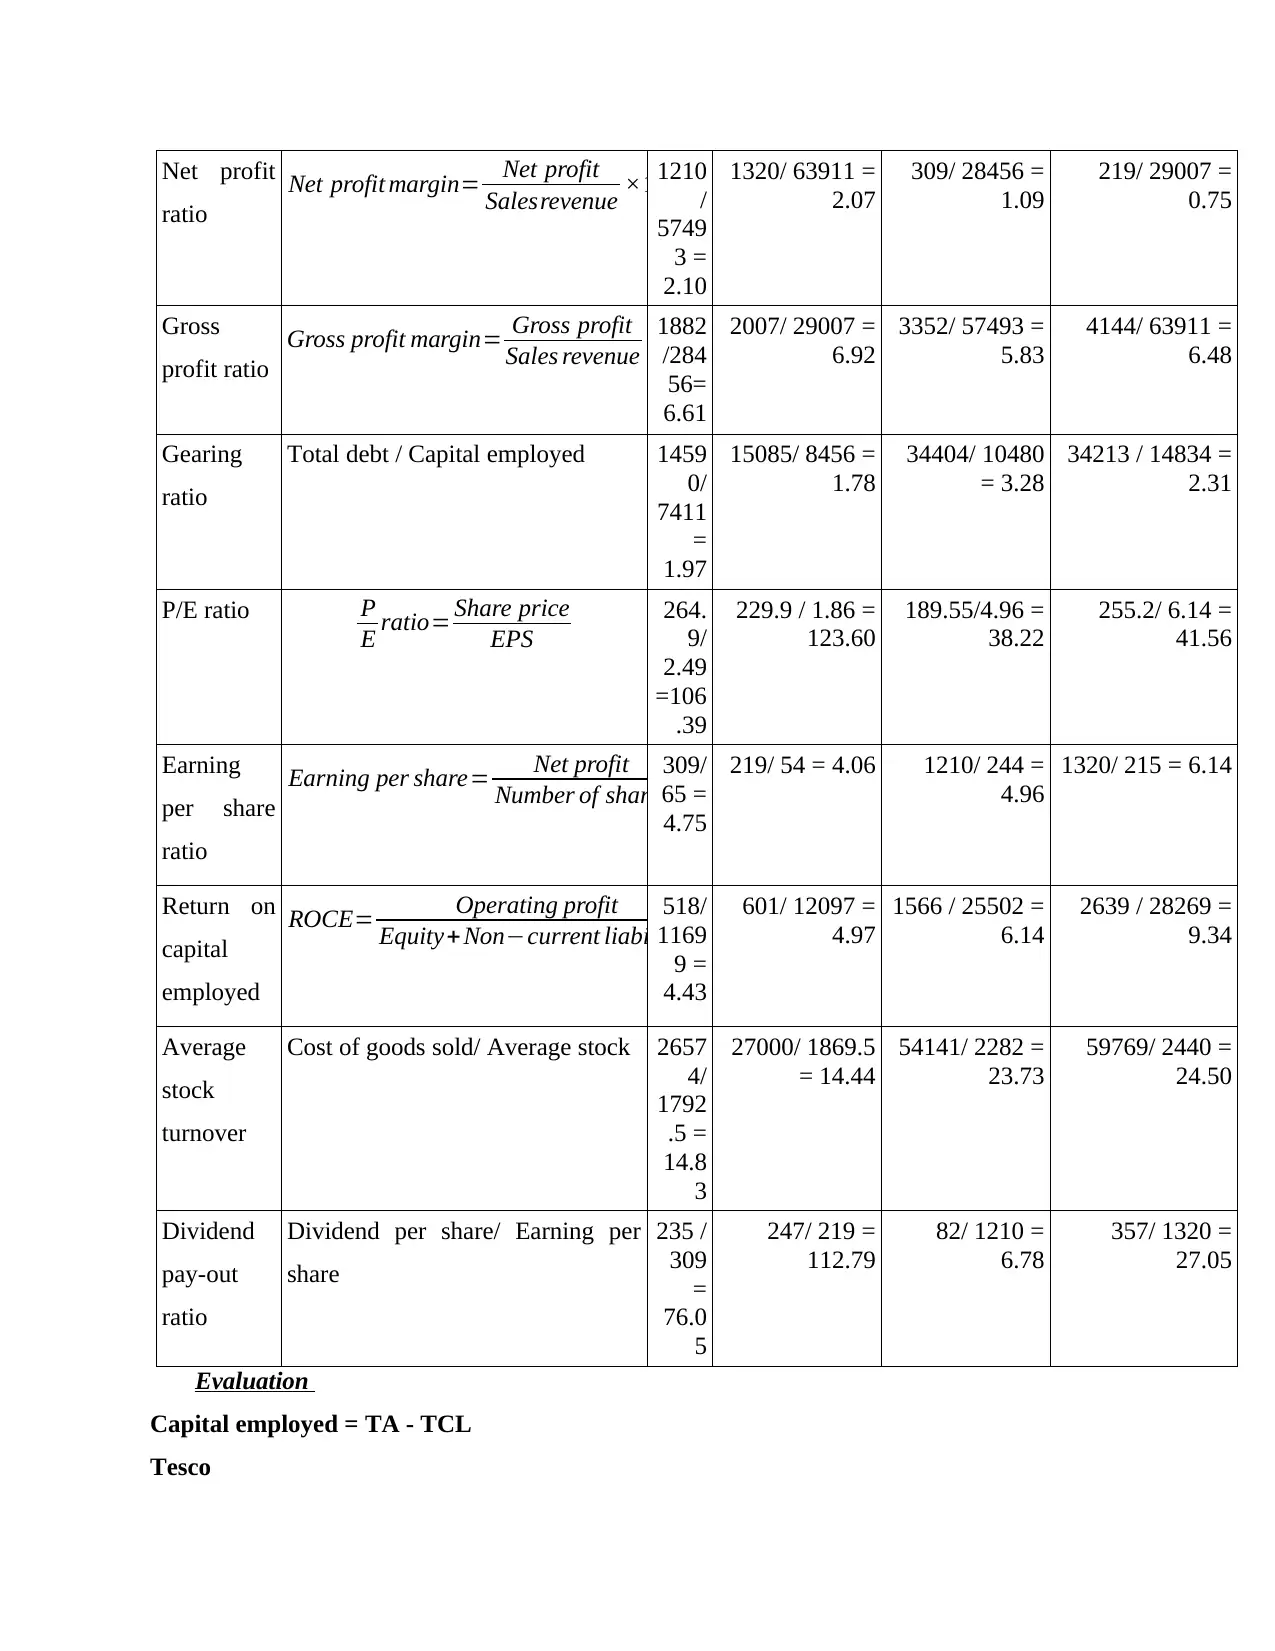
Net profit
ratio
Net profit margin= Net profit
Salesrevenue ×100
1210
/
5749
3 =
2.10
1320/ 63911 =
2.07
309/ 28456 =
1.09
219/ 29007 =
0.75
Gross
profit ratio
Gross profit margin= Gross profit
Sales revenue ×100
1882
/284
56=
6.61
2007/ 29007 =
6.92
3352/ 57493 =
5.83
4144/ 63911 =
6.48
Gearing
ratio
Total debt / Capital employed 1459
0/
7411
=
1.97
15085/ 8456 =
1.78
34404/ 10480
= 3.28
34213 / 14834 =
2.31
P/E ratio P
E ratio= Share price
EPS
264.
9/
2.49
=106
.39
229.9 / 1.86 =
123.60
189.55/4.96 =
38.22
255.2/ 6.14 =
41.56
Earning
per share
ratio
Earning per share= Net profit
Number of shares
309/
65 =
4.75
219/ 54 = 4.06 1210/ 244 =
4.96
1320/ 215 = 6.14
Return on
capital
employed
ROCE= Operating profit
Equity+ Non−current liabilities ×100
518/
1169
9 =
4.43
601/ 12097 =
4.97
1566 / 25502 =
6.14
2639 / 28269 =
9.34
Average
stock
turnover
Cost of goods sold/ Average stock 2657
4/
1792
.5 =
14.8
3
27000/ 1869.5
= 14.44
54141/ 2282 =
23.73
59769/ 2440 =
24.50
Dividend
pay-out
ratio
Dividend per share/ Earning per
share
235 /
309
=
76.0
5
247/ 219 =
112.79
82/ 1210 =
6.78
357/ 1320 =
27.05
Evaluation
Capital employed = TA - TCL
Tesco
ratio
Net profit margin= Net profit
Salesrevenue ×100
1210
/
5749
3 =
2.10
1320/ 63911 =
2.07
309/ 28456 =
1.09
219/ 29007 =
0.75
Gross
profit ratio
Gross profit margin= Gross profit
Sales revenue ×100
1882
/284
56=
6.61
2007/ 29007 =
6.92
3352/ 57493 =
5.83
4144/ 63911 =
6.48
Gearing
ratio
Total debt / Capital employed 1459
0/
7411
=
1.97
15085/ 8456 =
1.78
34404/ 10480
= 3.28
34213 / 14834 =
2.31
P/E ratio P
E ratio= Share price
EPS
264.
9/
2.49
=106
.39
229.9 / 1.86 =
123.60
189.55/4.96 =
38.22
255.2/ 6.14 =
41.56
Earning
per share
ratio
Earning per share= Net profit
Number of shares
309/
65 =
4.75
219/ 54 = 4.06 1210/ 244 =
4.96
1320/ 215 = 6.14
Return on
capital
employed
ROCE= Operating profit
Equity+ Non−current liabilities ×100
518/
1169
9 =
4.43
601/ 12097 =
4.97
1566 / 25502 =
6.14
2639 / 28269 =
9.34
Average
stock
turnover
Cost of goods sold/ Average stock 2657
4/
1792
.5 =
14.8
3
27000/ 1869.5
= 14.44
54141/ 2282 =
23.73
59769/ 2440 =
24.50
Dividend
pay-out
ratio
Dividend per share/ Earning per
share
235 /
309
=
76.0
5
247/ 219 =
112.79
82/ 1210 =
6.78
357/ 1320 =
27.05
Evaluation
Capital employed = TA - TCL
Tesco
Paraphrase This Document
Need a fresh take? Get an instant paraphrase of this document with our AI Paraphraser
2018 2019
44735 – 19233 = 25502 48949 – 20680 = 28269
Sainsbury
2018 2019
22001 – 10302 = 11699 23514 – 11417 = 12097
Analysis: The study of the proportion will reveal the importance of Tesco as well as Sainsbury's
sustainability situation, financial security and performance (Claessens, 2015). The table above
displays 2018 through 2019 annual ratios which will allow hep to classify the financial condition
of the firms for this time. In this respect, the report is a partial and systematic assessment of the
various ratios:
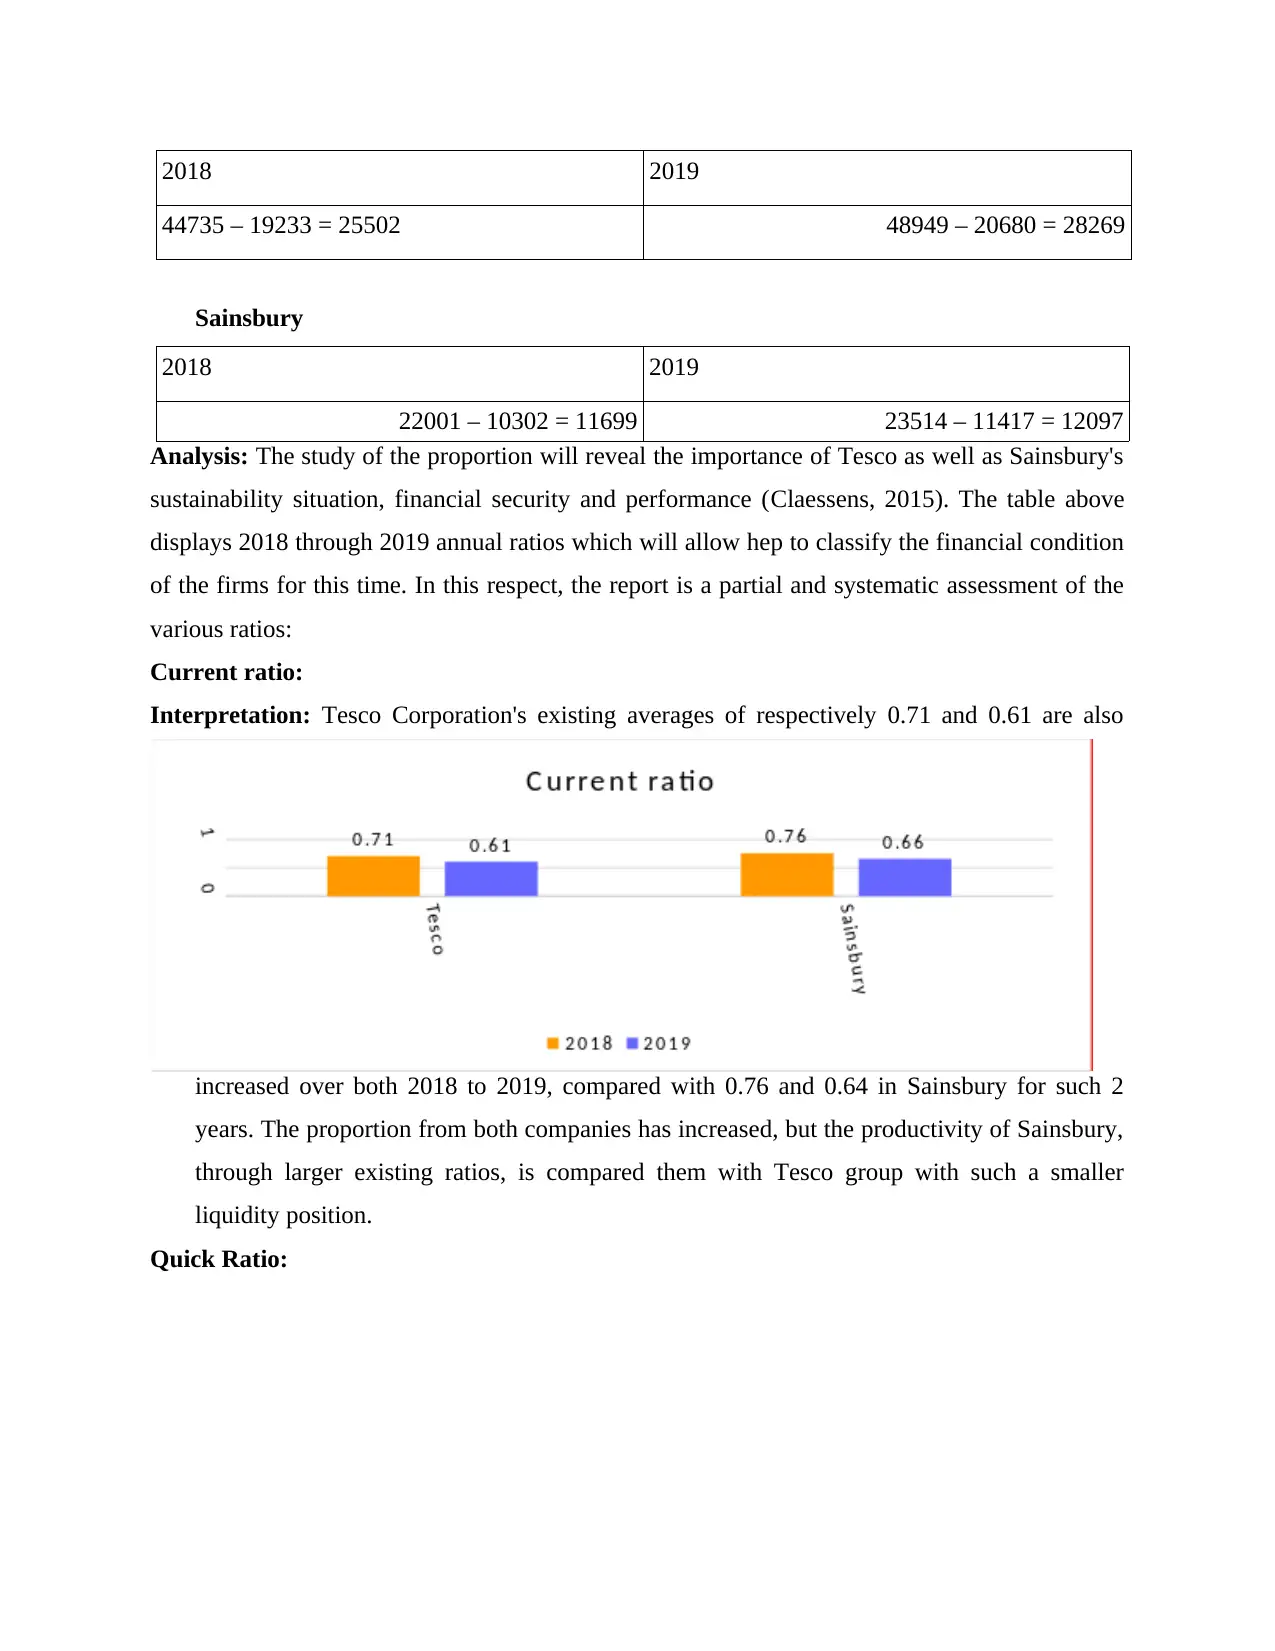
Current ratio:
Interpretation: Tesco Corporation's existing averages of respectively 0.71 and 0.61 are also
increased over both 2018 to 2019, compared with 0.76 and 0.64 in Sainsbury for such 2
years. The proportion from both companies has increased, but the productivity of Sainsbury,
through larger existing ratios, is compared them with Tesco group with such a smaller
liquidity position.
Quick Ratio:
44735 – 19233 = 25502 48949 – 20680 = 28269
Sainsbury
2018 2019
22001 – 10302 = 11699 23514 – 11417 = 12097
Analysis: The study of the proportion will reveal the importance of Tesco as well as Sainsbury's
sustainability situation, financial security and performance (Claessens, 2015). The table above
displays 2018 through 2019 annual ratios which will allow hep to classify the financial condition
of the firms for this time. In this respect, the report is a partial and systematic assessment of the
various ratios:
Current ratio:
Interpretation: Tesco Corporation's existing averages of respectively 0.71 and 0.61 are also
increased over both 2018 to 2019, compared with 0.76 and 0.64 in Sainsbury for such 2
years. The proportion from both companies has increased, but the productivity of Sainsbury,
through larger existing ratios, is compared them with Tesco group with such a smaller
liquidity position.
Quick Ratio:
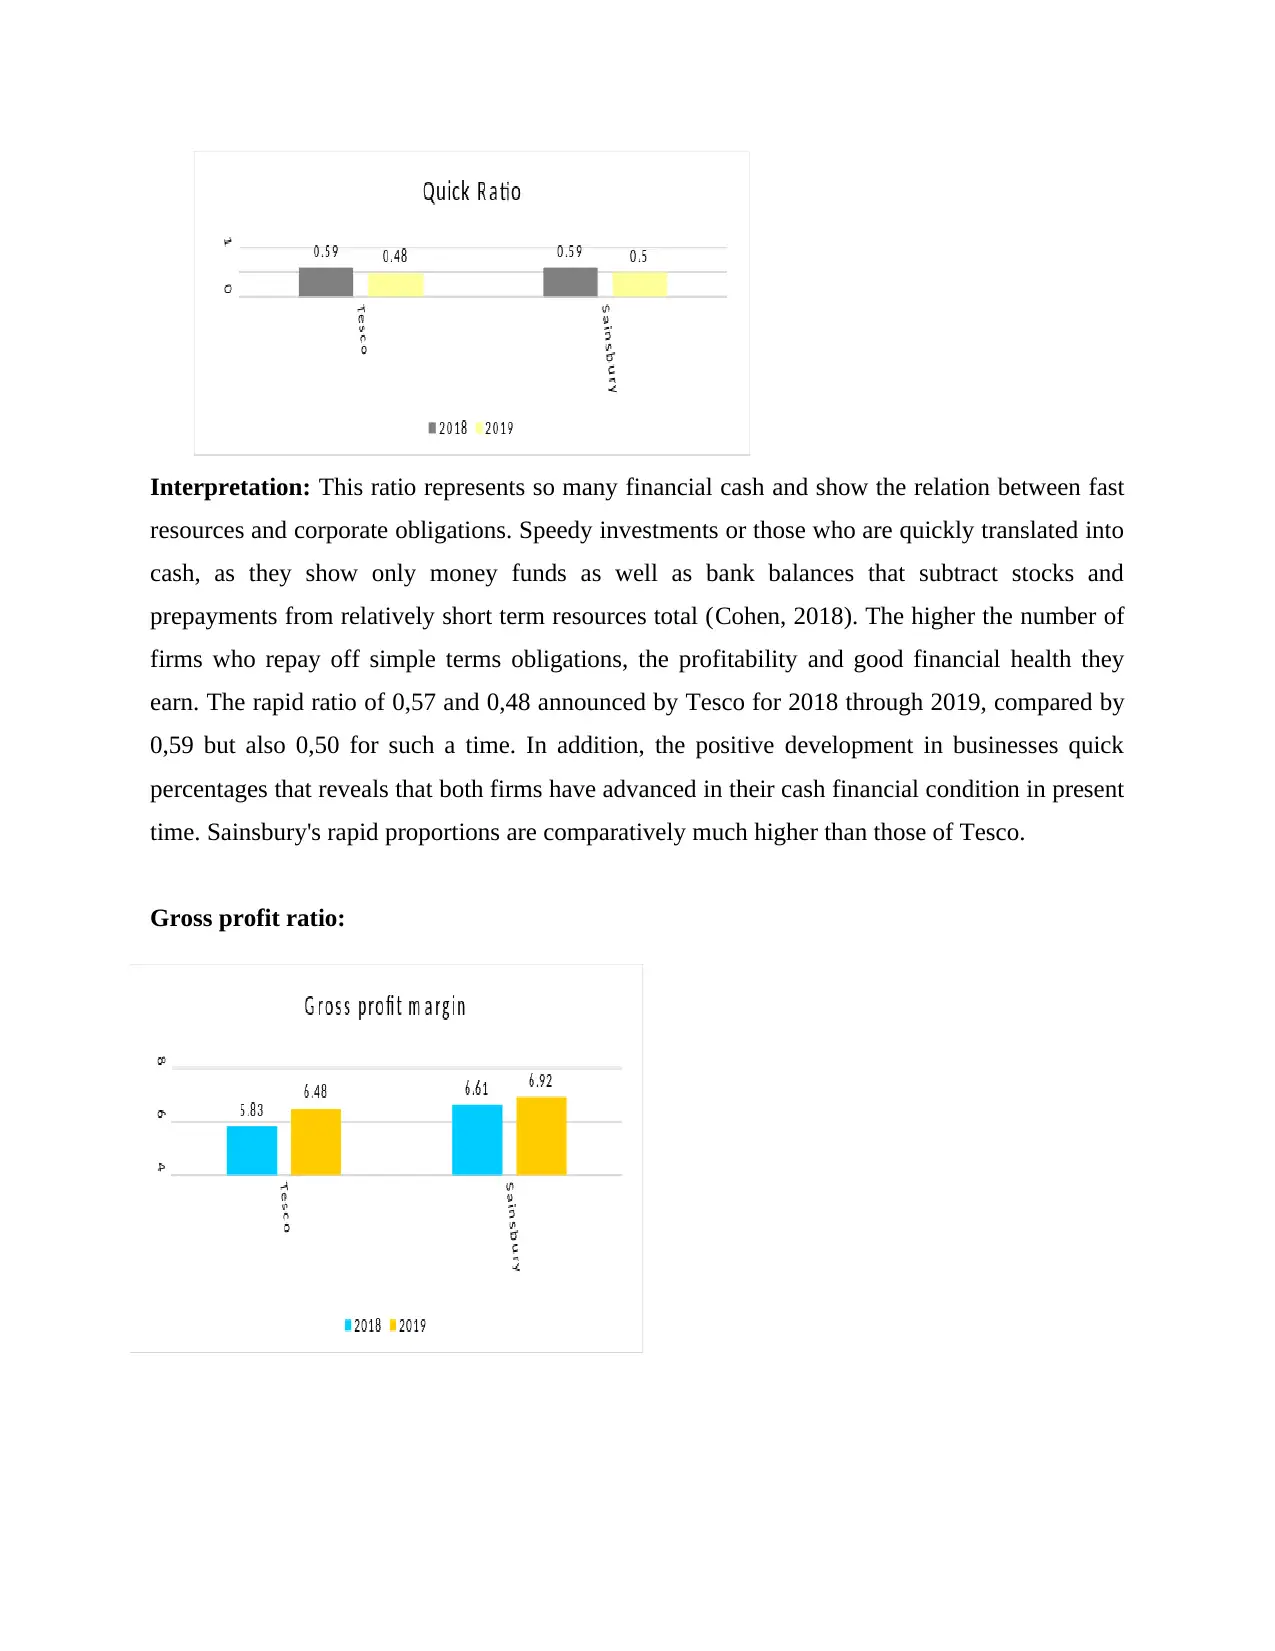
Interpretation: This ratio represents so many financial cash and show the relation between fast
resources and corporate obligations. Speedy investments or those who are quickly translated into
cash, as they show only money funds as well as bank balances that subtract stocks and
prepayments from relatively short term resources total (Cohen, 2018). The higher the number of
firms who repay off simple terms obligations, the profitability and good financial health they
earn. The rapid ratio of 0,57 and 0,48 announced by Tesco for 2018 through 2019, compared by
0,59 but also 0,50 for such a time. In addition, the positive development in businesses quick
percentages that reveals that both firms have advanced in their cash financial condition in present
time. Sainsbury's rapid proportions are comparatively much higher than those of Tesco.
Gross profit ratio:
⊘ This is a preview!⊘
Do you want full access?
Subscribe today to unlock all pages.
Trusted by 1+ million students worldwide
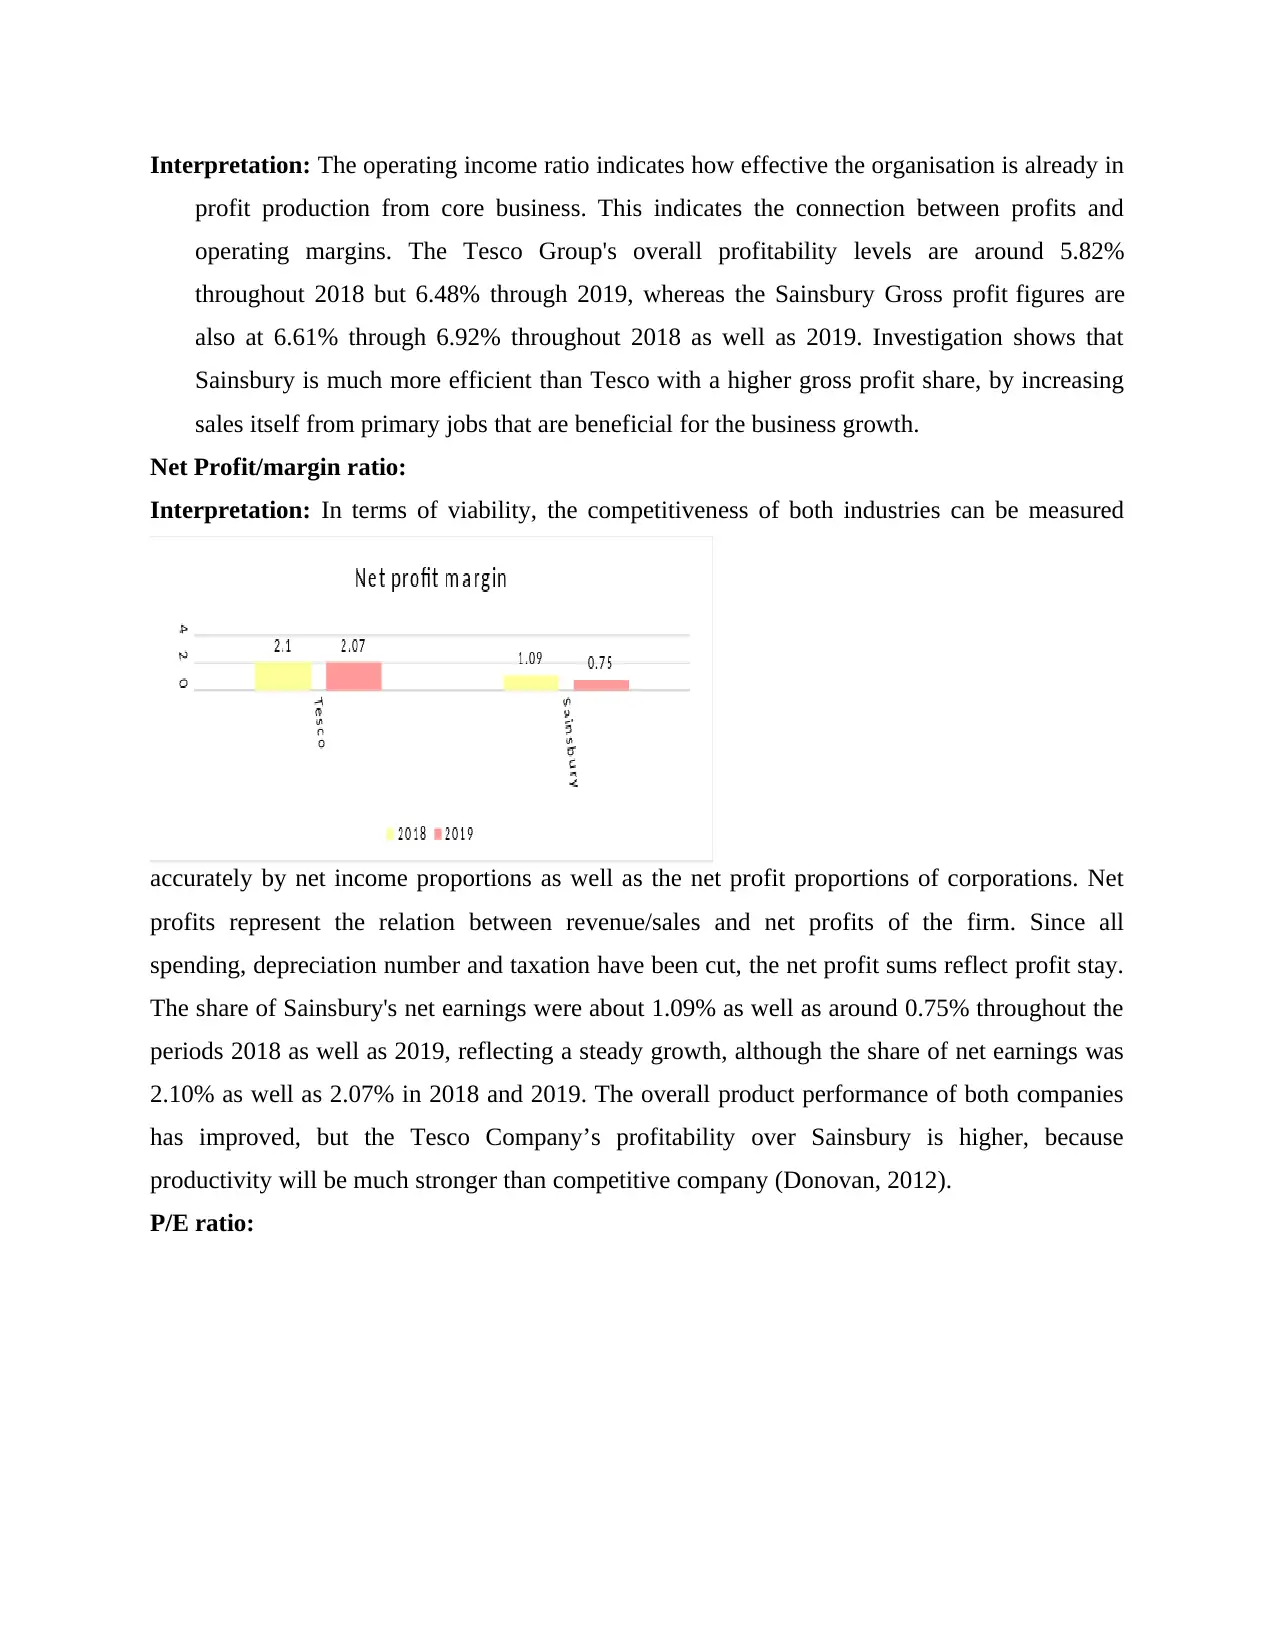
Interpretation: The operating income ratio indicates how effective the organisation is already in
profit production from core business. This indicates the connection between profits and
operating margins. The Tesco Group's overall profitability levels are around 5.82%
throughout 2018 but 6.48% through 2019, whereas the Sainsbury Gross profit figures are
also at 6.61% through 6.92% throughout 2018 as well as 2019. Investigation shows that
Sainsbury is much more efficient than Tesco with a higher gross profit share, by increasing
sales itself from primary jobs that are beneficial for the business growth.
Net Profit/margin ratio:
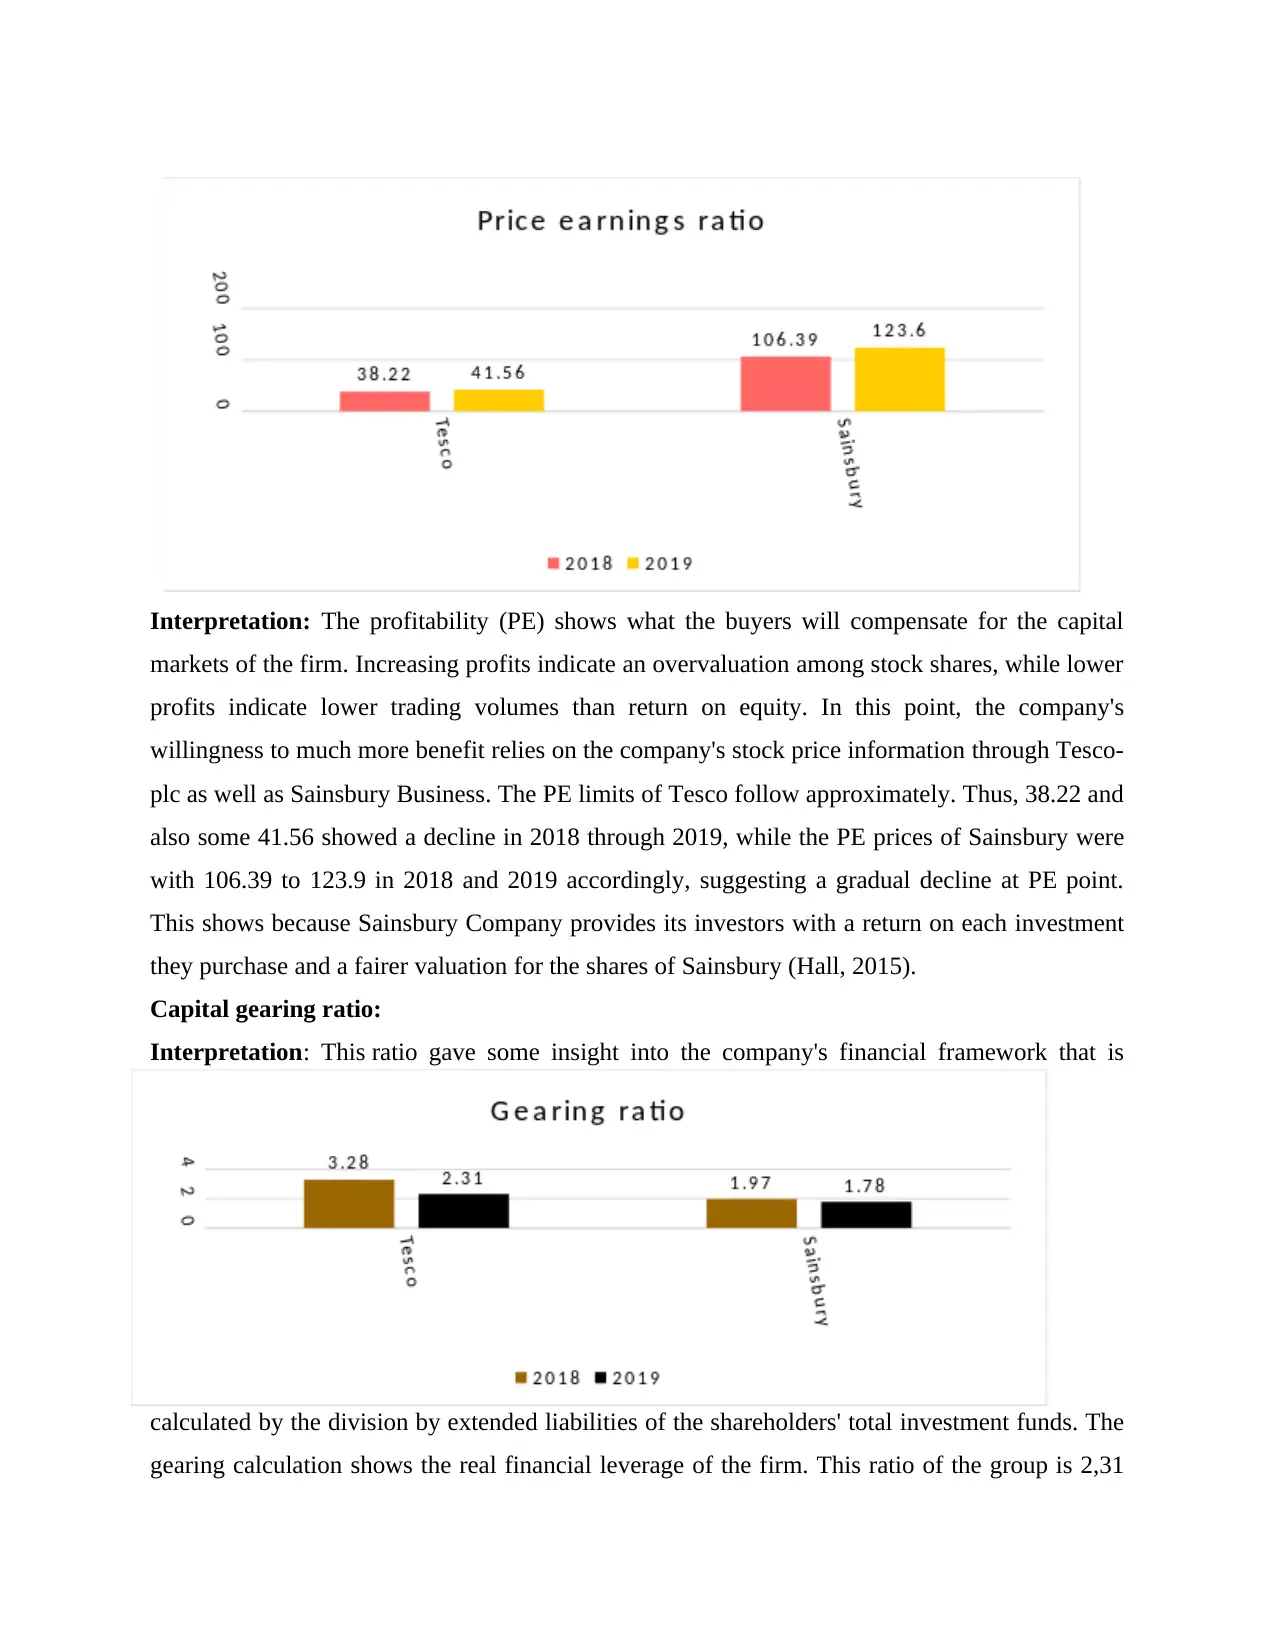
Interpretation: In terms of viability, the competitiveness of both industries can be measured
accurately by net income proportions as well as the net profit proportions of corporations. Net
profits represent the relation between revenue/sales and net profits of the firm. Since all
spending, depreciation number and taxation have been cut, the net profit sums reflect profit stay.
The share of Sainsbury's net earnings were about 1.09% as well as around 0.75% throughout the
periods 2018 as well as 2019, reflecting a steady growth, although the share of net earnings was
2.10% as well as 2.07% in 2018 and 2019. The overall product performance of both companies
has improved, but the Tesco Company’s profitability over Sainsbury is higher, because
productivity will be much stronger than competitive company (Donovan, 2012).
P/E ratio:
profit production from core business. This indicates the connection between profits and
operating margins. The Tesco Group's overall profitability levels are around 5.82%
throughout 2018 but 6.48% through 2019, whereas the Sainsbury Gross profit figures are
also at 6.61% through 6.92% throughout 2018 as well as 2019. Investigation shows that
Sainsbury is much more efficient than Tesco with a higher gross profit share, by increasing
sales itself from primary jobs that are beneficial for the business growth.
Net Profit/margin ratio:
Interpretation: In terms of viability, the competitiveness of both industries can be measured
accurately by net income proportions as well as the net profit proportions of corporations. Net
profits represent the relation between revenue/sales and net profits of the firm. Since all
spending, depreciation number and taxation have been cut, the net profit sums reflect profit stay.
The share of Sainsbury's net earnings were about 1.09% as well as around 0.75% throughout the
periods 2018 as well as 2019, reflecting a steady growth, although the share of net earnings was
2.10% as well as 2.07% in 2018 and 2019. The overall product performance of both companies
has improved, but the Tesco Company’s profitability over Sainsbury is higher, because
productivity will be much stronger than competitive company (Donovan, 2012).
P/E ratio:
Paraphrase This Document
Need a fresh take? Get an instant paraphrase of this document with our AI Paraphraser
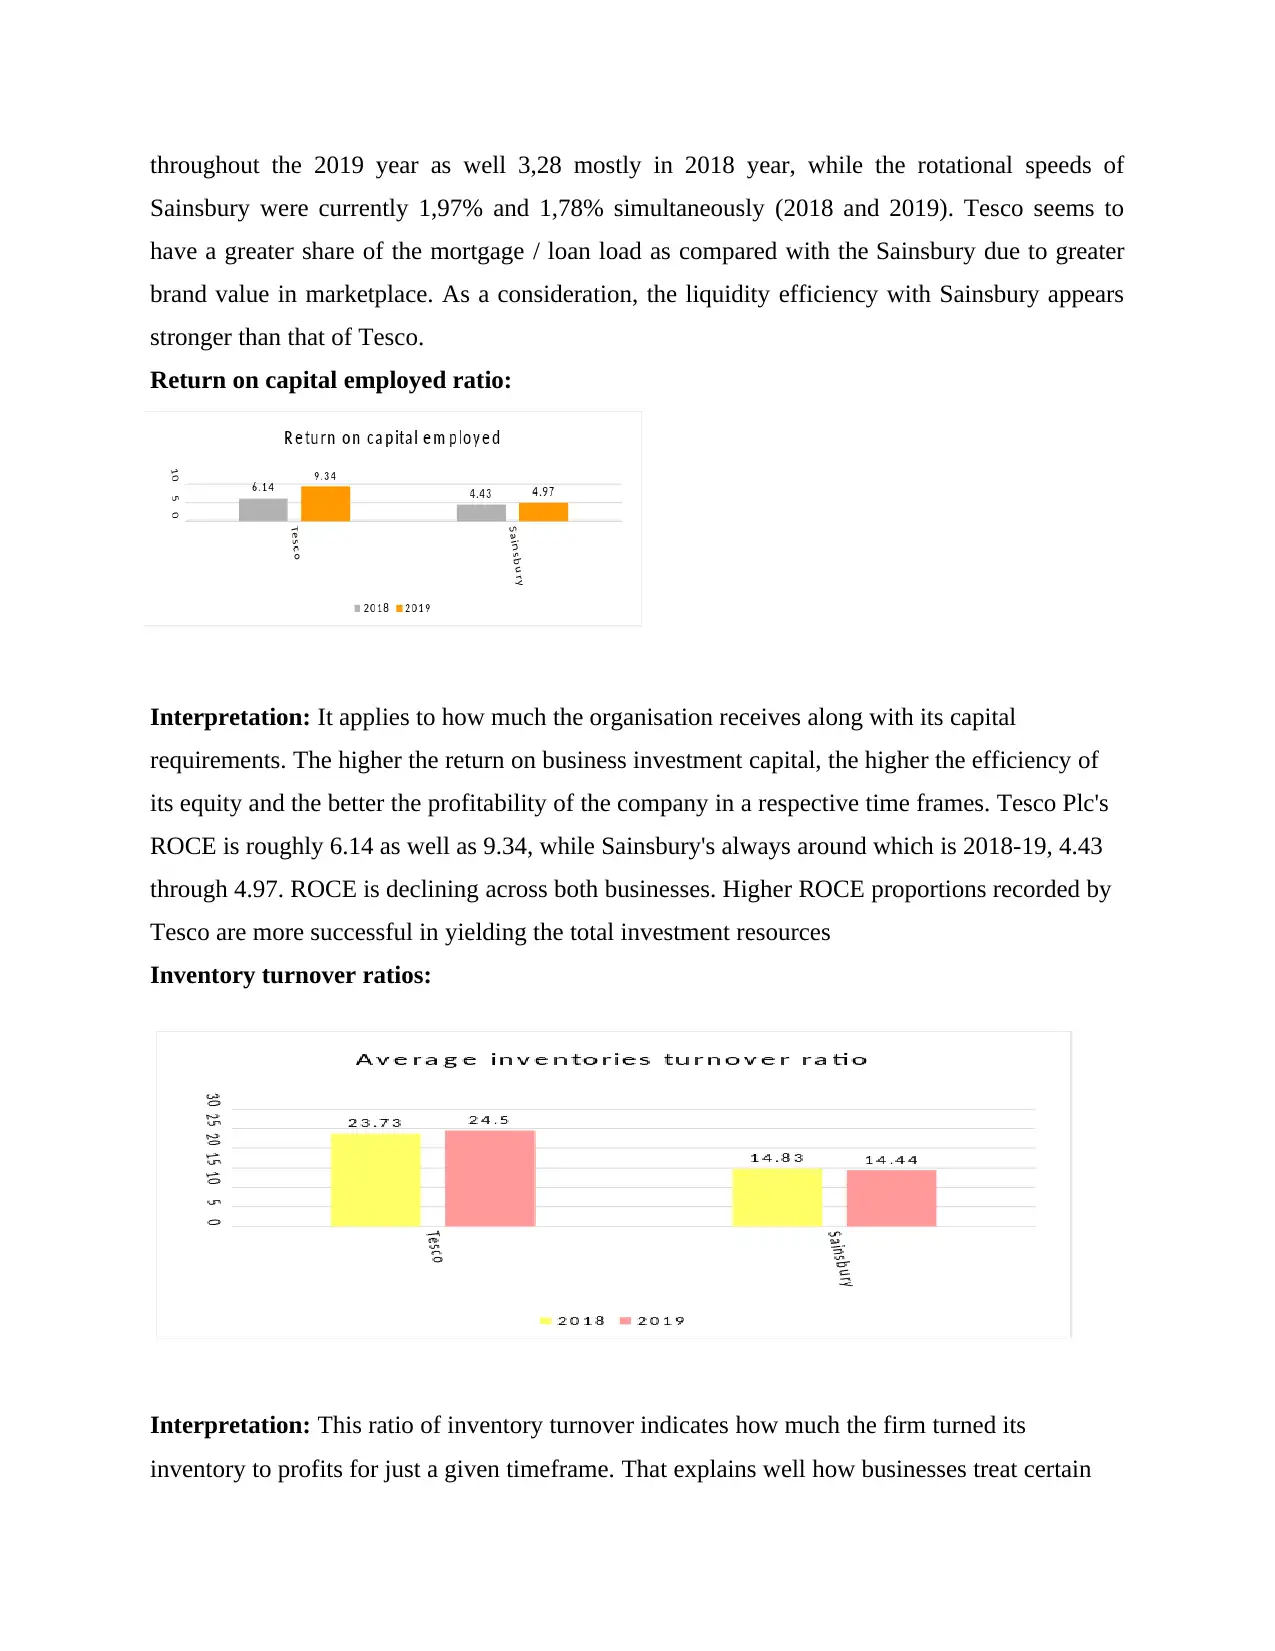
Interpretation: The profitability (PE) shows what the buyers will compensate for the capital
markets of the firm. Increasing profits indicate an overvaluation among stock shares, while lower
profits indicate lower trading volumes than return on equity. In this point, the company's
willingness to much more benefit relies on the company's stock price information through Tesco-
plc as well as Sainsbury Business. The PE limits of Tesco follow approximately. Thus, 38.22 and
also some 41.56 showed a decline in 2018 through 2019, while the PE prices of Sainsbury were
with 106.39 to 123.9 in 2018 and 2019 accordingly, suggesting a gradual decline at PE point.
This shows because Sainsbury Company provides its investors with a return on each investment
they purchase and a fairer valuation for the shares of Sainsbury (Hall, 2015).
Capital gearing ratio:
Interpretation: This ratio gave some insight into the company's financial framework that is
calculated by the division by extended liabilities of the shareholders' total investment funds. The
gearing calculation shows the real financial leverage of the firm. This ratio of the group is 2,31
throughout the 2019 year as well 3,28 mostly in 2018 year, while the rotational speeds of
Sainsbury were currently 1,97% and 1,78% simultaneously (2018 and 2019). Tesco seems to
have a greater share of the mortgage / loan load as compared with the Sainsbury due to greater
brand value in marketplace. As a consideration, the liquidity efficiency with Sainsbury appears
stronger than that of Tesco.
Return on capital employed ratio:
Interpretation: It applies to how much the organisation receives along with its capital
requirements. The higher the return on business investment capital, the higher the efficiency of
its equity and the better the profitability of the company in a respective time frames. Tesco Plc's
ROCE is roughly 6.14 as well as 9.34, while Sainsbury's always around which is 2018-19, 4.43
through 4.97. ROCE is declining across both businesses. Higher ROCE proportions recorded by
Tesco are more successful in yielding the total investment resources
Inventory turnover ratios:
Interpretation: This ratio of inventory turnover indicates how much the firm turned its
inventory to profits for just a given timeframe. That explains well how businesses treat certain
⊘ This is a preview!⊘
Do you want full access?
Subscribe today to unlock all pages.
Trusted by 1+ million students worldwide
stock products. What does it say? Tesco's percentage is roughly. The Sainsbury company is
14.83(2018) as well as 14.44 respectively 23.73(2018) but mostly 24.50 (2019). (2019). This
ensures that it really is easier (faster) for Sainsbury to convert its inventory levels into
profitability than for Tesco. Although that Tesco-plc company proportion has declined in 2019, it
points out that the company has dramatically increased its ability to translate its inventory levels
into profitability.
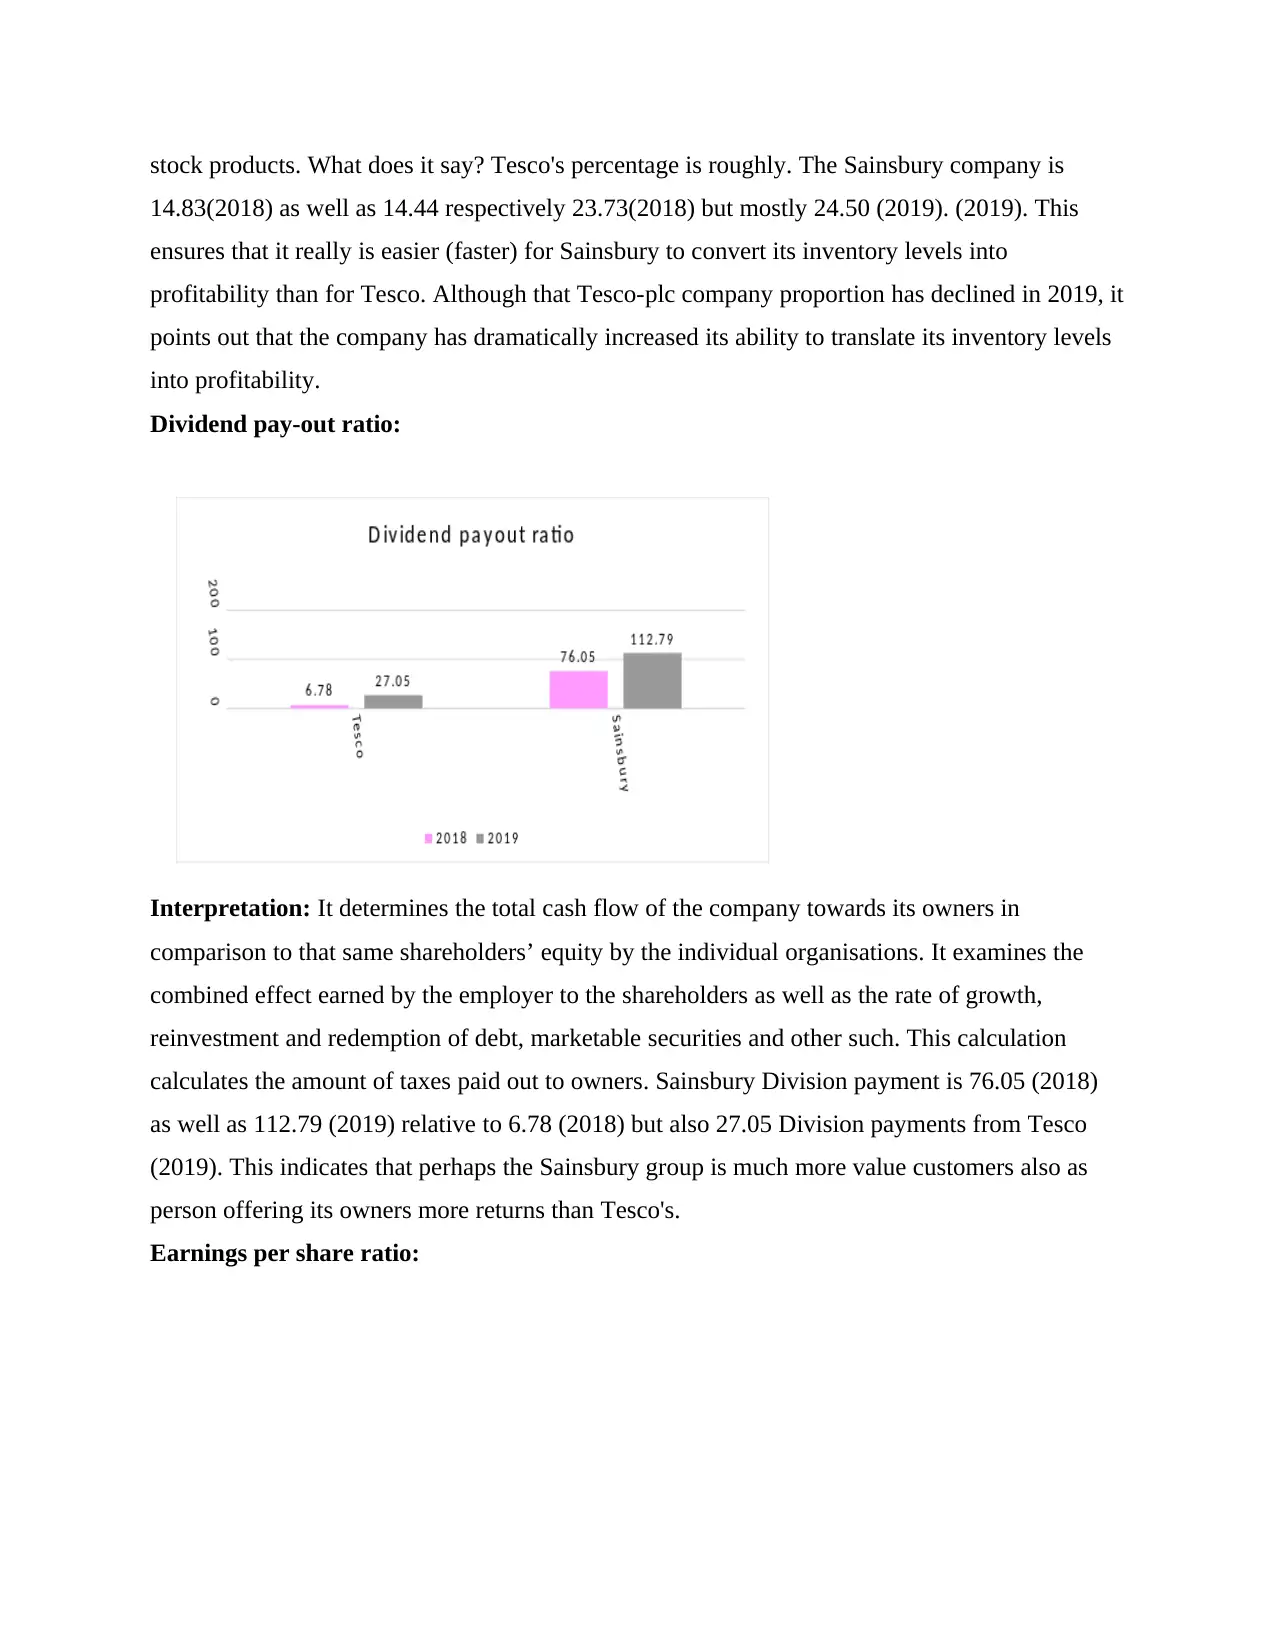
Dividend pay-out ratio:
Interpretation: It determines the total cash flow of the company towards its owners in
comparison to that same shareholders’ equity by the individual organisations. It examines the
combined effect earned by the employer to the shareholders as well as the rate of growth,
reinvestment and redemption of debt, marketable securities and other such. This calculation
calculates the amount of taxes paid out to owners. Sainsbury Division payment is 76.05 (2018)
as well as 112.79 (2019) relative to 6.78 (2018) but also 27.05 Division payments from Tesco
(2019). This indicates that perhaps the Sainsbury group is much more value customers also as
person offering its owners more returns than Tesco's.
Earnings per share ratio:
14.83(2018) as well as 14.44 respectively 23.73(2018) but mostly 24.50 (2019). (2019). This
ensures that it really is easier (faster) for Sainsbury to convert its inventory levels into
profitability than for Tesco. Although that Tesco-plc company proportion has declined in 2019, it
points out that the company has dramatically increased its ability to translate its inventory levels
into profitability.
Dividend pay-out ratio:
Interpretation: It determines the total cash flow of the company towards its owners in
comparison to that same shareholders’ equity by the individual organisations. It examines the
combined effect earned by the employer to the shareholders as well as the rate of growth,
reinvestment and redemption of debt, marketable securities and other such. This calculation
calculates the amount of taxes paid out to owners. Sainsbury Division payment is 76.05 (2018)
as well as 112.79 (2019) relative to 6.78 (2018) but also 27.05 Division payments from Tesco
(2019). This indicates that perhaps the Sainsbury group is much more value customers also as
person offering its owners more returns than Tesco's.
Earnings per share ratio:
Paraphrase This Document
Need a fresh take? Get an instant paraphrase of this document with our AI Paraphraser
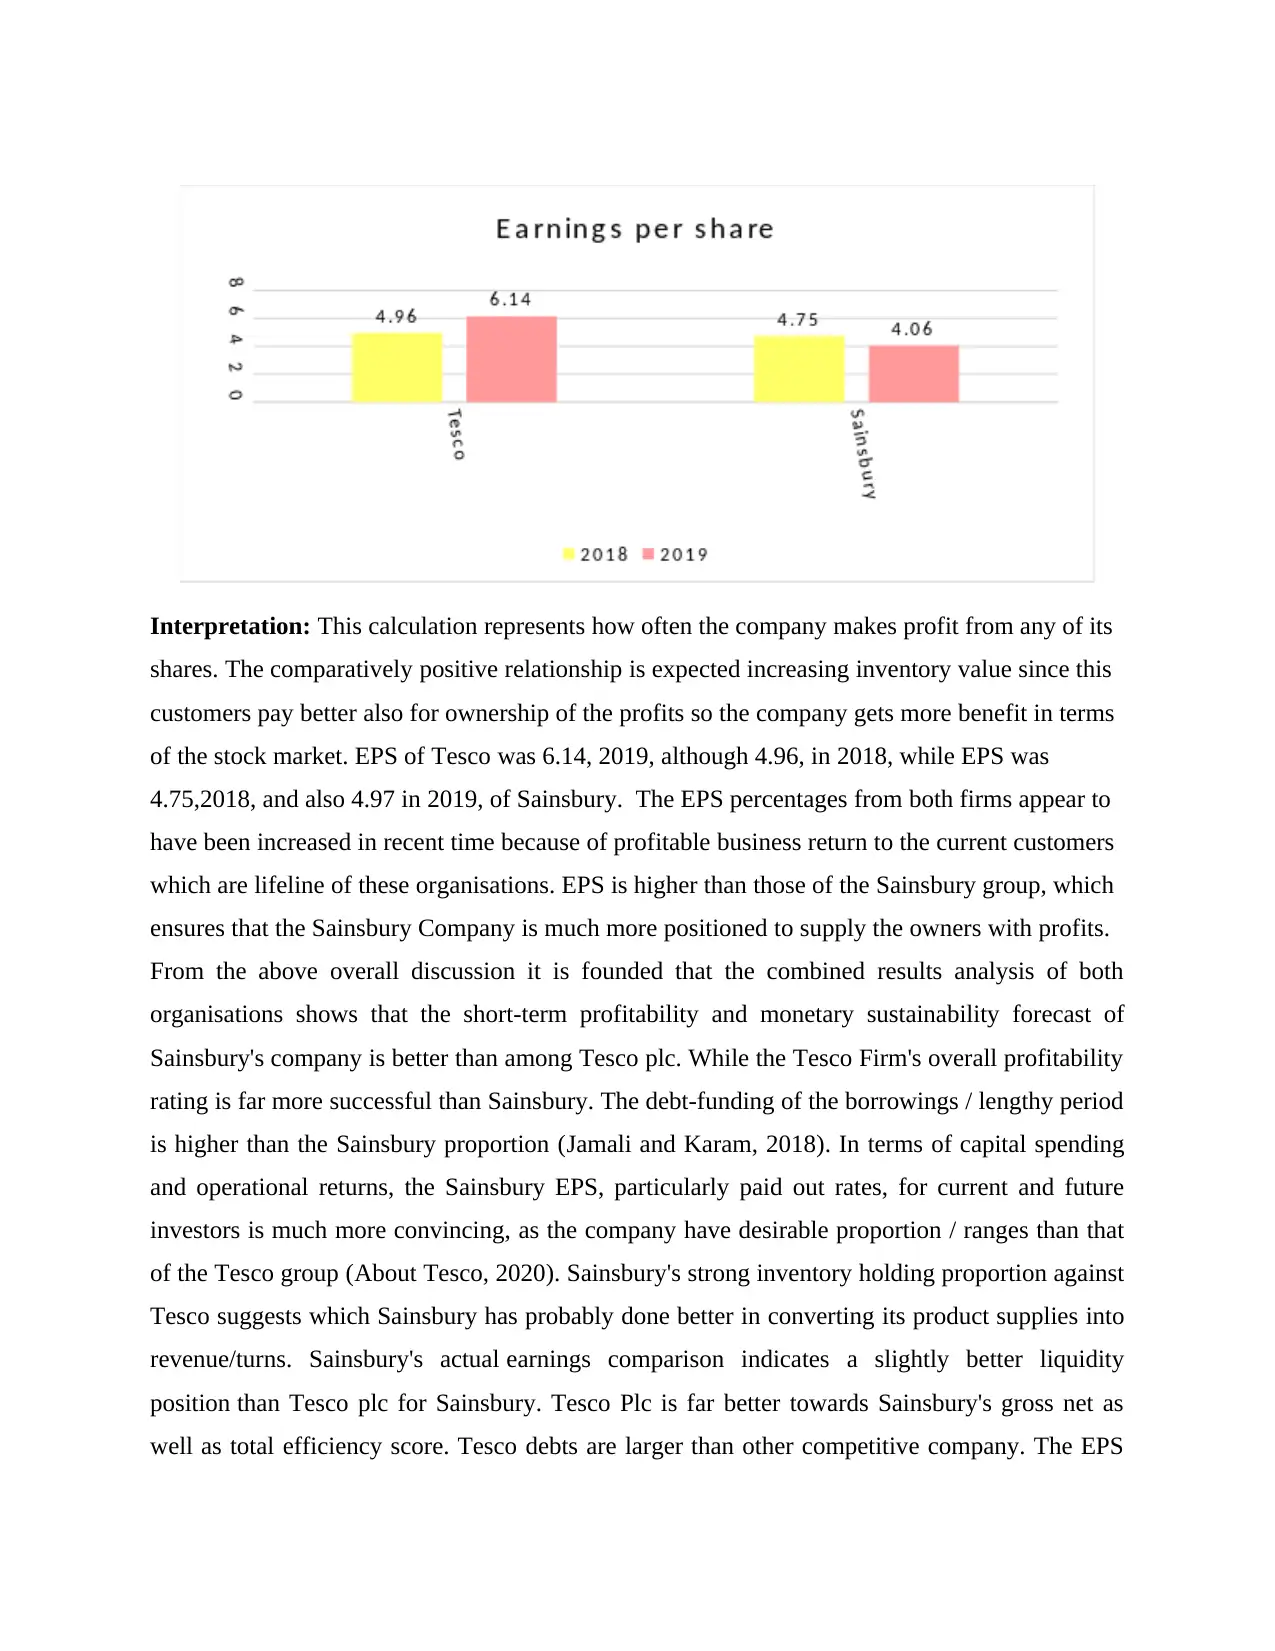
Interpretation: This calculation represents how often the company makes profit from any of its
shares. The comparatively positive relationship is expected increasing inventory value since this
customers pay better also for ownership of the profits so the company gets more benefit in terms
of the stock market. EPS of Tesco was 6.14, 2019, although 4.96, in 2018, while EPS was
4.75,2018, and also 4.97 in 2019, of Sainsbury. The EPS percentages from both firms appear to
have been increased in recent time because of profitable business return to the current customers
which are lifeline of these organisations. EPS is higher than those of the Sainsbury group, which
ensures that the Sainsbury Company is much more positioned to supply the owners with profits.
From the above overall discussion it is founded that the combined results analysis of both
organisations shows that the short-term profitability and monetary sustainability forecast of
Sainsbury's company is better than among Tesco plc. While the Tesco Firm's overall profitability
rating is far more successful than Sainsbury. The debt-funding of the borrowings / lengthy period
is higher than the Sainsbury proportion (Jamali and Karam, 2018). In terms of capital spending
and operational returns, the Sainsbury EPS, particularly paid out rates, for current and future
investors is much more convincing, as the company have desirable proportion / ranges than that
of the Tesco group (About Tesco, 2020). Sainsbury's strong inventory holding proportion against
Tesco suggests which Sainsbury has probably done better in converting its product supplies into
revenue/turns. Sainsbury's actual earnings comparison indicates a slightly better liquidity
position than Tesco plc for Sainsbury. Tesco Plc is far better towards Sainsbury's gross net as
well as total efficiency score. Tesco debts are larger than other competitive company. The EPS
as well as the Business rewards are perhaps more attractive and efficient from the standpoint of
the consumer for the present production of the stock market for the customer/shareholder when
the business has much more appropriate measurements than Tesco Plc. Sainsbury's perfect
average storage times equate Tesco and saw Sainsbury's superior performance.
Recommendations:
Sainsbury Plc: The key issue for businesses that influenced about their Return on equity ( roe
and EPS proportions is to reduce net efficiency such that company is mainly advises to decrease
its overall financial expenses and increase profitability through innovative advertising plans and
strategies (About Sainsbury, 2020) Terms and conditions, discounts, promotions and rewards to
draw more consumers should be offered for this business. For the organisation to focus solely on
its high levels of efficiency including net profitability, it is mainly vital. The organisation should
optimize its ultimate business taxes and concentrate its energies on rising sales through effective
advertising and marketing strategies.
Tesco Plc: Initially, as the business ratio is relatively low, the Business should develop attempts
to increase the shareholders equity balance. The new payable must be reprogrammed for this
business and based on the handling of job resources. In addition, in contrast with Marks and
spencer, Sainsbury and all other supermarket companies poor gross margin for the Group
suggests that such main sales activities be improved and running expenses lowered to a higher
degree of gross productivity. In order to achieve improved principles concerning requirements,
Tesco is most advised that reliance on long term loans be minimised. In addition, the total
current assets ratio for Tesco is higher, and it is therefore recommend to the organisation that it
concentrate on the production process (Kaygusuz, 2012).
Restrictions for consuming ratio breakdown for determining firms financial status.
1. Historical: The results of documentary evidence are used to validate all data/figures.
Throughout the meantime, it is just not important to obtain the very same results. Mostly
in long term, information will be changed.
2. Past and Actual Costs: information through financial statements obtained at present costs,
whereas information may be listed at fair values on the financial statements.
3. Inflation: the annual inflation will be not equal and over period whether it was moved
over even a length of time. For eg, with an inflation rate of 100 percent annually, sales
tend to only have increased in future years.
⊘ This is a preview!⊘
Do you want full access?
Subscribe today to unlock all pages.
Trusted by 1+ million students worldwide
1 out of 18
Related Documents


Your All-in-One AI-Powered Toolkit for Academic Success.
+13062052269
info@desklib.com
Available 24*7 on WhatsApp / Email
![[object Object]](/_next/static/media/star-bottom.7253800d.svg)
Unlock your academic potential
Copyright © 2020–2025 A2Z Services. All Rights Reserved. Developed and managed by ZUCOL.