A Comparative Financial Performance Analysis: Tesco vs. Sainsbury
VerifiedAdded on 2019/12/04
|37
|5827
|29
Report
AI Summary
This report presents a comparative analysis of the financial and business performance of Tesco and Sainsbury, two leading retail organizations in the UK. The study employs a positivism philosophy and a deductive approach, utilizing both primary and secondary data sources, with a focus on quantitative data analysis techniques, particularly ratio analysis. The research investigates the financial health of both companies over a five-year period, examining key metrics such as profitability, liquidity, efficiency, and solvency. The findings indicate that Sainsbury demonstrates superior financial and business performance compared to Tesco. The report includes an executive summary, abstract, table of contents, introduction, background of research, research methodology, data collection and presentation, analysis and discussion, conclusion and recommendation, a reflective statement, and references. The report highlights the significance of financial performance to stakeholders, the use of ratio analysis, and the limitations of such analysis. Based on the findings, the report recommends corrective measures for Tesco to improve its sales and profitability. The report is a valuable resource for academics, researchers, investors, and the management of both companies, providing insights into the retail industry and the application of financial analysis techniques.
''An analysis and evaluation of the business and financial performance of
Tesco as compared to Sainsbury ''
Tesco as compared to Sainsbury ''
Paraphrase This Document
Need a fresh take? Get an instant paraphrase of this document with our AI Paraphraser
Executive summary
The competition among businesses in retail sector has become so intense that it is not
easy for firms to attract more customers and retain their old ones. For this purpose, it is required
by organizations to analyze, evaluate their financial and business performance at regular
intervals. In the present dissertation comparison between the financial performance of Tesco and
Sainsbury has been carried out.
It can be stated that positivism philosophy and deductive approach is used to carry out
research on the above mentioned topic. The information has been collected from both primary
and secondary sources. Furthermore, quantitative technique of data analysis is used to carry out
evaluation of information collected.
The results of study highlight that the financial and business performance of Sainsbury is
very good as compared to Tesco. Along with this, it can be recommended that the company is
required to take corrective measure for improving sales and profits.
Acknowledgment
I would like to thank my supervisor who has helped in throughout competing this
dissertation. The continuous support from my guide and his/ her efforts helped me in learning,
overwhelming immense knowledge and motivated me. I would also like to thank my family and
friends for their support and faint in me.
⊘ This is a preview!⊘
Do you want full access?
Subscribe today to unlock all pages.
Trusted by 1+ million students worldwide
ABSTRACT
The measurement of financial performance of business gives a deeper insight into the use
of financial resources by business. The UK retail industry is highly growing and attractive
sector, therefore, investors are willing to invest in retailing organization. The study aims to make
a comparative analysis into the business as well as financial performance of Tesco and
Sainsbury, both are leading retail organization in the UK. A quantitative approach is selected for
the investigation to which a positivism philosophy is adopted. The data for the present study
have been collected from secondary sources including books, journals, articles, research papers
and online stuffs. To assess the financial performance of Tesco and Sainsbury, annual reports
prepared by the both the companies for last 5 years are used to gather financial information.
Ratio analysis is used to carry out the accurate financial analysis in which Sainsbury is found
more efficient as compared to Tesco in terms of financial performance.
Paraphrase This Document
Need a fresh take? Get an instant paraphrase of this document with our AI Paraphraser
Table of Contents
Acknowledgment.............................................................................................................................3
ABSTRACT.....................................................................................................................................4
Table of Contents...........................................................................................................................5
INTRODUCTION...........................................................................................................................1
Main Body.......................................................................................................................................1
1.1 Background............................................................................................................................1
1.2 Rationale of investigation......................................................................................................1
1.3 Significance of the proposed research study..........................................................................1
BACKGROUND OF RESEARCH.................................................................................................3
2.1 Introduction............................................................................................................................3
2.2 Significance of the business and financial performance to the stakeholders.........................3
2.3 Ratio Analysis and significance.............................................................................................4
2.4 Classification of the ratios.....................................................................................................4
2.5 Limitations of the ratio analysis.............................................................................................5
Aims and objectives.........................................................................................................................6
RESEARCH METHODOLOGY.....................................................................................................7
3.1 Research philosophy..............................................................................................................7
3.2 Research approach.................................................................................................................7
3.3 Research design.....................................................................................................................7
3.4 Data collection.......................................................................................................................8
3.5 Data Analysis.........................................................................................................................8
3.6 Ethical and accessibility issues..............................................................................................8
DATA COLLECTION AND PRESENTATION............................................................................9
ANALYSIS AND DISCUSSION...................................................................................................9
CONCLUSION AND RECOMMENDATION.............................................................................16
REFLECTIVE STATEMENT.......................................................................................................19
REFERENCES..............................................................................................................................20
Appendix 1.....................................................................................................................................22
Appendix 2.....................................................................................................................................23
⊘ This is a preview!⊘
Do you want full access?
Subscribe today to unlock all pages.
Trusted by 1+ million students worldwide
INTRODUCTION
Main Body
1.1 Background
Financial performance is denoted as a subjective measure of how an organizations is
using or can use assets to generate revenues as well as profitability (Rao, 2011.). The retail
industry of the United Kingdom has become competitive in terms of sales performance and profit
generation, however, it becomes important to compare the financial performance to assess the
effectiveness of retail in firms in generating revenues and profits (UK Retail Stats and Facts,
2016). The dissertation herewith aims at comparing the financial performance of two leading
retail organization of the UK named as Tesco and Sainsbury. Through this investigation, a
deeper insight to the existing financial position of both the firms have been quoted.
1.2 Rationale of investigation
The UK retail industry is highly growing and attractive sector, therefore, investors are
willing to invest in retailing organization. Tesco and Sainsbury Plc. both have gained a
significant market image however, a huge competition is witnessed in terms of improved
business practices and financial performance (UK Retail Stats and Facts, 2016). From the
investor’s point of view, financial strong company is a sources from where better returns can be
raised. Sainsbury Plc. is a the major competitor of Tesco , however, the questions is that which
firm is financially strong , hence, the study will attempts to make an analysis and evaluation
into business and financial performance of Tesco and Sainsbury. The rationale behind present
investigation is to analysis the financial information of both the companies so that various
decision makers can be assist with effective insights in financial health to facilitate effective
decision making.
1.3 Significance of the proposed research study
The herewith investigation is significant for retailing industry, academicians, researchers
as well as the management of both Tesco and Sainsbury. The academicians are going to get
insights into the use of ratio analysis and its interpretations. The investigation is going to analysis
1
Paraphrase This Document
Need a fresh take? Get an instant paraphrase of this document with our AI Paraphraser
the financial position of Tesco and Sainsbury in last 5 year (2011-2015) which have hardly done
in previous studies. The information pertaining to financial performance of retail sectors will
allow researchers to identify the significance of ratio analysis and financial performance
companies in retail industry. In addition to that, investors and shareholder are going to be
assisted with effective decision on investments and the findings of this study will provide
assistance to them in making effective decisions. The comparison of the financial performance of
Tesco with its competitor, Sainsbury is going to be carried out in this investigation which will
provide information to the potential investors about the financial performance of Tesco and
Sainsbury so they can make decisions. The management of Tesco and Sainsbury are going to be
recommended with the ways to improve financial performance.
2
BACKGROUND OF RESEARCH
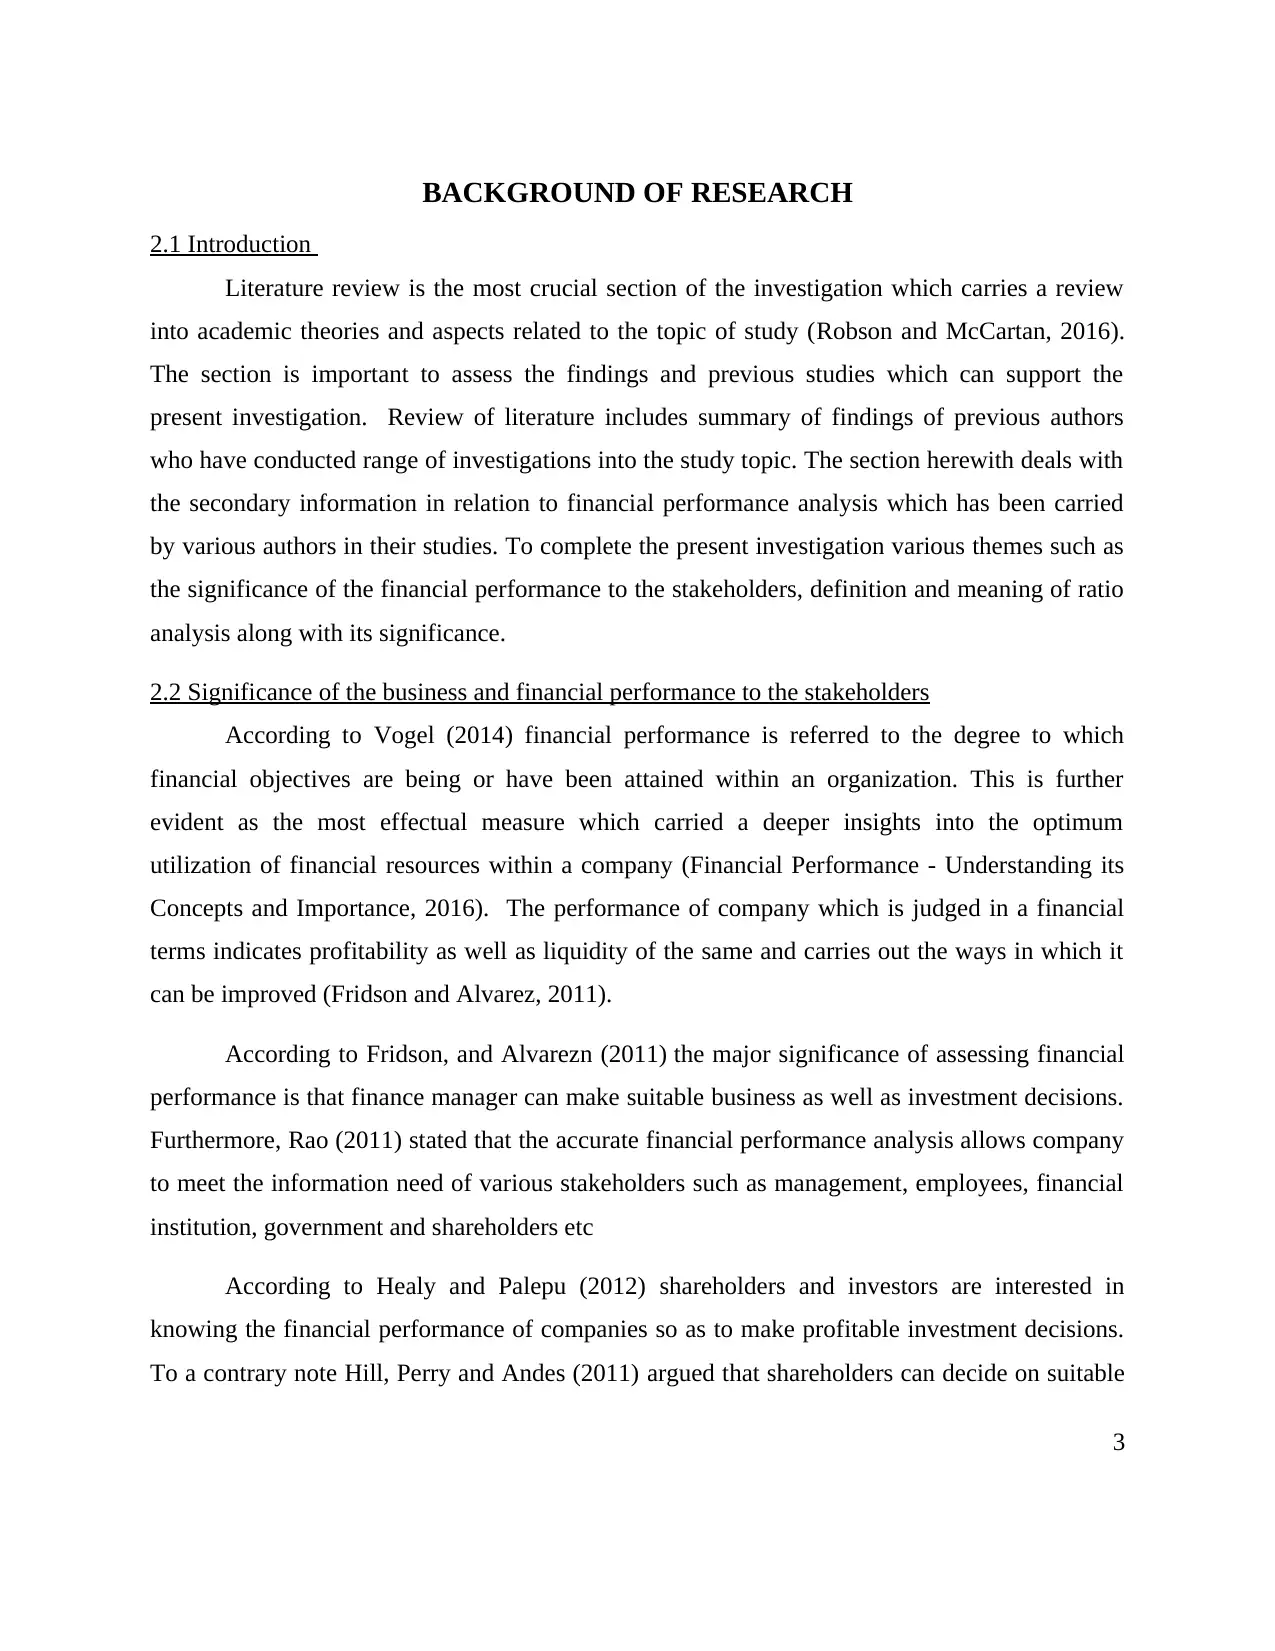
2.1 Introduction
Literature review is the most crucial section of the investigation which carries a review
into academic theories and aspects related to the topic of study (Robson and McCartan, 2016).
The section is important to assess the findings and previous studies which can support the
present investigation. Review of literature includes summary of findings of previous authors
who have conducted range of investigations into the study topic. The section herewith deals with
the secondary information in relation to financial performance analysis which has been carried
by various authors in their studies. To complete the present investigation various themes such as
the significance of the financial performance to the stakeholders, definition and meaning of ratio
analysis along with its significance.
2.2 Significance of the business and financial performance to the stakeholders
According to Vogel (2014) financial performance is referred to the degree to which
financial objectives are being or have been attained within an organization. This is further
evident as the most effectual measure which carried a deeper insights into the optimum
utilization of financial resources within a company (Financial Performance - Understanding its
Concepts and Importance, 2016). The performance of company which is judged in a financial
terms indicates profitability as well as liquidity of the same and carries out the ways in which it
can be improved (Fridson and Alvarez, 2011).
According to Fridson, and Alvarezn (2011) the major significance of assessing financial
performance is that finance manager can make suitable business as well as investment decisions.
Furthermore, Rao (2011) stated that the accurate financial performance analysis allows company
to meet the information need of various stakeholders such as management, employees, financial
institution, government and shareholders etc
According to Healy and Palepu (2012) shareholders and investors are interested in
knowing the financial performance of companies so as to make profitable investment decisions.
To a contrary note Hill, Perry and Andes (2011) argued that shareholders can decide on suitable
3
⊘ This is a preview!⊘
Do you want full access?
Subscribe today to unlock all pages.
Trusted by 1+ million students worldwide
investment decision only through comparing current performance with the rivals because on a
competitive business arena shareholders have number of options in which they can easily make
investment. Furthermore, Rao (2011) explained that suppliers and financial institutions are also
interested in knowing financial performance of individuals so that they can decide to lend money
to the business such as trade supplier and banks. Here, people, include who provide funds to the
company in the basis of its creditworthiness. The significance of knowing financial performance
of such entities’ is to know that to what extent business entity is able to repay the amount of loan
in given time frame. The financial institutes are highly concerned about the time in which they
will get their money. The banks and financial institutes need such information so as to decide
creditworthiness of business.
2.3 Ratio Analysis and significance
To the view point of Chang (2011) ratio analysis is an effective method to obtain a quick
indication of a firm's financial performance. The significance of ratios analysis is in finding out
the ways to improve the business performance by comparing it with inter firms or intra firms, in
means comparing performance with internal performance and competitor’s performance.
Furthermore it is useful in presenting the numerical data available into financial statements in a
simpler and easier forms. Ratio analysis is considered a useful tool to show the numerical
relationships based on the statements.
2.4 Classification of the ratios
Ratio analysis is an effective tool which carries the financial analysis into different forms
so as to know the financial health of a company is a different aspect (Healy and Palepu, 2012).
The ratios have been classified into various segments which are as follows:
Profitability Ratios: The profitability ratio analysis is a kind of ratios analysis which is
carried out to know how business is earning profits through effective use of financial resources.
Delen, Kuzey and Uyar, (2013) found profitability ratios to be used to know a constant
improvement in sales and profitability of business and is significantly carries out to measure the
efficiency of the company related to utilization of resources in earning profits.
Liquidity ratios – This is an effective kind of ratio analysis which is used to carry out the
efficiency of firm in paying short term financial obligations However Rao (2011) revealed that
4
Paraphrase This Document
Need a fresh take? Get an instant paraphrase of this document with our AI Paraphraser
liquidity ratio is frequently used to know short term solvency position of business. This ratio is
majorly used by creditors such as banks, suppliers to decide whether firms have adequate liquid
cash to meet their obligations.
Efficiency/ Activity ratios – Efficiency ratio, which is also called as activity ratio used for
generating revenues through transforming the production into sales. As per Kuada (2012) ratio
defines how frequently the assets and inventories are being converted into the sales and how
efficient a firm in using its assets.
Solvency ratios – The solvency ratio is a measurement of potentials of a corporate entity
to survive for a long period of time. This is a very important ratio for stakeholders and creditors
to decide on their investments in companies. Using this ratio, it becomes easy to examine the
capital structure of company.
2.5 Limitations of the ratio analysis
The major limitation of ratios analysis is that being a quantitative analysis tool, it ignores
qualitative analysis of business performance. To the view point of Chang (2011) the limitation of
ratio analysis is that appropriate standards of analysis cannot be determined due to ratio analysis.
The major conclusions derived from this analysis tool sometimes does not meet the standards of
companies. However, in the present investigation the companies are dealing in the same industry
hence, this limitation does not hamper present research objectives. Delen, Kuzey and Uyar,
(2013) explained that comparison becomes difficult in case when two companies are
significantly different in size, scale and nature, because, the judgment becomes very difficult for
the information users. Many of the times, ratios give false results, if they are calculated from
incorrect accounting data. In Tesco and Salisbury’s financial information there must be some
issuers relating to accounting data which might hampers the effectiveness of ratio analysis. In
respect to the present investigation, it can be an issue of carrying ratio analysis. In view of the
accounting issues that Tesco has had in the relatively recent past further hamper the ratio
analysis and their findings (Annual Report and Financial Statements Tesco. 2016).
5
Aims and objectives
Aim
The study aims to make a comparative analysis into the business as well as financial
performance of Tesco and Sainsbury.
Objective
To make comparison of the financial health of Tesco with its competitor, Sainsbury
To provide information to the potential investors about the financial performance of
Tesco and Sainsbury
To offer valuable information to several stakeholders about return on equity, dividend,
etc.
To help investors and shareholder in making suitable decision on investments and
provide assistance to them in making effective decisions.
Research questions
Q.1 How efficient Tesco and Sainsbury are in using shareholders’ investment?
Q.2 To which extent, Tesco and Sainsbury stakeholders are open to monetary risk?
Q.3 Which Company is utilizing its financial resources to their optimum level?
Q.4 Will Tesco and Sainsbury are able to attain success in the upcoming years or in
future?
6
⊘ This is a preview!⊘
Do you want full access?
Subscribe today to unlock all pages.
Trusted by 1+ million students worldwide
1 out of 37
Related Documents


Your All-in-One AI-Powered Toolkit for Academic Success.
+13062052269
info@desklib.com
Available 24*7 on WhatsApp / Email
![[object Object]](/_next/static/media/star-bottom.7253800d.svg)
Unlock your academic potential
Copyright © 2020–2026 A2Z Services. All Rights Reserved. Developed and managed by ZUCOL.