Comparative Stock Analysis: Tesco & Sainsbury's Portfolio Management
VerifiedAdded on 2023/06/10
|12
|3581
|119
Report
AI Summary
This report provides a comprehensive financial analysis of Tesco and Sainsbury's, two major grocery companies, over a five-year period. It computes key metrics such as mean, standard deviation, and variance of monthly stock returns to evaluate investment risk and potential profitability. The analysis includes a calculation of portfolio risk and return under various investment scenarios, graphical representation of results, and determination of the efficient frontier. Furthermore, the report calculates the minimum variance portfolio and optimal investment weights, offering investment suggestions based on risk tolerance. The report also applies the dividend discount model to estimate Tesco's equity value, comparing it with the market value. Desklib offers this and other solved assignments for students.
FINANCE
AND
FINANCIAL
MANAGEMENT
Contents
AND
FINANCIAL
MANAGEMENT
Contents
Paraphrase This Document
Need a fresh take? Get an instant paraphrase of this document with our AI Paraphraser
INTRODUCTION...........................................................................................................................3
TASK...............................................................................................................................................3
PART 1............................................................................................................................................3
1.a Give brief explanation of two chosen companies:.................................................................3
1.b Compute mean, standard deviation and variance of monthly returns of two stocks
separately:....................................................................................................................................4
1.c Provide comments on results recorded and provide related suggestions:..............................5
2.a Calculation of Portfolio risk and return in different case scenario:.......................................5
2.b Plotting of the results considering individual results and portfolio results in the graphical
manner:........................................................................................................................................6
2.c The Efficient frontier point of both the securities:.................................................................6
2.d Calculation of Minimum variance portfolio along with optimal weights at which return
will be higher:..............................................................................................................................7
2.e Suggestion to the investor on selection of the Stock and advise them if the assets are
available to the investor:..............................................................................................................8
Part 2................................................................................................................................................8
1. Calculation of investor required rate of return on Tesco shares:.............................................8
2.Calculation of Tesco Equity value using dividend discount model:........................................9
3. Comparison between market value and value as calculated above:......................................10
CONCLUSION..............................................................................................................................10
REFERENCES..............................................................................................................................11
INTRODUCTION
The report prepared as under takes in account Finance and Financial management related
activities & operations in two different companies dealing in same sector such as groceries. The
companies taken into consideration are Tesco and Sainsbury which concentrate on serving best
qualitative goods to its customers over a certain point of time. The report prepared as under
focuses on collection of stock related data for a time span of five years. It also computes Mean,
standard deviation and variance for specific data sorted and put at one place. It further provides
guidance for evaluating the performance being served by business over a period of time.
Therefore, one can compare results and outputs being calculated for a stated point and finding
ways that would contribute in improving the present outcome keeping future prospects in mind.
There are methods such as Dividend discount model and total pay-out methods which are
adapted for carrying out comparisons and understanding how the company can improve its
efficiency over the time frame (Oosterlee and Grzelak, 2019).
TASK
PART 1
1.a Give brief explanation of two chosen companies:
SAINSBURY: It is an organisation that is considered as second largest chain in
supermarkets located in United Kingdom. It further provides offering in products such as
home wares, qualitative food, electrical and convenient shopping as well. It has many
brands taken under consideration such as Nectar, Sainsbury bank, Habitat, Argos. It
makes use of various strategies for serving customer the best among available choices
and provide maximum satisfaction as well. There are many competitors of Sainsbury
such as Asda, Aldi and Lidl too. It further targets the remote areas & location and rural
areas as well in specific territories where it is facilitating its operational work (Hillier,
2019).
TESCO: It is a well-known company over the globe that deals in groceries since 1919. Its
business is headquartered in Welwyn garden city, England. It has extended its operations
in various areas apart from groceries such as furniture, financial services, internet
services, telecom, software and electronics as well. It serves several opportunities which
can be explained as employment related prospects as well. It has also covered countries
⊘ This is a preview!⊘
Do you want full access?
Subscribe today to unlock all pages.
Trusted by 1+ million students worldwide
such as Indonesia, South Korea and turkey for improving the level of revenue, income
and profits as well. It is counted among businesses which give access to gain better
suppliers for running and functioning of company. It further helps in managing liquidity
which mirrors that shareholders are able to carry out buying and selling of shares in an
easier manner when compared with others (Rashid and et.al., 2018).
1.b Compute mean, standard deviation and variance of monthly returns of two stocks separately:
Mean: It can be explained as easy computation of mathematical average of a combination
of two or more values. It is calculated for measuring the centre of a data set prepared in
numerical form. Mean is based on all interpretations and observations. There are different
kind of mean such as weighted mean, geometric mean, arithmetic mean or harmonic
mean. Mean result recorded for Tesco company is 27% whereas in case of Sainsbury it
gave an output of 38%.
Standard deviation: It can be calculated such as square root of variance. In finance, it is
often helpful for measuring a related risk involved in an asset. It measures how much
individual data set varies from the average of a set of data. In business management
related application such as standard deviation is helpful in computation of margin of error
if any in way of customer satisfaction related surveys, the volatility of stock rates and
more. It provides a more detailed picture as in what ways data and information is being
dispersed. Extreme values have lesser effect (Cumming, Verdoliva, and Zhan, 2021). It is
a measure of risk which an investment would be observing to fluctuate from its recorded
expected return. Standard deviation reflected a figure of 6.6486 in case of Tesco
company whereas in Sainsbury it recorded a value of 7.60307. Thus it can be concluded
that Tesco has less reliability when compared to Sainsbury as it records relatively less
amount in comparison to other.
Variance: It can be described as a measure of the spread among the values in a dataset.
Investors take help of such methods for seeking and analysing related risk carried by an
investment activity and if it would prove to be fruitful as well as profitable. It is also
useful for facilitating comparison of relative performance of each acquired asset present
in a portfolio for achieving the best asset allocated. It also helps to understand how well
mean is representing an entire set of data, higher the variance more are the chances of
range to exist within the set developed. Variance recorded in case of Tesco company is
Paraphrase This Document
Need a fresh take? Get an instant paraphrase of this document with our AI Paraphraser
44.2044 whereas in case of Sainsbury it reflected a figure of 57.8068. Thus it can be said
that high variance stock specifies and they tend to be better for investors who prefer
lesser risk while lower variance stock is observed to be associated with lower risk and
lower return.
1.c Provide comments on results recorded and provide related suggestions:
It is observed that Sainsbury has been recorded to have higher variance as compared to
Tesco which helps to understand that there are relatively more fluctuations observed in
the results recorded when compared to other company being selected. Hence it is
recommended that investors should go for Tesco if they plan to opt for lesser risk and
threats involved in the process of returns. But if they opt for higher risk and higher return
concept they must opt for Sainsbury company (Griffin, 2019).
Standard deviation recorded in Sainsbury of higher value when compared to Tesco thus it
is advised that users linked with the company and investors who are planning to put their
money in organisation must chose Tesco as its value are observed to be less dispersed as
compared to other chosen organisation.
Mean represents average computed and calculated for a related organisation and the
average return that has been arrived of Sainsbury is 38 % which shows that their
performance has been better as compare to Tesco. The Tesco average return has been
arrived at 27% on an average which implies that their earning is lower when compare to
Sainsbury return over the period of 5 years starting from 2017 to 2021. On comparing the
return of both the companies it is recommended to the investor to invest their funds in
Sainsbury instead of Tesco as they get better return on their investment when funds are
invested in equity of their business (Hanson and Olson, 2018).
2.a Calculation of Portfolio risk and return in different case scenario:
The practical calculation on different case scenario has been calculated on the excel workbook.
On the basis of different amount of investment, the conclusion that has been draw will be
mentioned below:
When mean has been compared in different case scenario, the average return is higher when the
investment that has been made in the ratio of 10:90 in both the stocks of Tesco and Sainsbury
and the return that arrives to the investor will be 37.02% as computed in the excel workbook.
Therefore, it is suggested to the investor to make the investment in the security in the above
proportion to get the higher returns (Scott, Lundgren, and Thompson, 2018). The standard
deviation denotes the risk in the security and such risk has been lower when investment to be
made in the ratio of .90:10 in both the security. The optimal variance of the portfolio will be at
when investment to be made in the ratio of .90:.10 in the above securities that amount to 6.744.
The overall conclusion that has been made that investment if made on individual security that the
investor will be in the loss and if the both the stocks are considered then return will be higher and
risk will be diversified that benefits the investor as well.
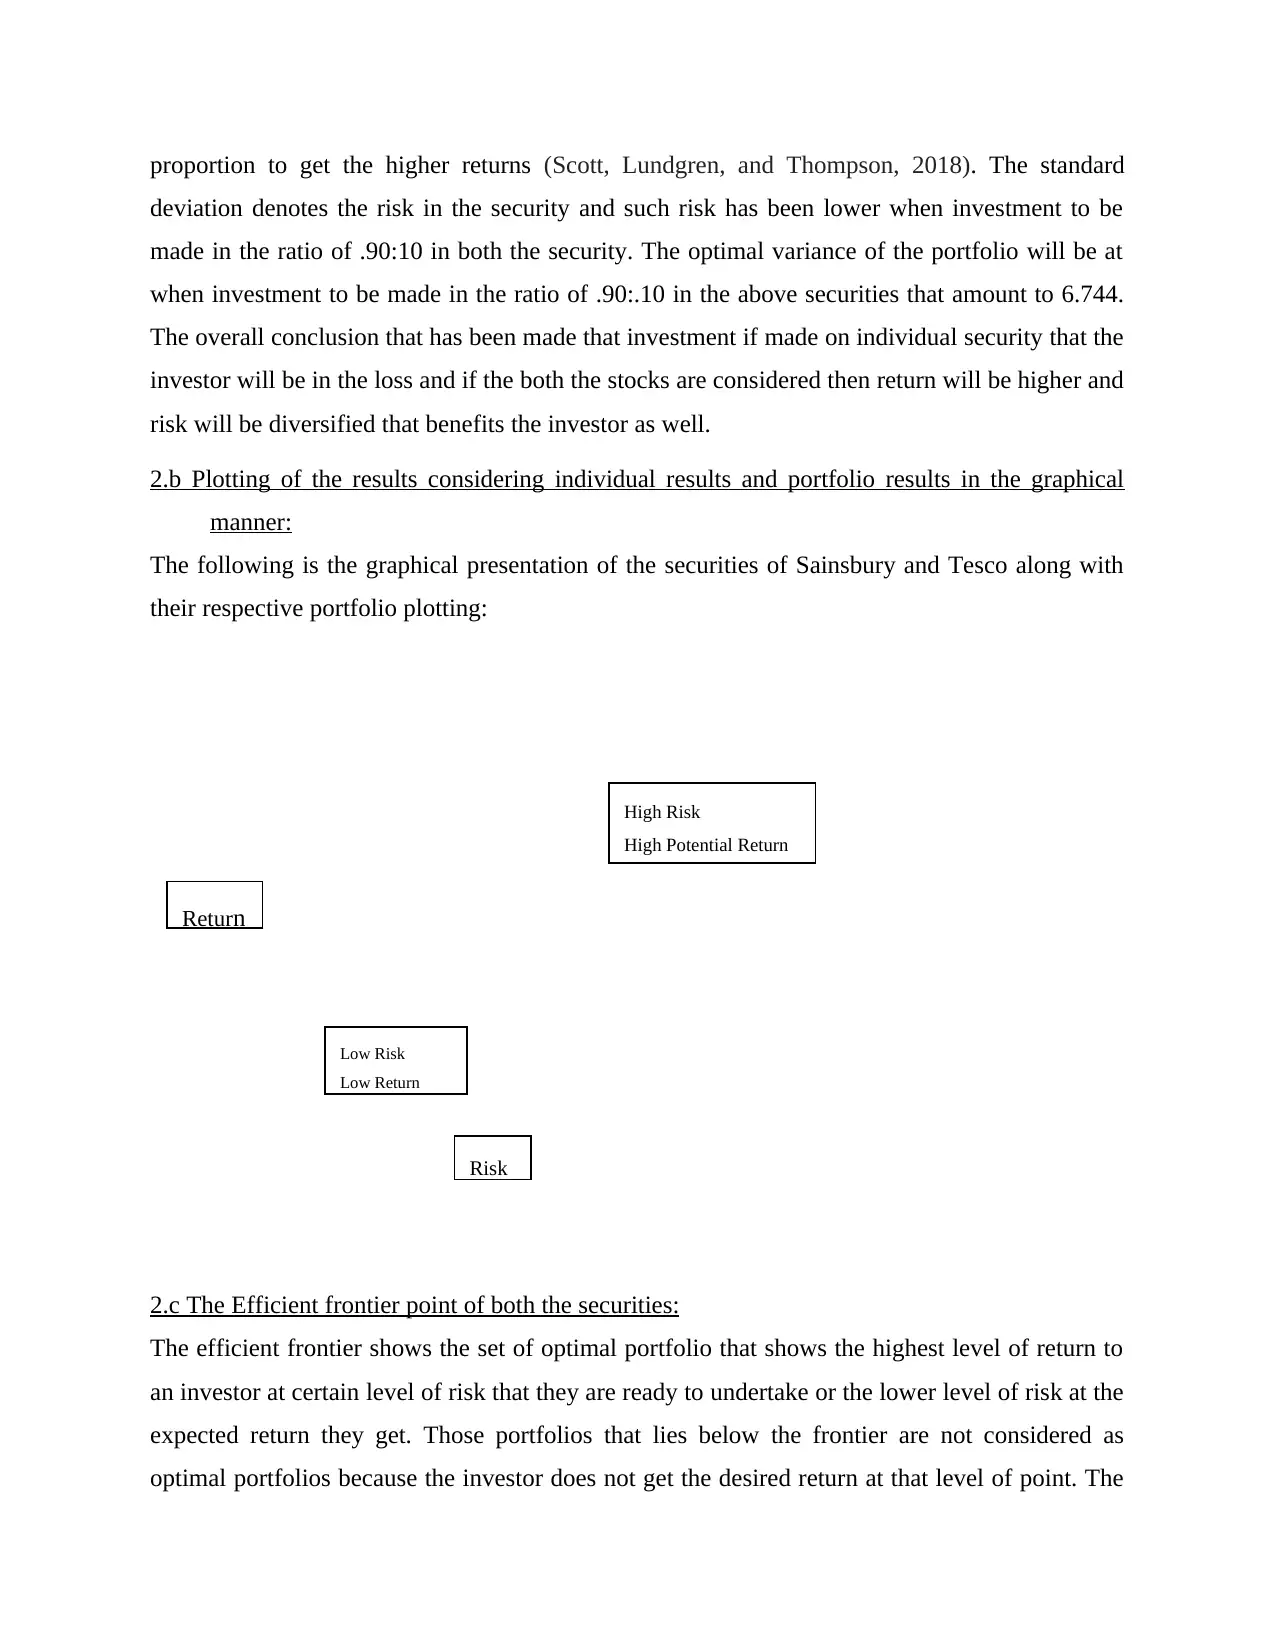
2.b Plotting of the results considering individual results and portfolio results in the graphical
manner:
The following is the graphical presentation of the securities of Sainsbury and Tesco along with
their respective portfolio plotting:
2.c The Efficient frontier point of both the securities:
The efficient frontier shows the set of optimal portfolio that shows the highest level of return to
an investor at certain level of risk that they are ready to undertake or the lower level of risk at the
expected return they get. Those portfolios that lies below the frontier are not considered as
optimal portfolios because the investor does not get the desired return at that level of point. The
Risk
Return
High Risk
High Potential Return
Low Risk
Low Return
deviation denotes the risk in the security and such risk has been lower when investment to be
made in the ratio of .90:10 in both the security. The optimal variance of the portfolio will be at
when investment to be made in the ratio of .90:.10 in the above securities that amount to 6.744.
The overall conclusion that has been made that investment if made on individual security that the
investor will be in the loss and if the both the stocks are considered then return will be higher and
risk will be diversified that benefits the investor as well.
2.b Plotting of the results considering individual results and portfolio results in the graphical
manner:
The following is the graphical presentation of the securities of Sainsbury and Tesco along with
their respective portfolio plotting:
2.c The Efficient frontier point of both the securities:
The efficient frontier shows the set of optimal portfolio that shows the highest level of return to
an investor at certain level of risk that they are ready to undertake or the lower level of risk at the
expected return they get. Those portfolios that lies below the frontier are not considered as
optimal portfolios because the investor does not get the desired return at that level of point. The
Risk
Return
High Risk
High Potential Return
Low Risk
Low Return
⊘ This is a preview!⊘
Do you want full access?
Subscribe today to unlock all pages.
Trusted by 1+ million students worldwide
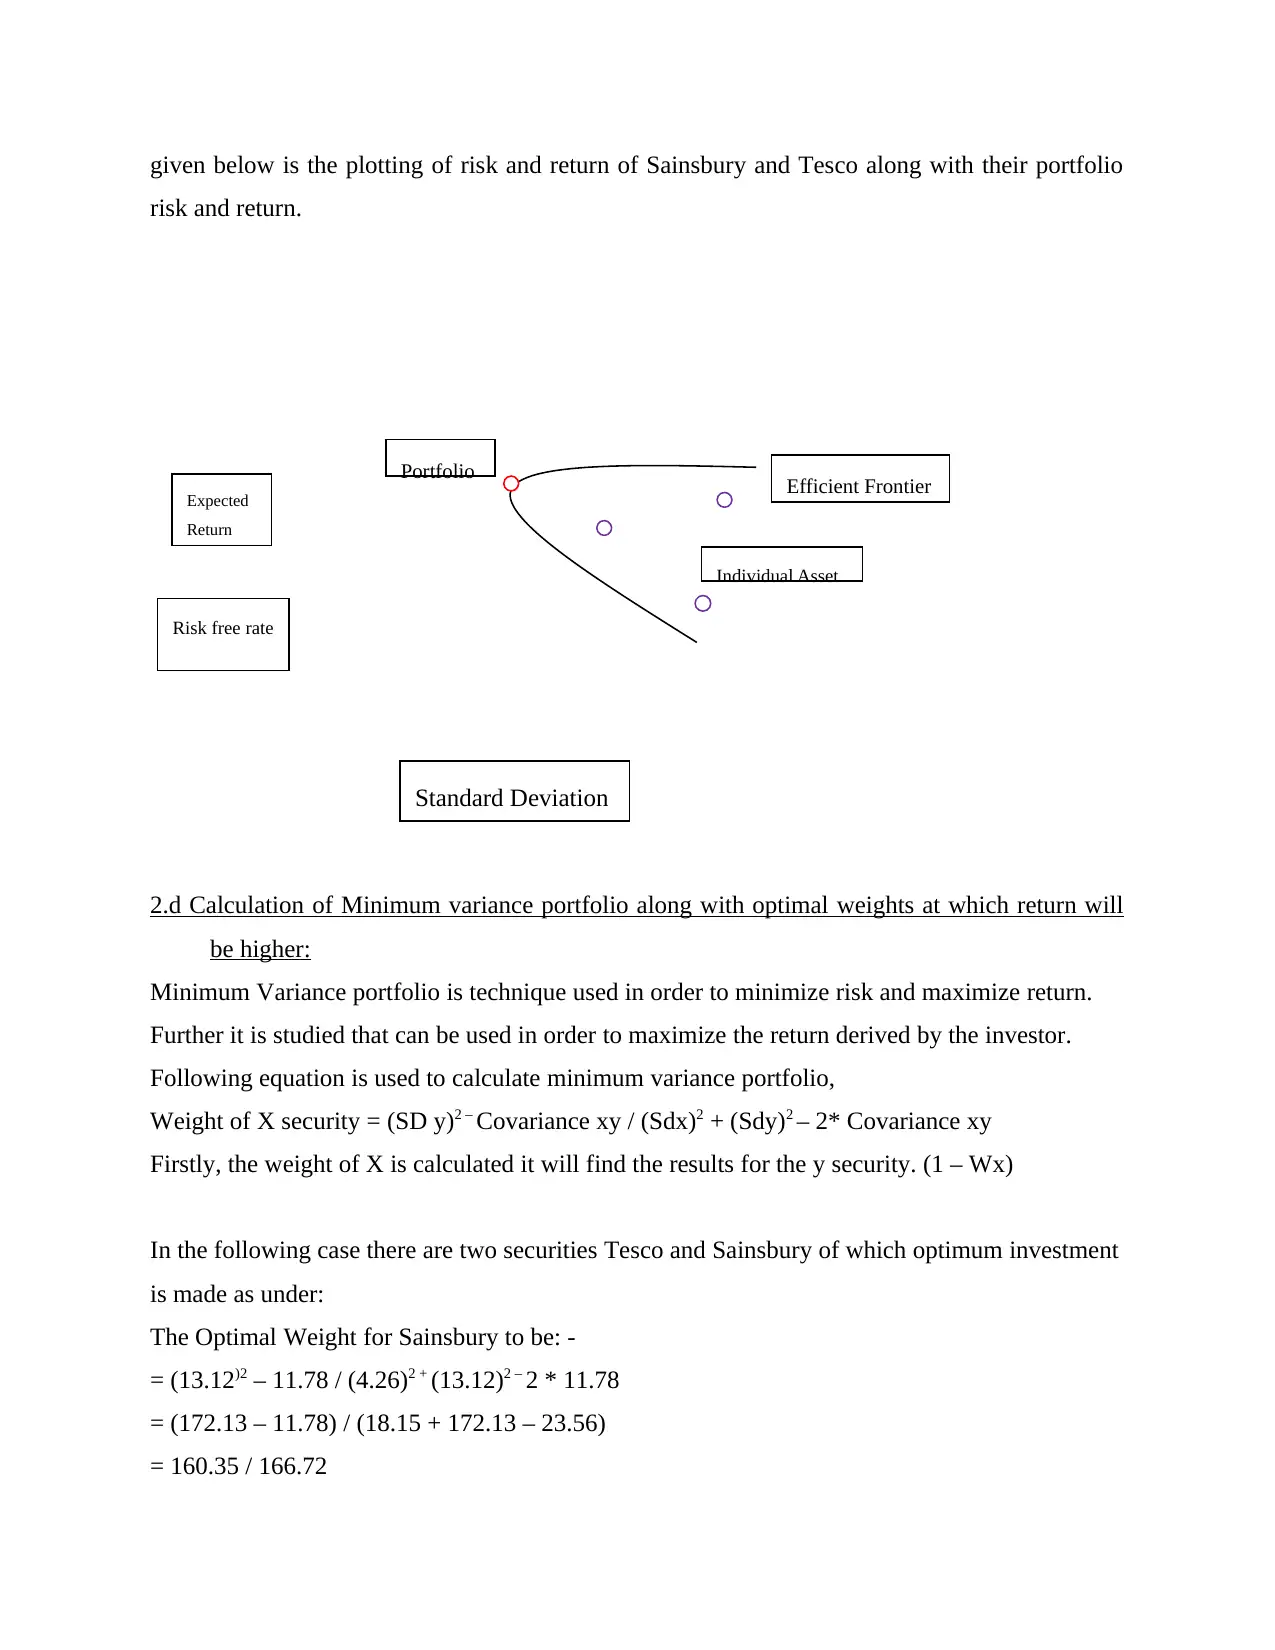
given below is the plotting of risk and return of Sainsbury and Tesco along with their portfolio
risk and return.
2.d Calculation of Minimum variance portfolio along with optimal weights at which return will
be higher:
Minimum Variance portfolio is technique used in order to minimize risk and maximize return.
Further it is studied that can be used in order to maximize the return derived by the investor.
Following equation is used to calculate minimum variance portfolio,
Weight of X security = (SD y)2 – Covariance xy / (Sdx)2 + (Sdy)2 – 2* Covariance xy
Firstly, the weight of X is calculated it will find the results for the y security. (1 – Wx)
In the following case there are two securities Tesco and Sainsbury of which optimum investment
is made as under:
The Optimal Weight for Sainsbury to be: -
= (13.12)2 – 11.78 / (4.26)2 + (13.12)2 – 2 * 11.78
= (172.13 – 11.78) / (18.15 + 172.13 – 23.56)
= 160.35 / 166.72
Individual Asset
Standard Deviation
Expected
Return
Risk free rate
Efficient Frontier
Portfolio
Paraphrase This Document
Need a fresh take? Get an instant paraphrase of this document with our AI Paraphraser
= 0.96
The ideal portfolio mix of the above securities is by investing 96% of the available amount and
remaining 4% of investment is made in respect of the total investment.
Standard Deviation of the above securities is calculated as:
= (4.26)2 * (.96)2 + (13.12)2 * (.04)2 + 2 * .96 * .04 * 4.26 * 13.12 * .21
= (18.15 * .92) + (172.13 * .002) + .90
= .70 + .34 + .90
= 1.94%
It can be concluded that standard deviation is 1.94% in case of Tesco and Sainsbury.
2.e Suggestion to the investor on selection of the Stock and advise them if the assets are available
to the investor:
Based on the calculation above the final interpretation has been drawn that the investor must
invest their funds in Tesco as the investor would get better returns if they invest their money in
that company for the long period of time. Sainsbury market price is regularly fluctuating over the
period of time and therefore the proper return on the investment cannot be arrived for the long
period of time (Brown, 2018). As an investor investment to be made in those security that
provides sustainable and consistent return to the investor and the returns that has been arrived on
monthly basis that has been covered in the excel is consistent is case of Tesco and in case of
Sainsbury it is fluctuating over the period of 5 years. Therefore, it is recommended to the
investor to make the investment in Tesco Plc.
Part 2
1. Calculation of investor required rate of return on Tesco shares:
The required rate of return shows that the value of entity is lower in terms of profit or return they
get assuming that the funds are being invested in stock or any other type of security. The
required rate of return simply means that the rate at which the invested needs are to be fulfilled
from the business in which they have invested. The formula of calculating the required rate of
return is using capital asset pricing model is mentioned as under: -
ERx = Rf + B (Rm – Rf)
Here, Rf is risk free rate, B denoted to beta, Rm is market rate of return. The difference between
Rm and Rm is market risk premium (Schäfer, 2018).
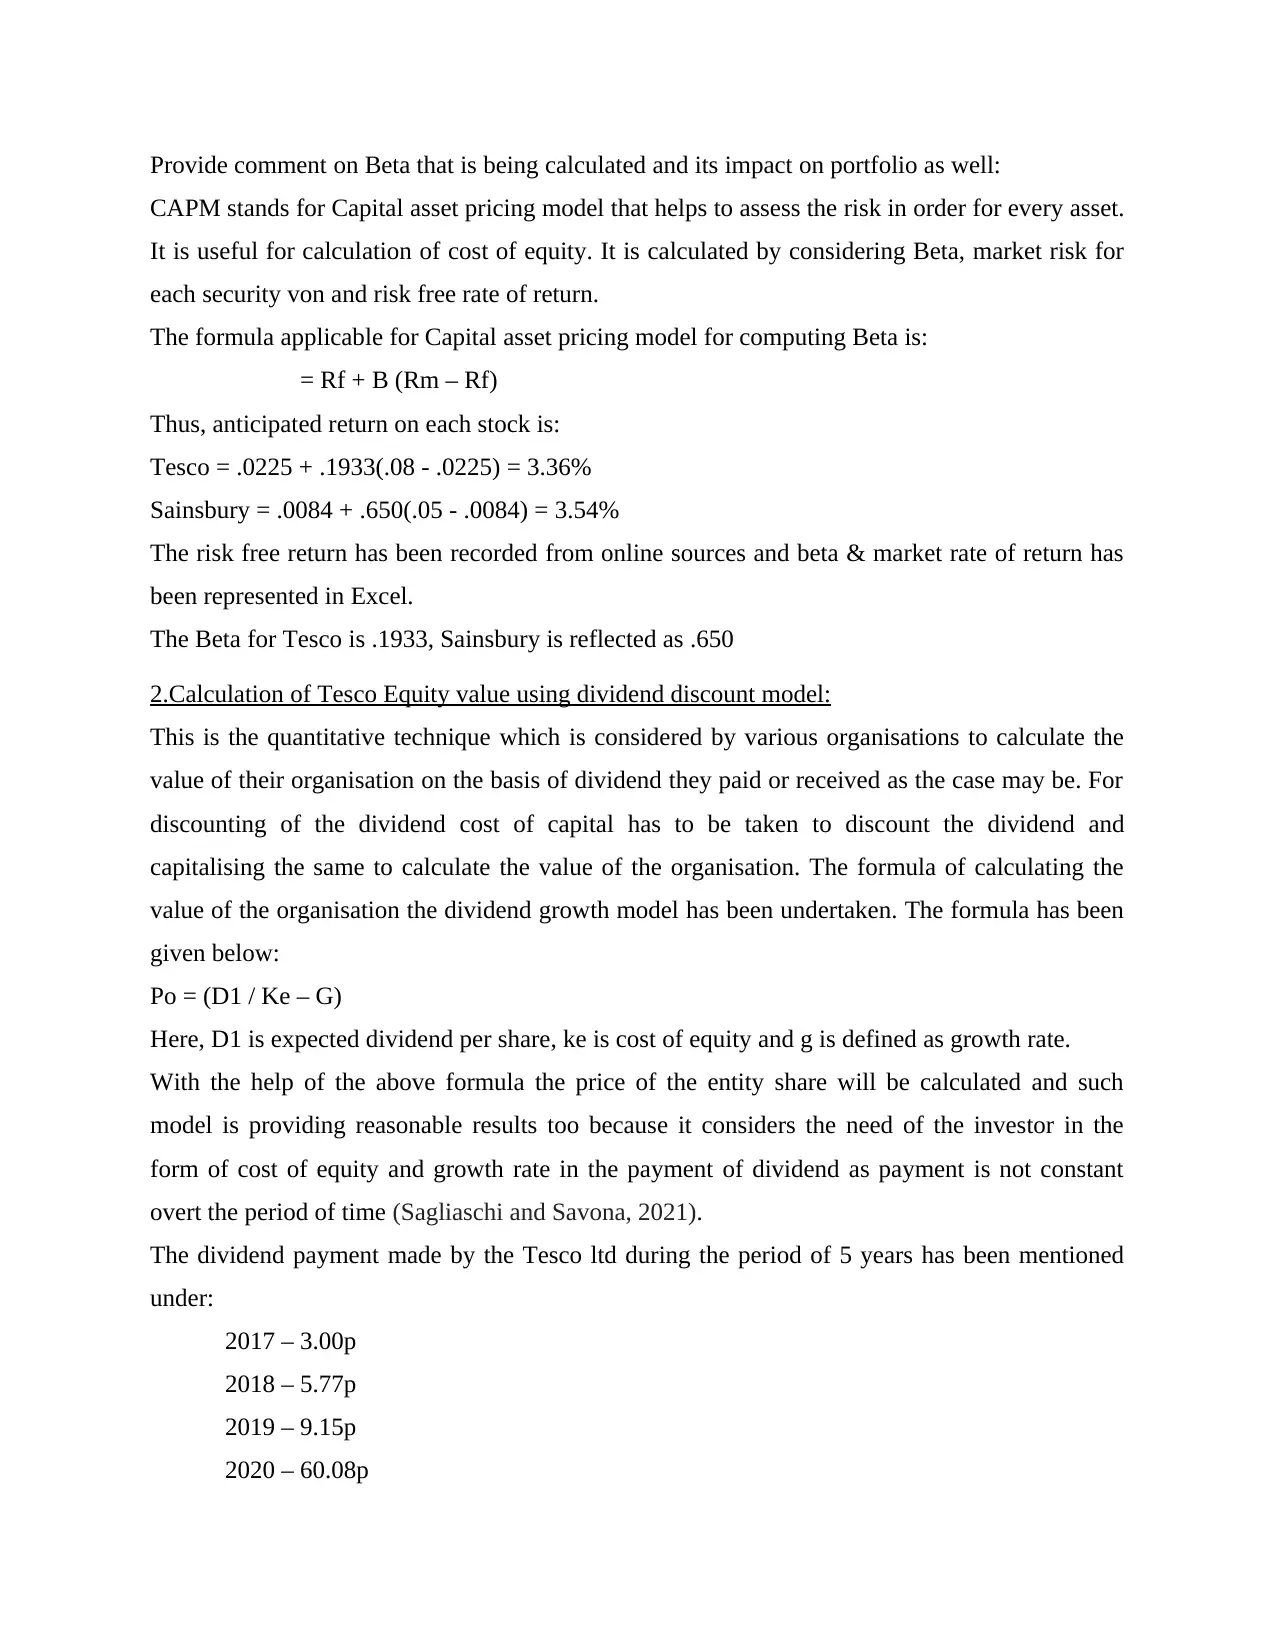
Provide comment on Beta that is being calculated and its impact on portfolio as well:
CAPM stands for Capital asset pricing model that helps to assess the risk in order for every asset.
It is useful for calculation of cost of equity. It is calculated by considering Beta, market risk for
each security von and risk free rate of return.
The formula applicable for Capital asset pricing model for computing Beta is:
= Rf + B (Rm – Rf)
Thus, anticipated return on each stock is:
Tesco = .0225 + .1933(.08 - .0225) = 3.36%
Sainsbury = .0084 + .650(.05 - .0084) = 3.54%
The risk free return has been recorded from online sources and beta & market rate of return has
been represented in Excel.
The Beta for Tesco is .1933, Sainsbury is reflected as .650
2.Calculation of Tesco Equity value using dividend discount model:
This is the quantitative technique which is considered by various organisations to calculate the
value of their organisation on the basis of dividend they paid or received as the case may be. For
discounting of the dividend cost of capital has to be taken to discount the dividend and
capitalising the same to calculate the value of the organisation. The formula of calculating the
value of the organisation the dividend growth model has been undertaken. The formula has been
given below:
Po = (D1 / Ke – G)
Here, D1 is expected dividend per share, ke is cost of equity and g is defined as growth rate.
With the help of the above formula the price of the entity share will be calculated and such
model is providing reasonable results too because it considers the need of the investor in the
form of cost of equity and growth rate in the payment of dividend as payment is not constant
overt the period of time (Sagliaschi and Savona, 2021).
The dividend payment made by the Tesco ltd during the period of 5 years has been mentioned
under:
2017 – 3.00p
2018 – 5.77p
2019 – 9.15p
2020 – 60.08p
⊘ This is a preview!⊘
Do you want full access?
Subscribe today to unlock all pages.
Trusted by 1+ million students worldwide
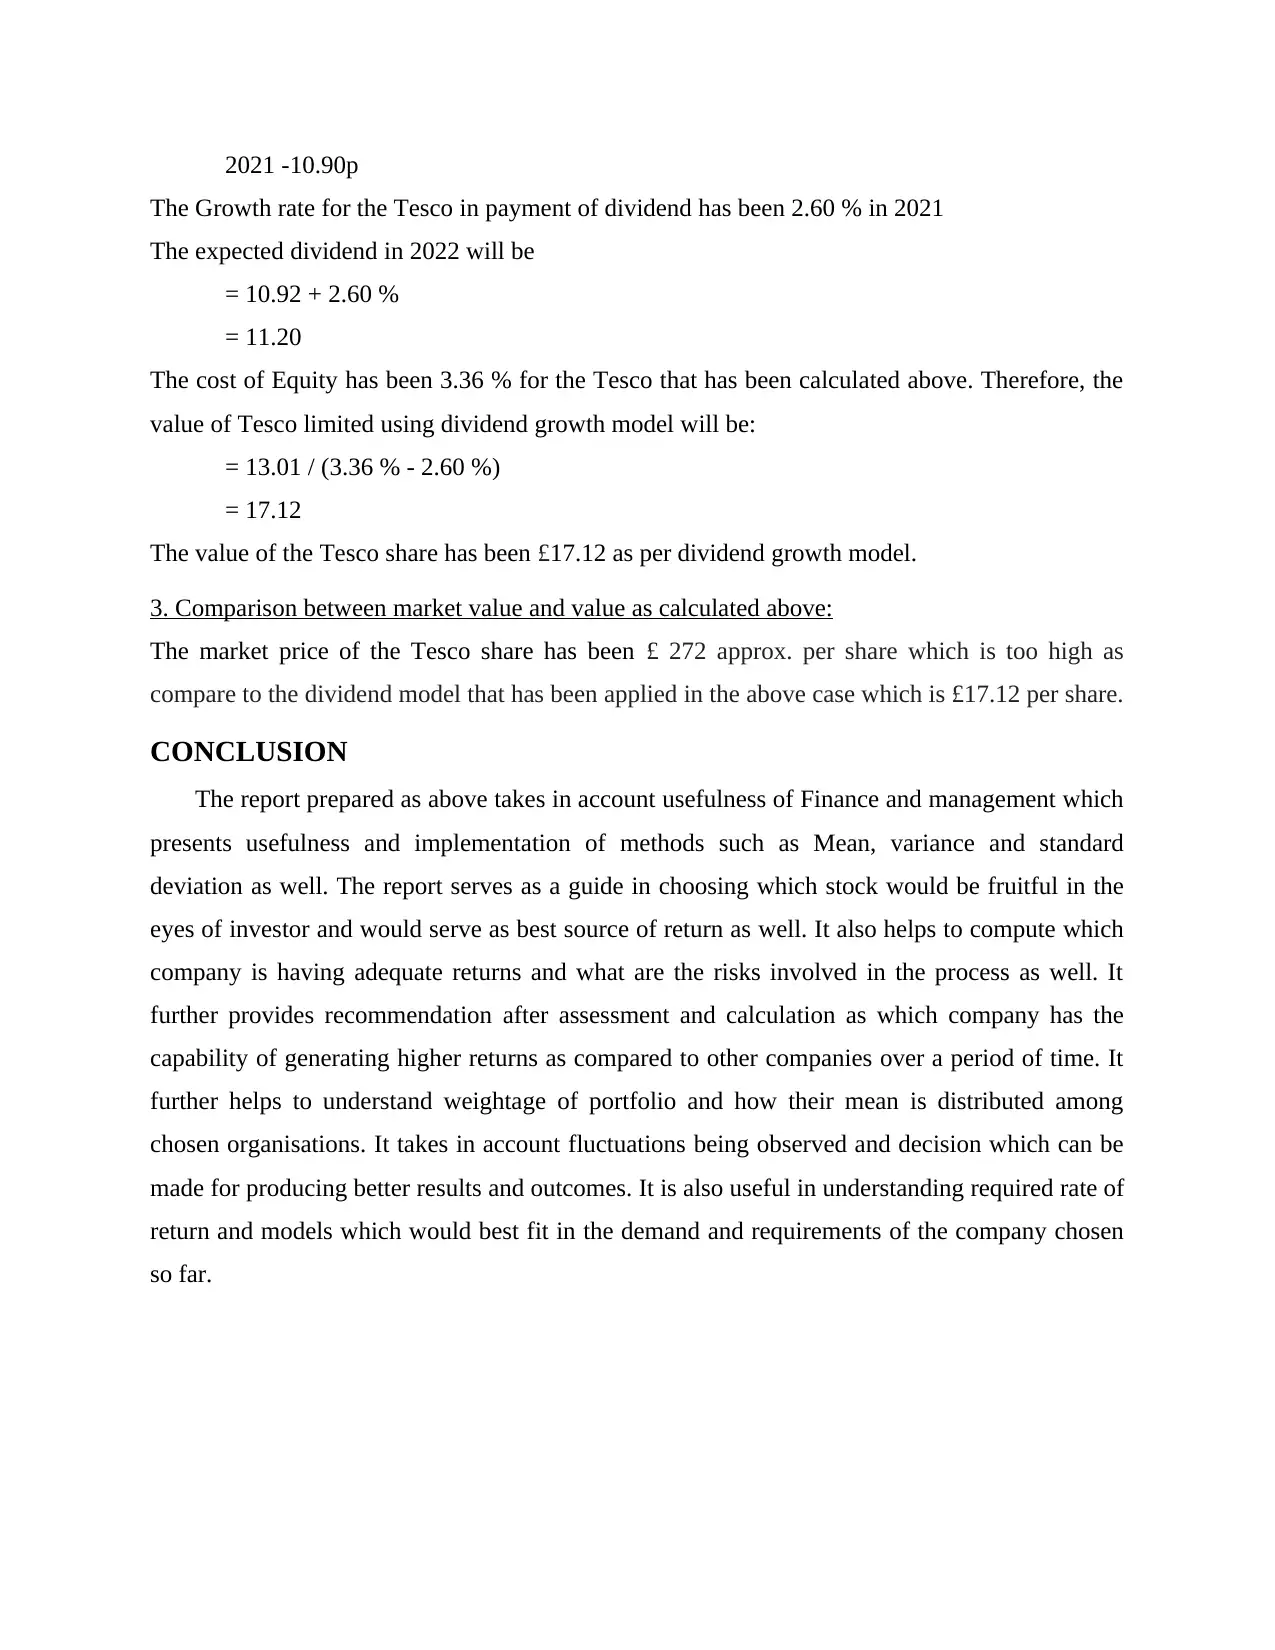
2021 -10.90p
The Growth rate for the Tesco in payment of dividend has been 2.60 % in 2021
The expected dividend in 2022 will be
= 10.92 + 2.60 %
= 11.20
The cost of Equity has been 3.36 % for the Tesco that has been calculated above. Therefore, the
value of Tesco limited using dividend growth model will be:
= 13.01 / (3.36 % - 2.60 %)
= 17.12
The value of the Tesco share has been £17.12 as per dividend growth model.
3. Comparison between market value and value as calculated above:
The market price of the Tesco share has been £ 272 approx. per share which is too high as
compare to the dividend model that has been applied in the above case which is £17.12 per share.
CONCLUSION
The report prepared as above takes in account usefulness of Finance and management which
presents usefulness and implementation of methods such as Mean, variance and standard
deviation as well. The report serves as a guide in choosing which stock would be fruitful in the
eyes of investor and would serve as best source of return as well. It also helps to compute which
company is having adequate returns and what are the risks involved in the process as well. It
further provides recommendation after assessment and calculation as which company has the
capability of generating higher returns as compared to other companies over a period of time. It
further helps to understand weightage of portfolio and how their mean is distributed among
chosen organisations. It takes in account fluctuations being observed and decision which can be
made for producing better results and outcomes. It is also useful in understanding required rate of
return and models which would best fit in the demand and requirements of the company chosen
so far.
Paraphrase This Document
Need a fresh take? Get an instant paraphrase of this document with our AI Paraphraser
REFERENCES
Books and Journals
Oosterlee, C.W. and Grzelak, L.A., 2019. Mathematical Modeling and Computation in Finance:
With Exercises and Python and Matlab Computer Codes. World Scientific.
Hillier, D., 2019. EBOOK: Corporate Finance: European Edition. McGraw Hill.
Rashid, K.A. and et.al., 2018. Concept and Application of Shariah for the Construction
Industry: Shariah Compliance in Construction Contracts, Project Finance and Risk
Management. World Scientific.
Cumming, D., Verdoliva, V. and Zhan, F., 2021. New and future research in corporate finance
and governance in China and emerging markets. Emerging Markets Review. 46.
p.100792.
Griffin, P., 2019. The everyday practices of global finance: gender and regulatory politics of
‘diversity’. International Affairs. 95(6). pp.1215-1233.
Hanson, T.A. and Olson, P.M., 2018. Financial literacy and family communication
patterns. Journal of Behavioral and Experimental Finance. 19. pp.64-71.
Scott, C., Lundgren, H. and Thompson, P., 2018. Guide to Finance in Supply Chain
Management. In Guide to Supply Chain Management (pp. 161-174). Springer, Cham.
Brown, A., 2018 15.5 Australasia. Emerging areas within the accounting curriculum. p.327.
Schäfer, H., 2018. Germany: the ‘greenhorn’in the green finance revolution. Environment:
Science and Policy for Sustainable Development. 60(1). pp.18-27.
Sagliaschi, U. and Savona, R., 2021. Dynamical Corporate Finance: An Equilibrium Approach.
Springer Nature.
Greenbaum, S.I., Thakor, A.V. and Boot, A., 2019. Contemporary financial intermediation.
Academic Press.
Chollet, P. and Sandwidi, B.W., 2018. CSR engagement and financial risk: A virtuous circle?
International evidence. Global Finance Journal. 38. pp.65-81.
Brealey, R.A. and et.al., 2018. Principles of corporate finance. 12/e (Vol. 12). McGraw-Hill
Education.
Zarb, B.J., 2018. LIQUIDITY, SOLVENCY, AND FINANCIAL HEALTH: DO THEY HAVE
AN IMPACT ON US AIRLINE COMPANIES'PROFIT VOLATILITY? International
Journal of Business, Accounting, & Finance. 12(1).
Mason, P. and Utke, S., 2019. The structure of private funds, their relation to private firms, and
the implications for accounting, economics, and finance research. Their Relation to
Private Firms, and the Implications for Accounting, Economics, and Finance Research
(June 13, 2019).
⊘ This is a preview!⊘
Do you want full access?
Subscribe today to unlock all pages.
Trusted by 1+ million students worldwide
1 out of 12
Related Documents


Your All-in-One AI-Powered Toolkit for Academic Success.
+13062052269
info@desklib.com
Available 24*7 on WhatsApp / Email
![[object Object]](/_next/static/media/star-bottom.7253800d.svg)
Unlock your academic potential
Copyright © 2020–2026 A2Z Services. All Rights Reserved. Developed and managed by ZUCOL.