Managerial Finance Report
VerifiedAdded on 2019/12/18
|19
|3560
|162
Report
AI Summary
This report analyzes the financial performance of Tesco and Sainsbury, two major UK supermarket chains, for the 2014/15 financial period. It uses ratio analysis to compare profitability (ROCE, net profit margin, gross profit margin), liquidity (current ratio, acid test ratio), efficiency (inventory turnover, asset turnover), and gearing (interest cover, earnings per share). The report finds that Sainsbury's generally outperforms Tesco across most ratios, particularly in profitability and liquidity. It also discusses the limitations of using financial ratios for interpreting firm performance, such as historical data limitations, inflation effects, and accounting policy differences. The second part of the report involves capital investment appraisal, specifically comparing two projects (A and B) using Net Present Value (NPV). Project A is recommended due to its higher positive NPV. The report concludes by highlighting the limitations of NPV, including sensitivity to the discount rate, exclusion of real options, and assumptions about future cash flows.
Managerial Finance
Paraphrase This Document
Need a fresh take? Get an instant paraphrase of this document with our AI Paraphraser
Table of Contents
Introduction......................................................................................................................................2
Ratio Analysis..................................................................................................................................2
Profitability ratios........................................................................................................................2
The Return on Capital Employed (ROCE)..............................................................................3
Net Profit Margin.....................................................................................................................4
Gross Profit Margin.................................................................................................................4
Liquidity Ratio.............................................................................................................................5
Current Ratio...........................................................................................................................5
Acid Test Ratio........................................................................................................................6
Efficiency Ratio...........................................................................................................................6
Inventories turnover.................................................................................................................7
Assets Turnover.......................................................................................................................7
Gearing Ratio...............................................................................................................................8
Interest Cover...........................................................................................................................8
Earnings per share....................................................................................................................9
Recommendations of how the financial performance of the poorly performing business can be
improved..........................................................................................................................................9
Liquidity ratios...........................................................................................................................10
Efficiency ratios.........................................................................................................................10
Profitability ratios......................................................................................................................10
Leverage ratios...........................................................................................................................11
The limitations of relying on financial ratios to interpret firm performance.................................11
Portfolio 2; Capital Investment Appraisal.....................................................................................13
The limitations of using investment appraisal techniques to aid long term decision-making.......14
Bibliography..................................................................................................................................16
⊘ This is a preview!⊘
Do you want full access?
Subscribe today to unlock all pages.
Trusted by 1+ million students worldwide
Portfolio 1
Comparative analysis between Tesco limited and Sainsbury limited
Introduction
The report focus on examine the financial performance for two famous company (Sainsbury and
Tesco) in the retail market in UK. The report permits the comparison of the ratio analysis, in
which the profitability, liquidity, efficiency and gearing ratio is examined and recommendation
provided for the best companies from the examination of the ratio analysis for the financial
period 2014/15. Tesco is the global third largest retail company after Wal-Mart and Carrefour as
evaluated in term of income (2015). The company is the UK leading home supermarket chain.
The company has 2306 stores with more than 31% shareholding in UK market. Sainsbury is the
3rd biggest retail firm in the UK supermarket industry with it holding of more than 17% of UK
market shares.
Ratio Analysis
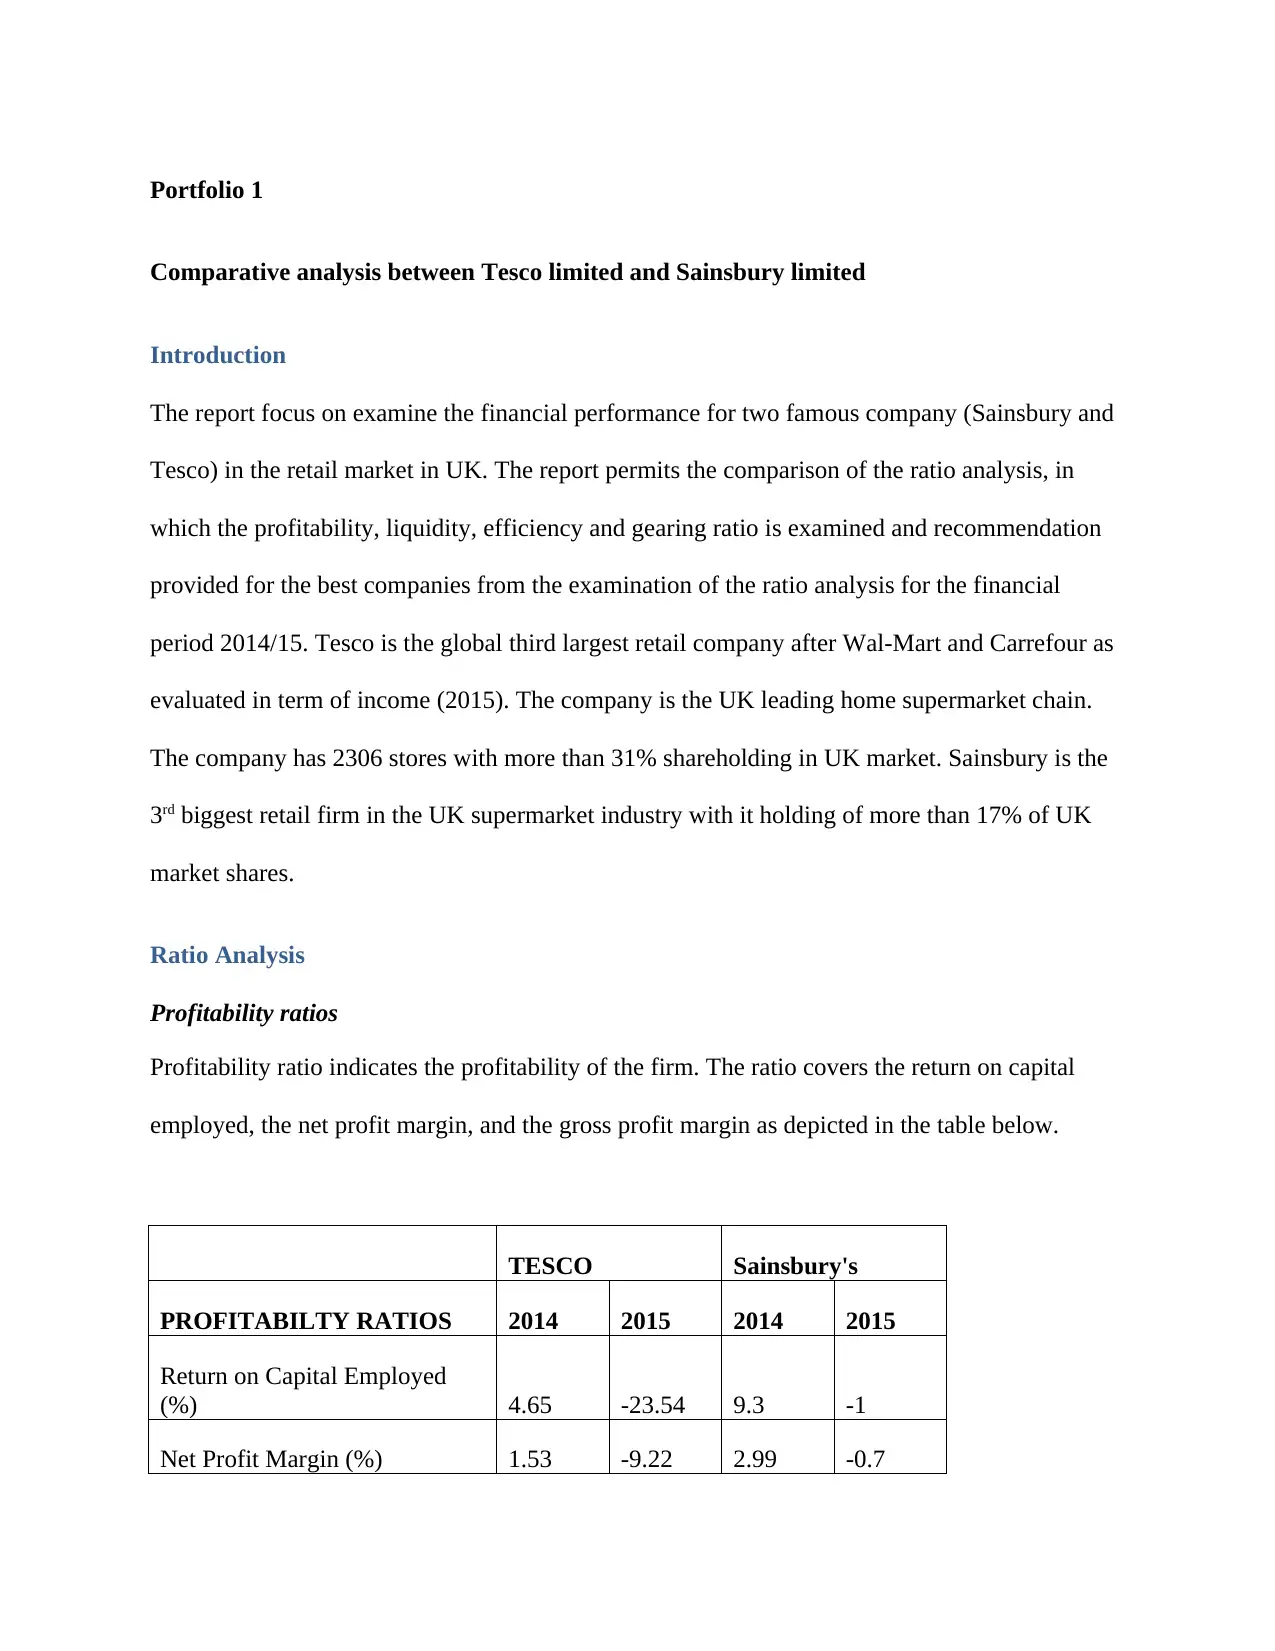
Profitability ratios
Profitability ratio indicates the profitability of the firm. The ratio covers the return on capital
employed, the net profit margin, and the gross profit margin as depicted in the table below.
TESCO Sainsbury's
PROFITABILTY RATIOS 2014 2015 2014 2015
Return on Capital Employed
(%) 4.65 -23.54 9.3 -1
Net Profit Margin (%) 1.53 -9.22 2.99 -0.7
Comparative analysis between Tesco limited and Sainsbury limited
Introduction
The report focus on examine the financial performance for two famous company (Sainsbury and
Tesco) in the retail market in UK. The report permits the comparison of the ratio analysis, in
which the profitability, liquidity, efficiency and gearing ratio is examined and recommendation
provided for the best companies from the examination of the ratio analysis for the financial
period 2014/15. Tesco is the global third largest retail company after Wal-Mart and Carrefour as
evaluated in term of income (2015). The company is the UK leading home supermarket chain.
The company has 2306 stores with more than 31% shareholding in UK market. Sainsbury is the
3rd biggest retail firm in the UK supermarket industry with it holding of more than 17% of UK
market shares.
Ratio Analysis
Profitability ratios
Profitability ratio indicates the profitability of the firm. The ratio covers the return on capital
employed, the net profit margin, and the gross profit margin as depicted in the table below.
TESCO Sainsbury's
PROFITABILTY RATIOS 2014 2015 2014 2015
Return on Capital Employed
(%) 4.65 -23.54 9.3 -1
Net Profit Margin (%) 1.53 -9.22 2.99 -0.7
Paraphrase This Document
Need a fresh take? Get an instant paraphrase of this document with our AI Paraphraser
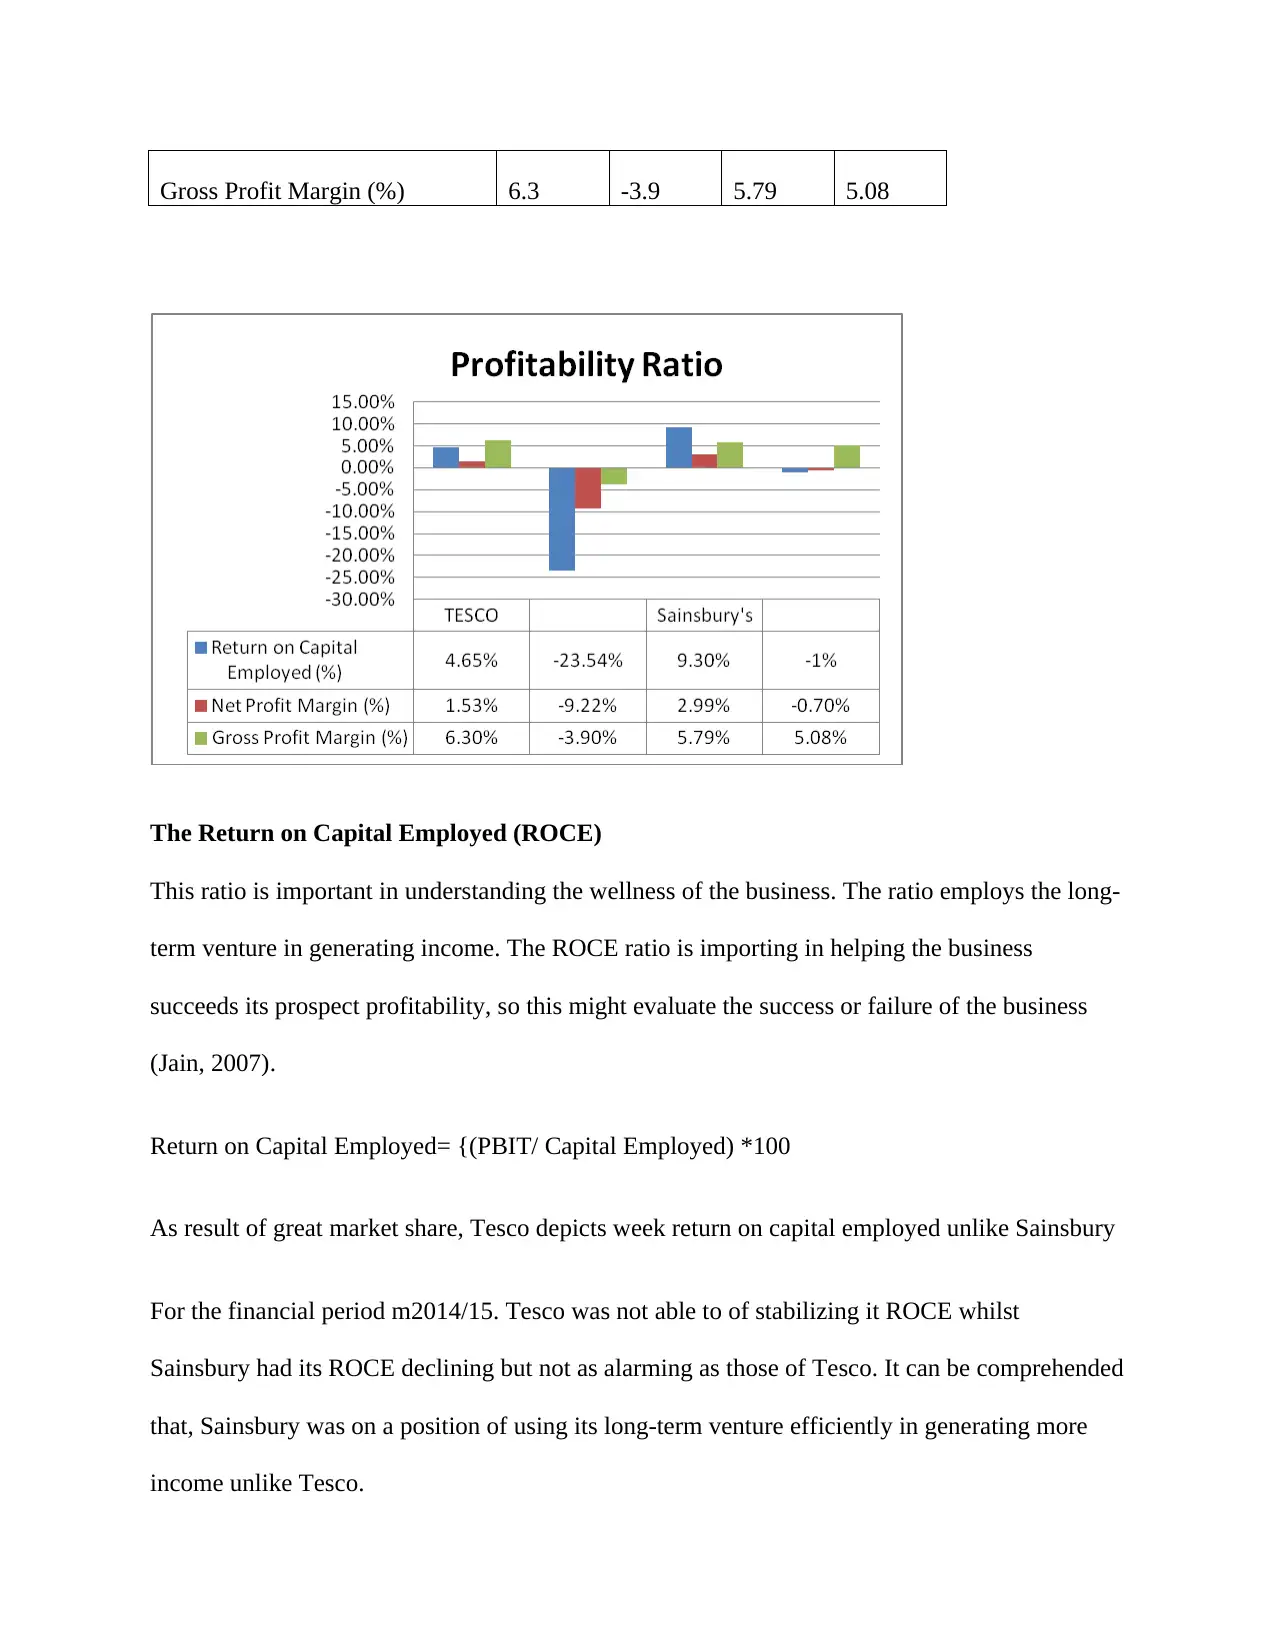
Gross Profit Margin (%) 6.3 -3.9 5.79 5.08
The Return on Capital Employed (ROCE)
This ratio is important in understanding the wellness of the business. The ratio employs the long-
term venture in generating income. The ROCE ratio is importing in helping the business
succeeds its prospect profitability, so this might evaluate the success or failure of the business
(Jain, 2007).
Return on Capital Employed= {(PBIT/ Capital Employed) *100
As result of great market share, Tesco depicts week return on capital employed unlike Sainsbury
For the financial period m2014/15. Tesco was not able to of stabilizing it ROCE whilst
Sainsbury had its ROCE declining but not as alarming as those of Tesco. It can be comprehended
that, Sainsbury was on a position of using its long-term venture efficiently in generating more
income unlike Tesco.
Net Profit Margin
The net profit margin appraises the amount of every pounds of income for the business keeps
earning which implies that a 5% net margin signifies that the business depict a net income of
0.05 pounds.
Net profit Margin= {Net income/sales)*100}
Specifically, the table above depict that Tesco’s profit margin was low unlike those of Sainsbury
for the financial period 2014/15, there was substantial plunge of Tesco’s profit margin from
1.53% to -9.22%. Sainsbury depict a decline in profit margin from 2.99% to -0.70%. In this
regards, it might be concluded that Sainsbury depict an ideal performance in terms of creating
income unlike Tesco for the financial period 2014/15.
Gross Profit Margin
The gross profit margin depicts the earning of the company after taking into consideration the
expense incurred by the business in producing the goods/service (Shi, 2001).
Gross Profit Margin = {Gross profit/ Sale Revenue}*100
From the table above, it can be observed that the gross profit margin for Sainsbury is much better
unlike for Tesco. Although Tesco depict a high portion of gross profit margin, there is a big
declining trend. Nevertheless, Sainsbury’s portion of gross profit margin is not as good as those
of Tesco limited.
⊘ This is a preview!⊘
Do you want full access?
Subscribe today to unlock all pages.
Trusted by 1+ million students worldwide
Concerning the gross profit margin, it can be appraised from the table above that Sainsbury
depict better performance. Although Tesco depict a high portion of gross profit margin, this
shows that the profit margin is decline very fast unlike those of Sainsbury. Nevertheless,
Sainsbury portion of gross profit is not as good as those of Tesco but it might be depicted that
Sainsbury had slight decline in gross profit for the financial period 2014/15. In this regards, as
much as Sainsbury depicted a slight decline in gross profit, the company overall, depicted an
improvement.
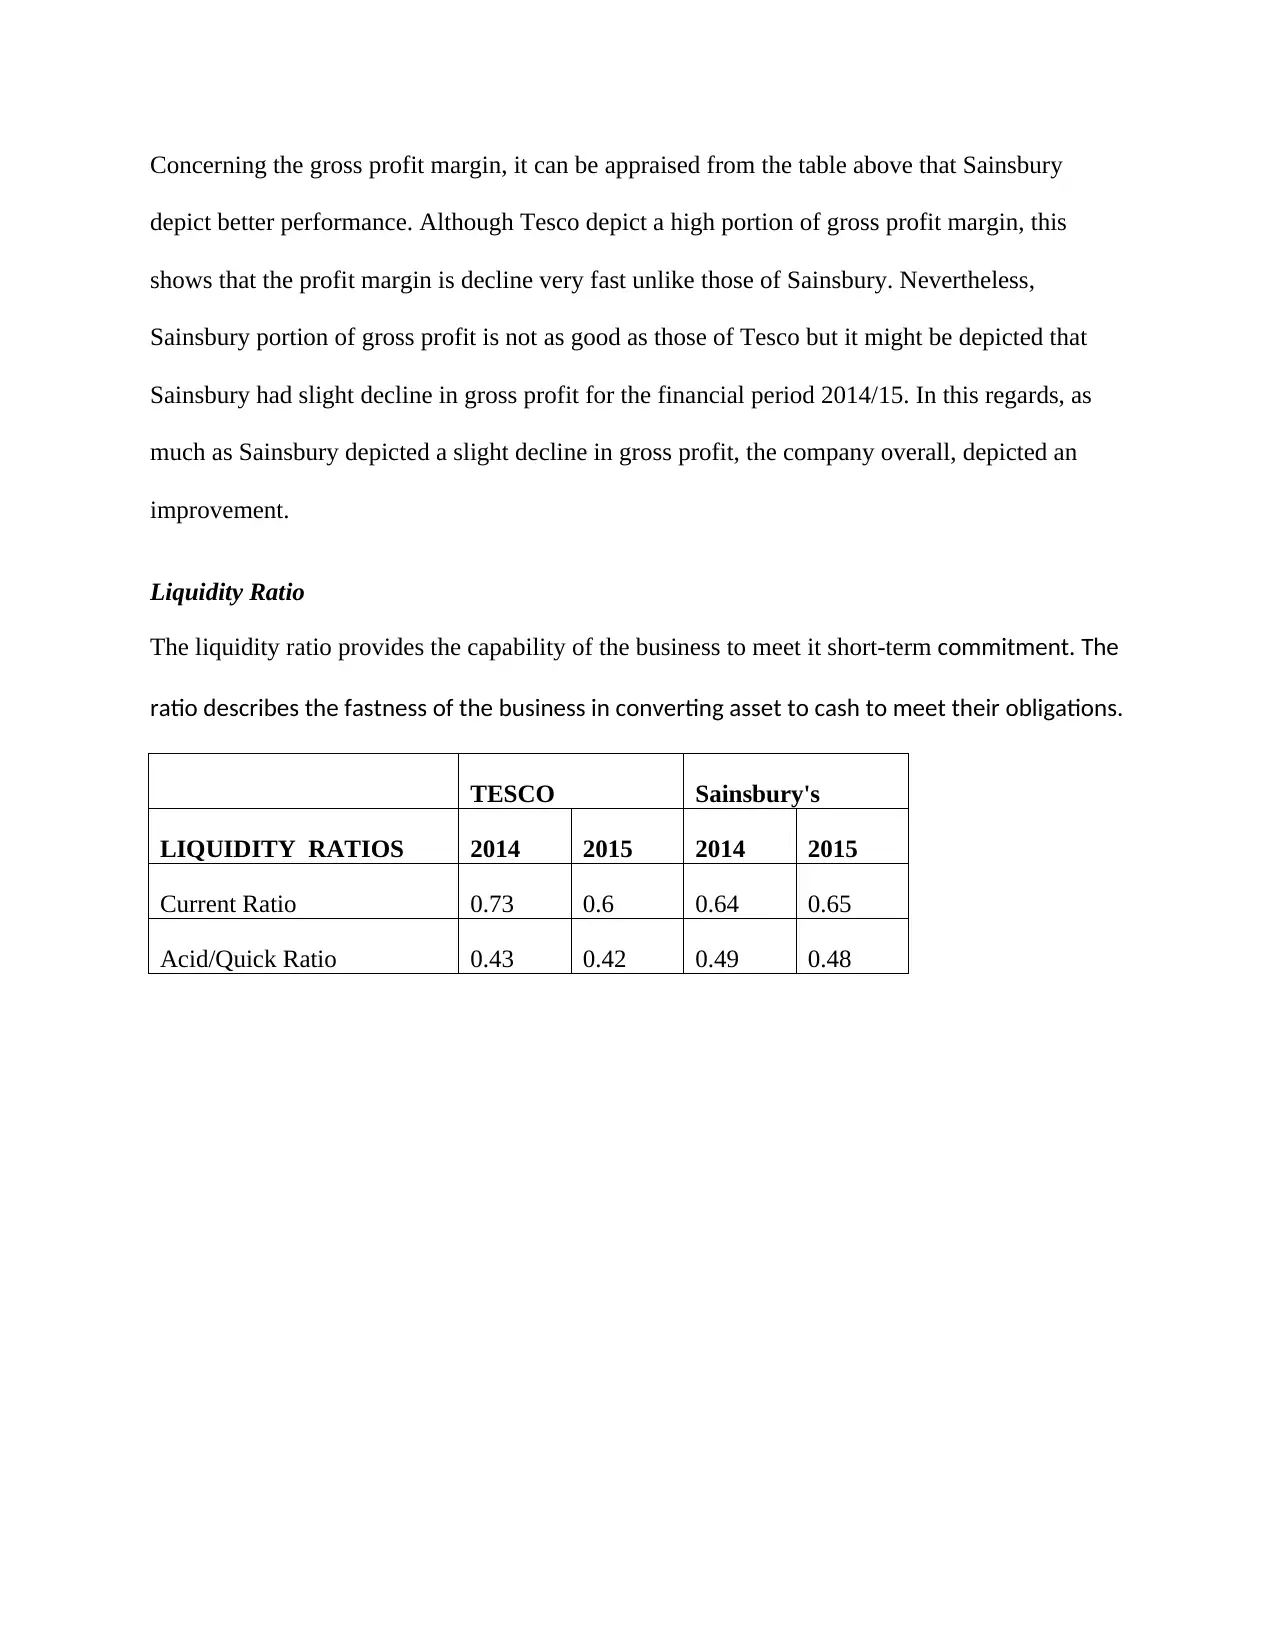
Liquidity Ratio
The liquidity ratio provides the capability of the business to meet it short-term commitment. The
ratio describes the fastness of the business in converting asset to cash to meet their obligations.
TESCO Sainsbury's
LIQUIDITY RATIOS 2014 2015 2014 2015
Current Ratio 0.73 0.6 0.64 0.65
Acid/Quick Ratio 0.43 0.42 0.49 0.48
depict better performance. Although Tesco depict a high portion of gross profit margin, this
shows that the profit margin is decline very fast unlike those of Sainsbury. Nevertheless,
Sainsbury portion of gross profit is not as good as those of Tesco but it might be depicted that
Sainsbury had slight decline in gross profit for the financial period 2014/15. In this regards, as
much as Sainsbury depicted a slight decline in gross profit, the company overall, depicted an
improvement.
Liquidity Ratio
The liquidity ratio provides the capability of the business to meet it short-term commitment. The
ratio describes the fastness of the business in converting asset to cash to meet their obligations.
TESCO Sainsbury's
LIQUIDITY RATIOS 2014 2015 2014 2015
Current Ratio 0.73 0.6 0.64 0.65
Acid/Quick Ratio 0.43 0.42 0.49 0.48
Paraphrase This Document
Need a fresh take? Get an instant paraphrase of this document with our AI Paraphraser
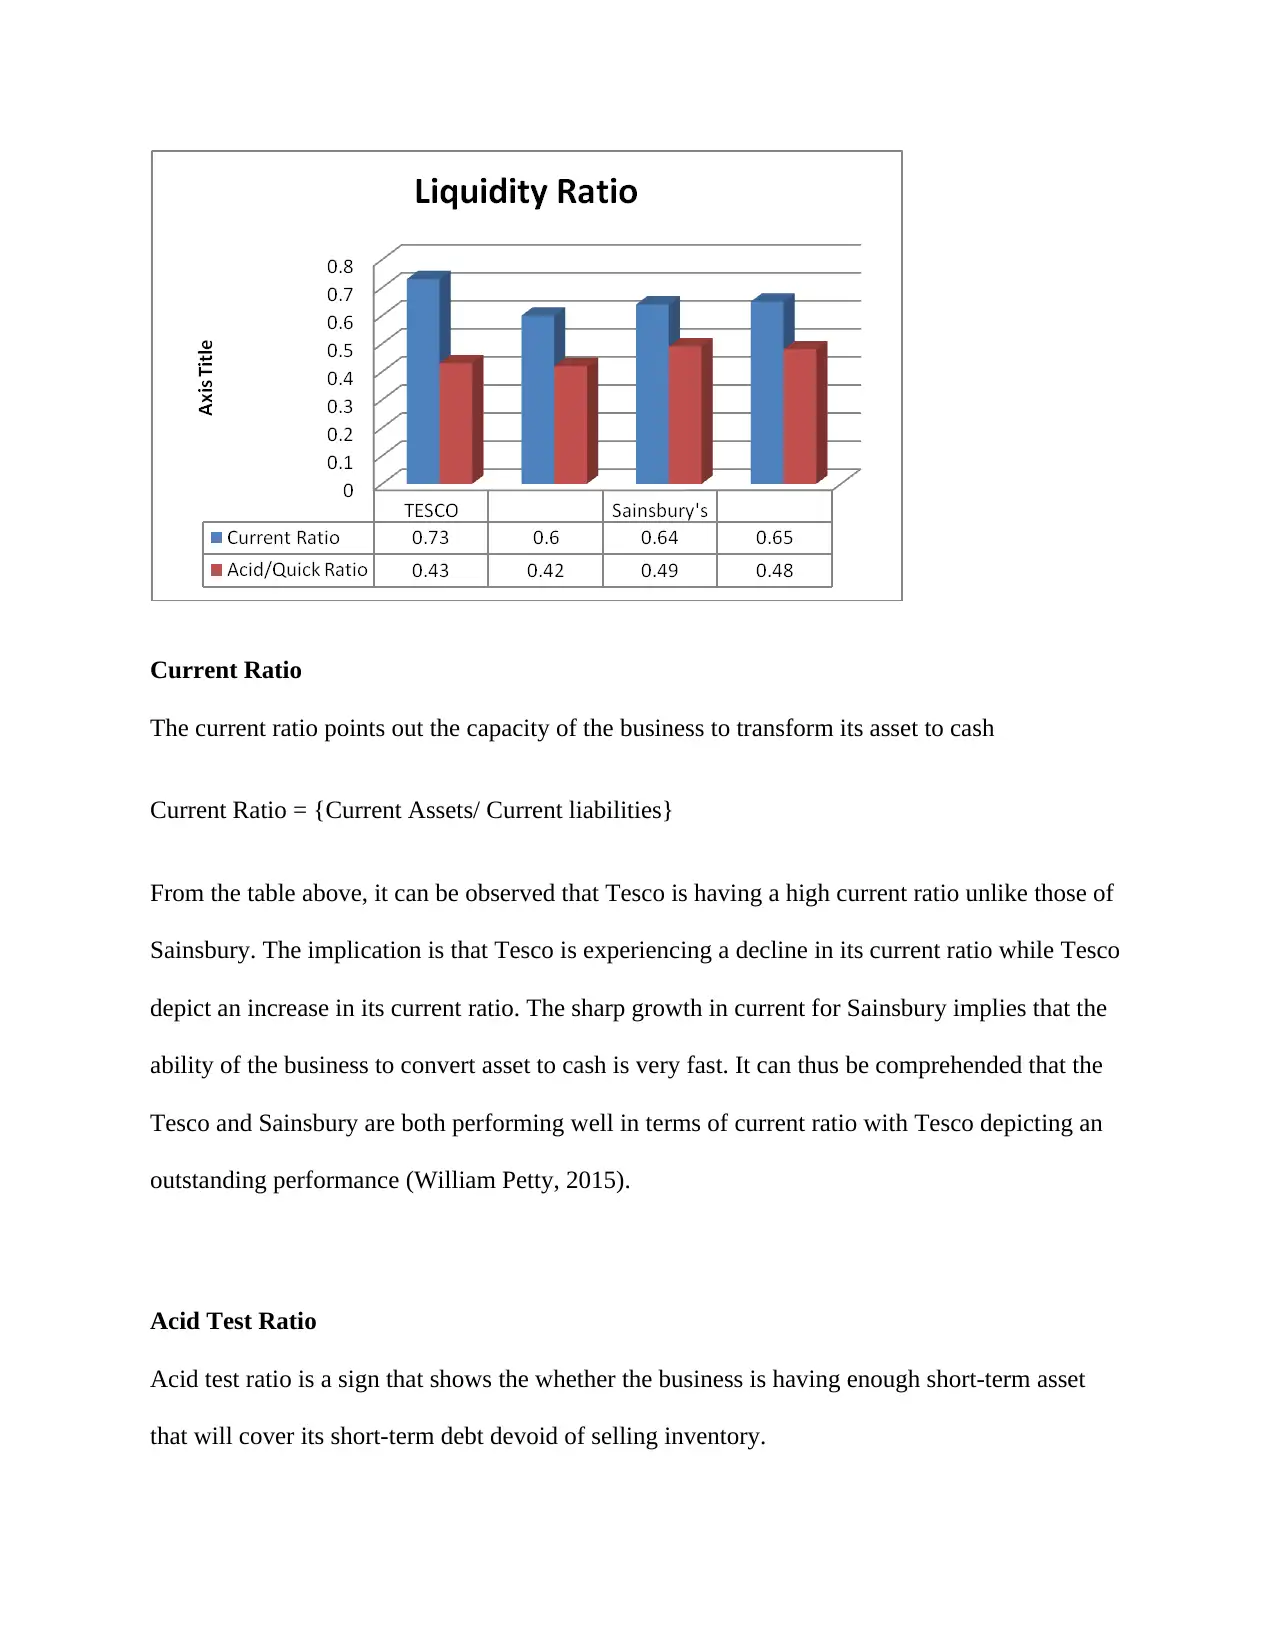
Current Ratio
The current ratio points out the capacity of the business to transform its asset to cash
Current Ratio = {Current Assets/ Current liabilities}
From the table above, it can be observed that Tesco is having a high current ratio unlike those of
Sainsbury. The implication is that Tesco is experiencing a decline in its current ratio while Tesco
depict an increase in its current ratio. The sharp growth in current for Sainsbury implies that the
ability of the business to convert asset to cash is very fast. It can thus be comprehended that the
Tesco and Sainsbury are both performing well in terms of current ratio with Tesco depicting an
outstanding performance (William Petty, 2015).
Acid Test Ratio
Acid test ratio is a sign that shows the whether the business is having enough short-term asset
that will cover its short-term debt devoid of selling inventory.
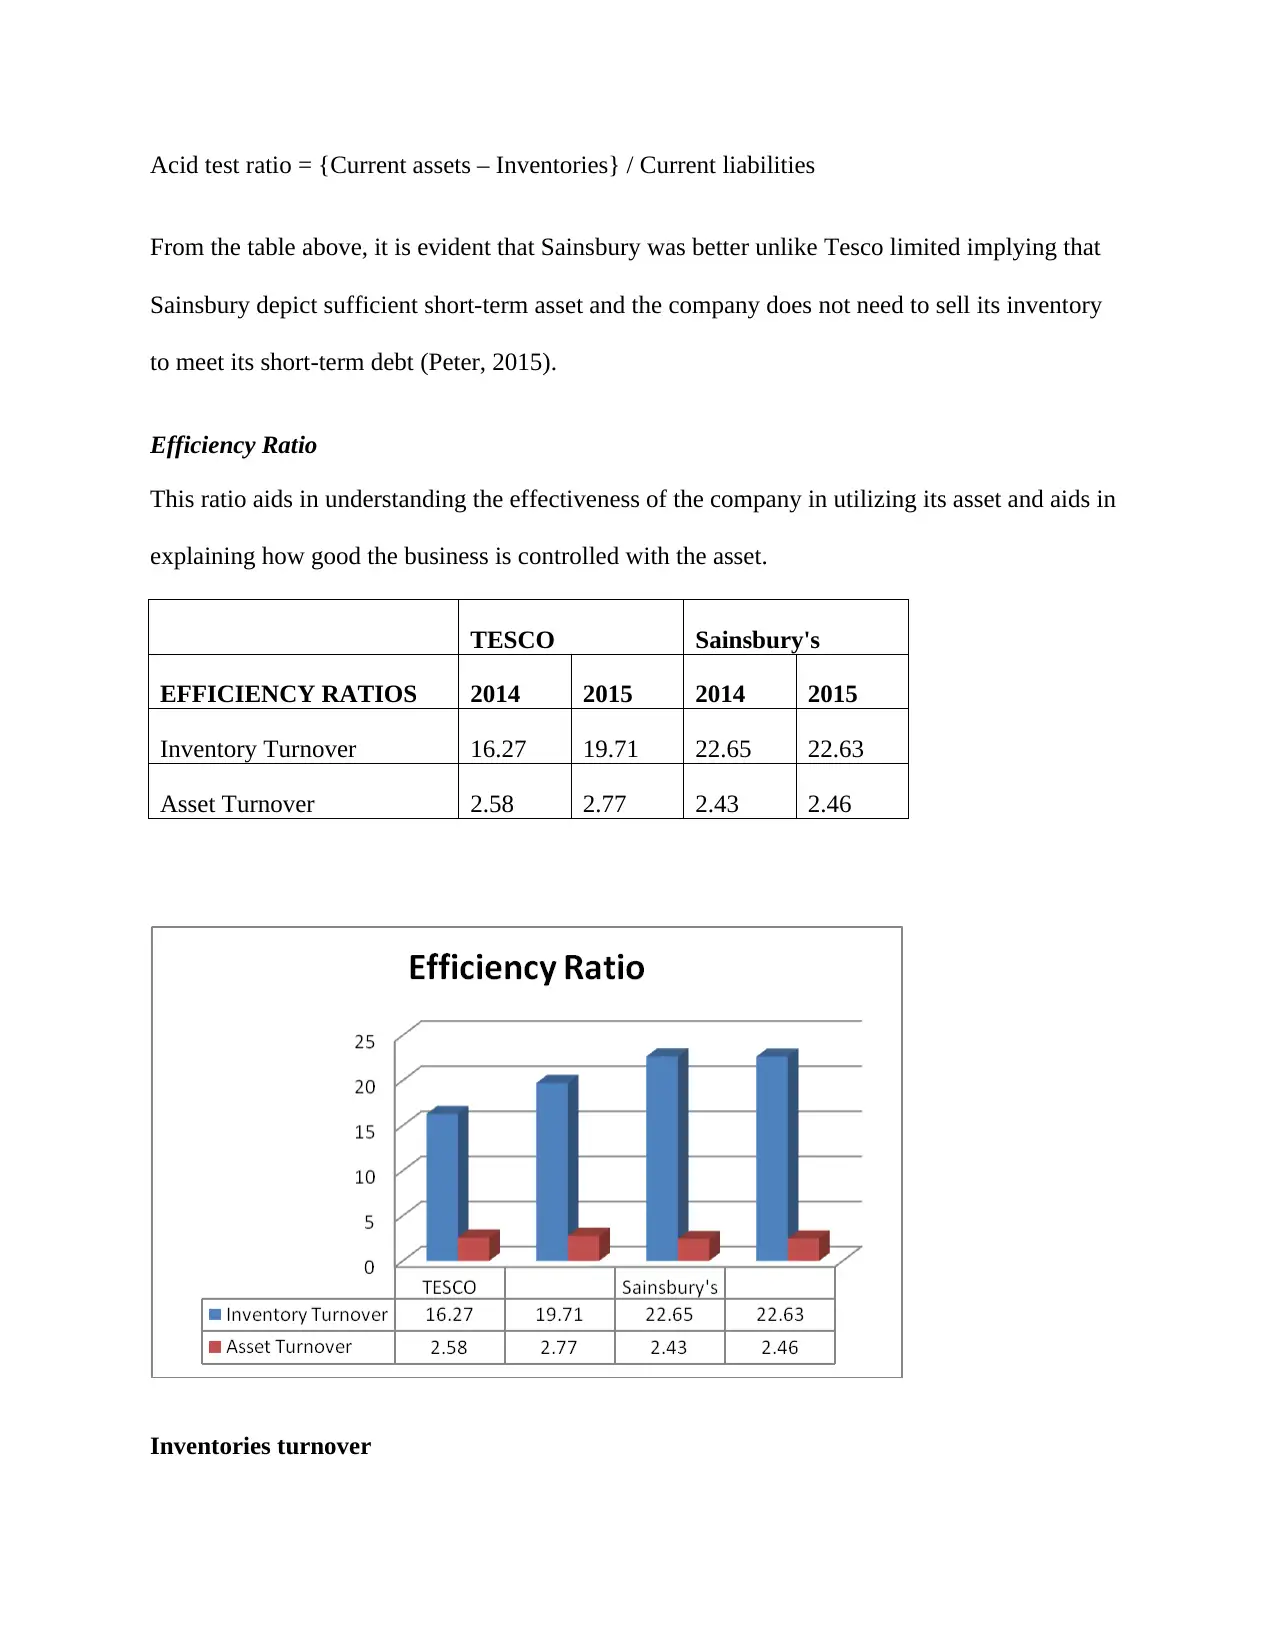
Acid test ratio = {Current assets – Inventories} / Current liabilities
From the table above, it is evident that Sainsbury was better unlike Tesco limited implying that
Sainsbury depict sufficient short-term asset and the company does not need to sell its inventory
to meet its short-term debt (Peter, 2015).
Efficiency Ratio
This ratio aids in understanding the effectiveness of the company in utilizing its asset and aids in
explaining how good the business is controlled with the asset.
TESCO Sainsbury's
EFFICIENCY RATIOS 2014 2015 2014 2015
Inventory Turnover 16.27 19.71 22.65 22.63
Asset Turnover 2.58 2.77 2.43 2.46
Inventories turnover
⊘ This is a preview!⊘
Do you want full access?
Subscribe today to unlock all pages.
Trusted by 1+ million students worldwide
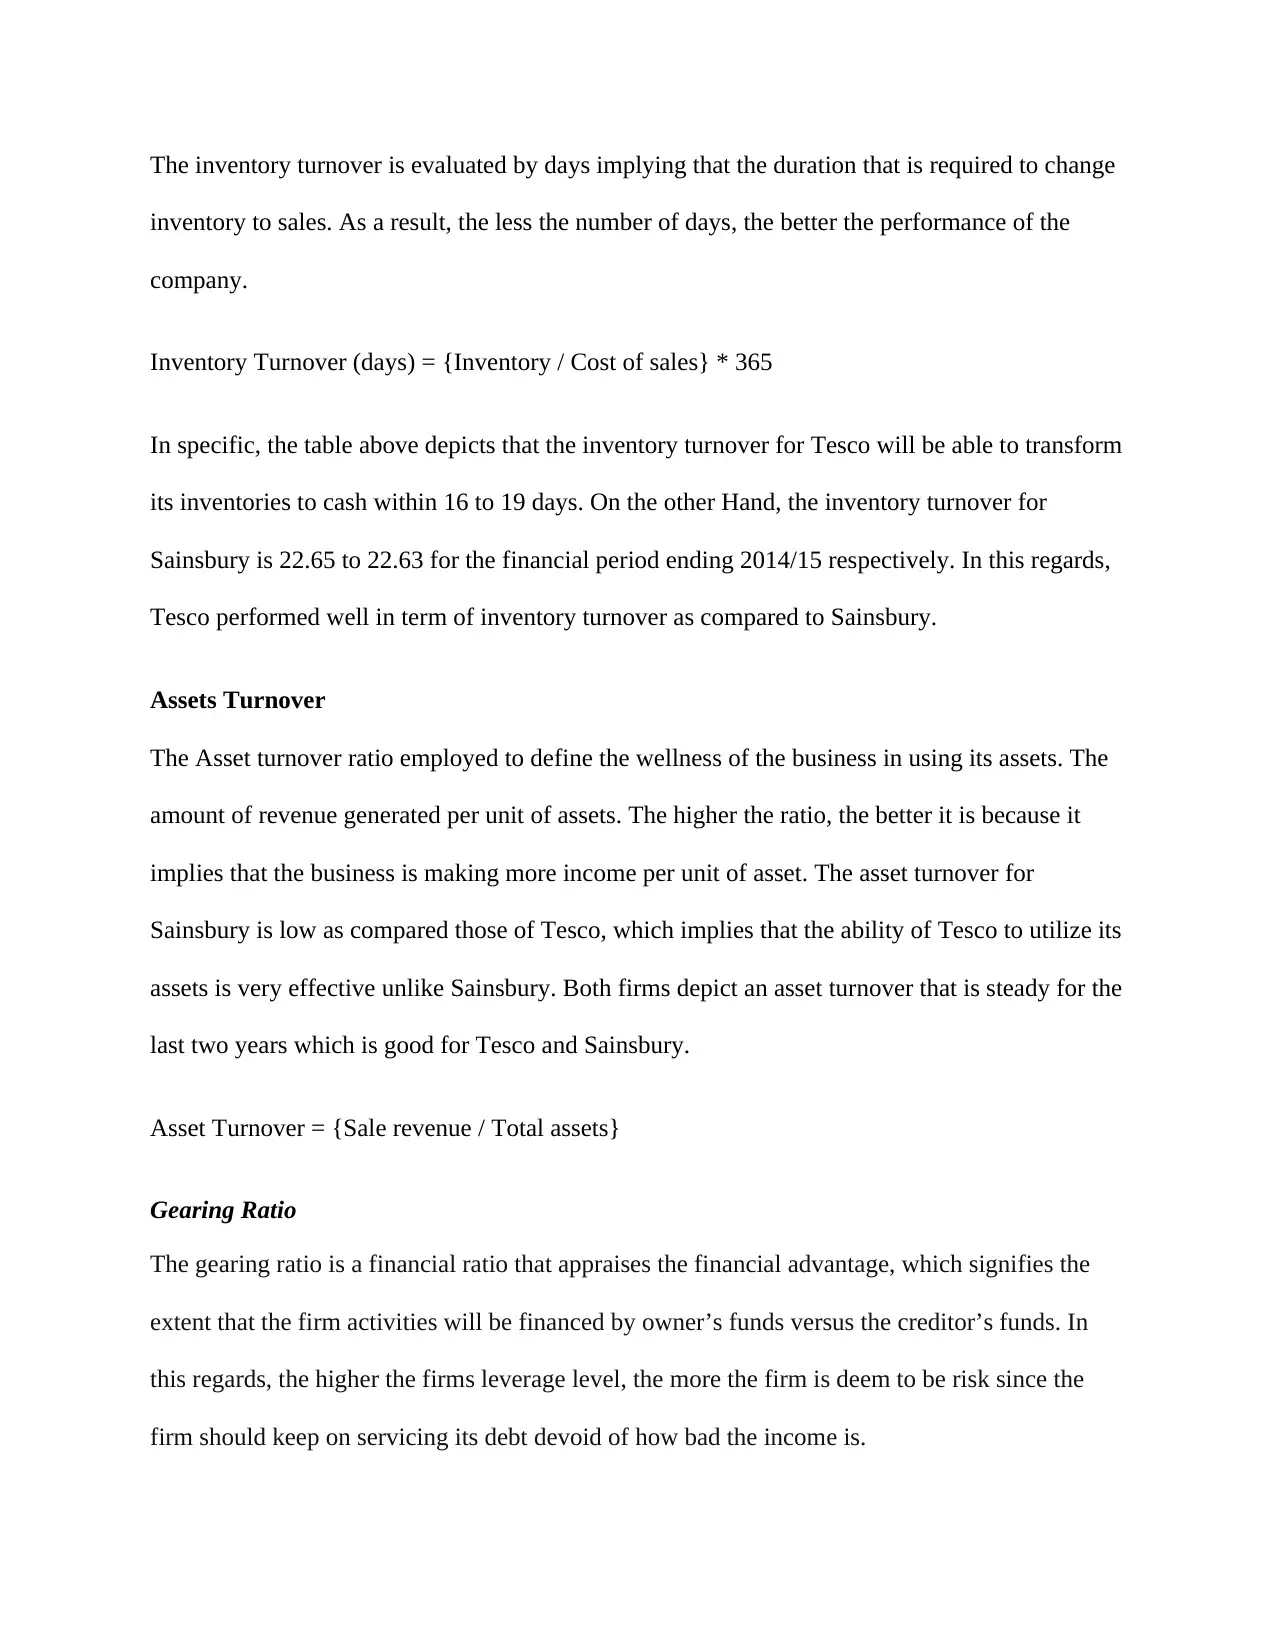
The inventory turnover is evaluated by days implying that the duration that is required to change
inventory to sales. As a result, the less the number of days, the better the performance of the
company.
Inventory Turnover (days) = {Inventory / Cost of sales} * 365
In specific, the table above depicts that the inventory turnover for Tesco will be able to transform
its inventories to cash within 16 to 19 days. On the other Hand, the inventory turnover for
Sainsbury is 22.65 to 22.63 for the financial period ending 2014/15 respectively. In this regards,
Tesco performed well in term of inventory turnover as compared to Sainsbury.
Assets Turnover
The Asset turnover ratio employed to define the wellness of the business in using its assets. The
amount of revenue generated per unit of assets. The higher the ratio, the better it is because it
implies that the business is making more income per unit of asset. The asset turnover for
Sainsbury is low as compared those of Tesco, which implies that the ability of Tesco to utilize its
assets is very effective unlike Sainsbury. Both firms depict an asset turnover that is steady for the
last two years which is good for Tesco and Sainsbury.
Asset Turnover = {Sale revenue / Total assets}
Gearing Ratio
The gearing ratio is a financial ratio that appraises the financial advantage, which signifies the
extent that the firm activities will be financed by owner’s funds versus the creditor’s funds. In
this regards, the higher the firms leverage level, the more the firm is deem to be risk since the
firm should keep on servicing its debt devoid of how bad the income is.
Paraphrase This Document
Need a fresh take? Get an instant paraphrase of this document with our AI Paraphraser
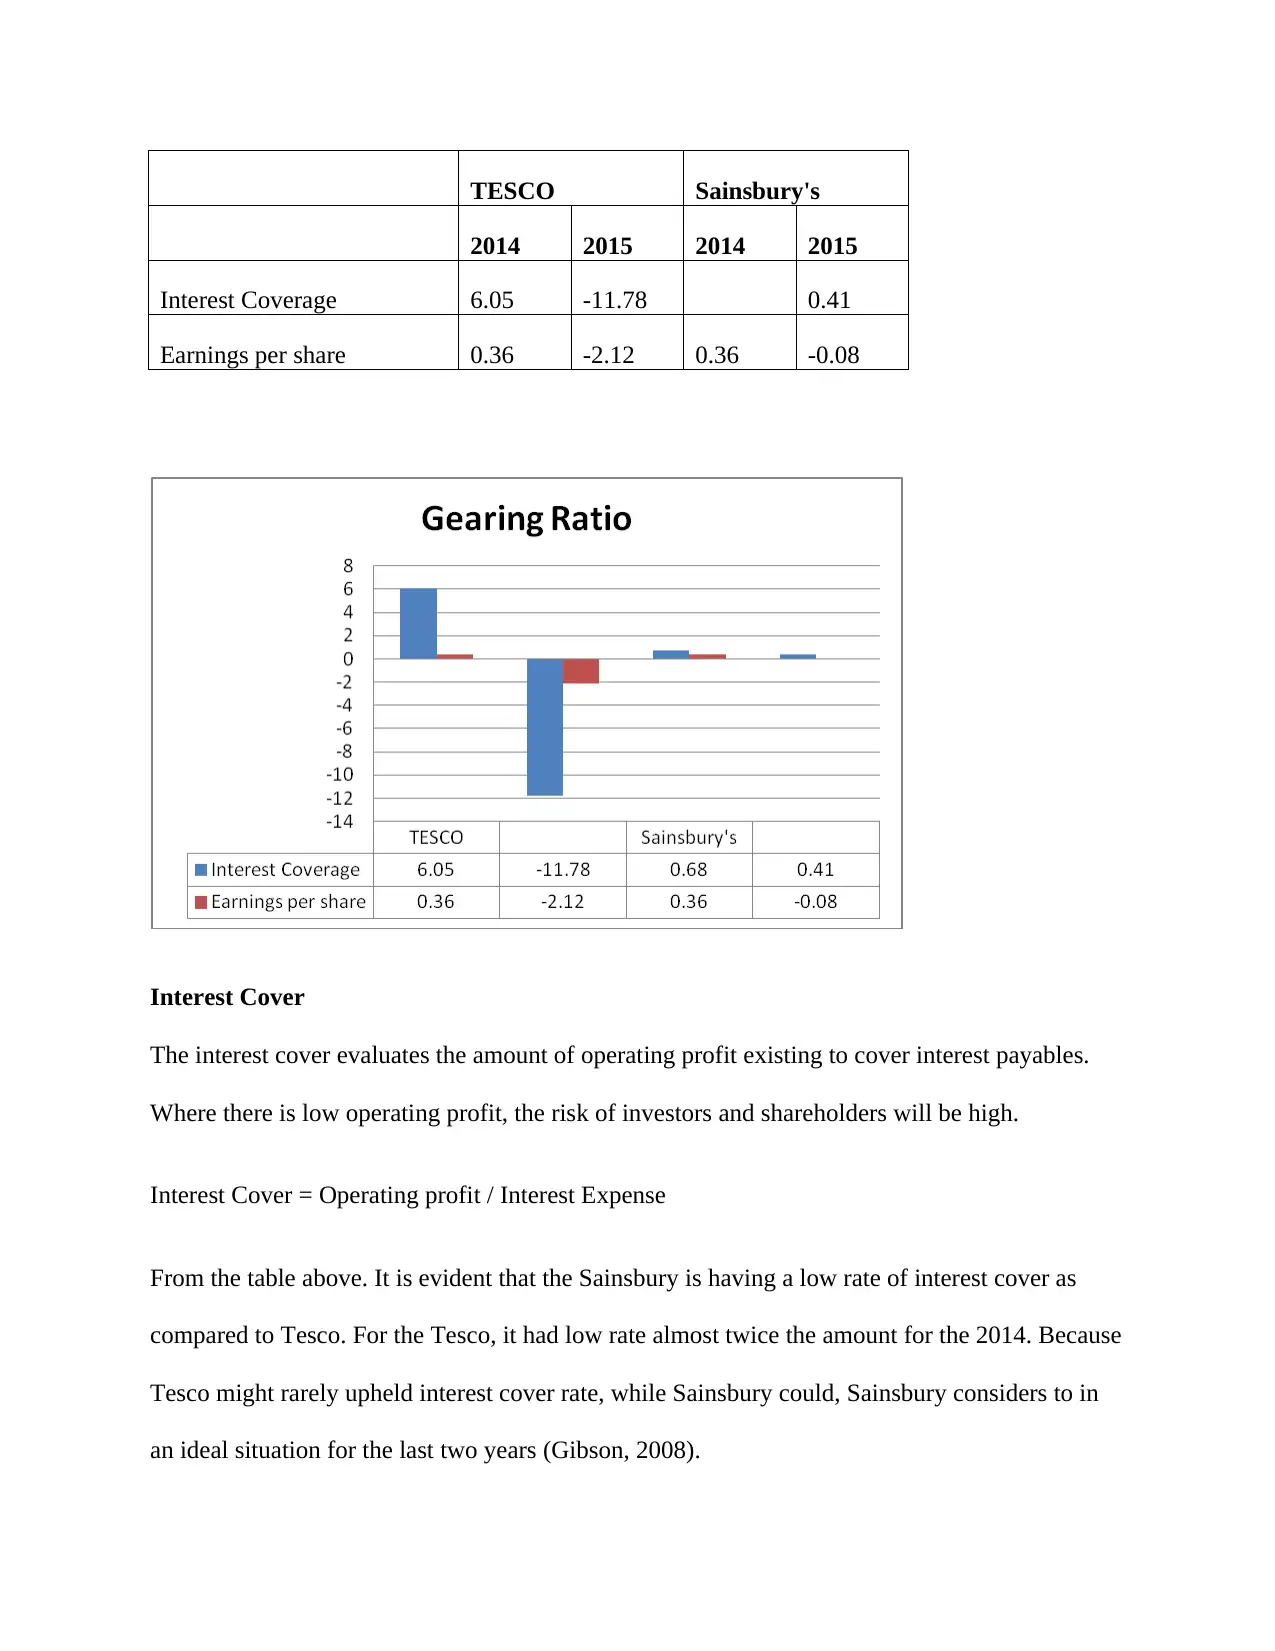
TESCO Sainsbury's
2014 2015 2014 2015
Interest Coverage 6.05 -11.78 0.41
Earnings per share 0.36 -2.12 0.36 -0.08
Interest Cover
The interest cover evaluates the amount of operating profit existing to cover interest payables.
Where there is low operating profit, the risk of investors and shareholders will be high.
Interest Cover = Operating profit / Interest Expense
From the table above. It is evident that the Sainsbury is having a low rate of interest cover as
compared to Tesco. For the Tesco, it had low rate almost twice the amount for the 2014. Because
Tesco might rarely upheld interest cover rate, while Sainsbury could, Sainsbury considers to in
an ideal situation for the last two years (Gibson, 2008).
Earnings per share
Earnings per share depict the amount shareholder will receive as derived at the end of financial
period. Where the company provides improved earning per share each financial period, depict
that the business is improving in terms of profitability and expansion.
EPS= {Earning attributable to ordinary shareholders/ Number of shareholders}
From the table above, it is evident that both Tesco and Sainsbury depict a decline in EPS with
Tesco depict the worst decline EPS. The general implication is that Sainsbury is having better
business performance unlike Tesco about profit creations and business growth.
Recommendations of how the financial performance of the poorly performing business can
be improved
The best option to examine the financial health of the business and identification of areas for
improvement is observing closely the financial ratios. The ratios employed in making
comparison between diverse aspects of a firm’s performance or how the business is performing
poorly. Ratios must be evaluated monthly in order to ensure that top changing tends in the
business are maintained (Damodaran, 2010). Even though there are diverse terms for diverse
ratios, the ratio falls into four basic classes as explained below.
Liquidity ratios
The ratio evaluates the liquidity of the business that will be available in covering the debts and
providing wide overview of the financial, health of the business. The current ratio evaluates the
ability of the business to create cash to meet its short-term debt while the quick ratio evaluates
the ability of the business to have cash to support its debt requirement. High quick ratio is a sign
⊘ This is a preview!⊘
Do you want full access?
Subscribe today to unlock all pages.
Trusted by 1+ million students worldwide
1 out of 19
Related Documents


Your All-in-One AI-Powered Toolkit for Academic Success.
+13062052269
info@desklib.com
Available 24*7 on WhatsApp / Email
![[object Object]](/_next/static/media/star-bottom.7253800d.svg)
Unlock your academic potential
Copyright © 2020–2026 A2Z Services. All Rights Reserved. Developed and managed by ZUCOL.