Managerial Finance Report: Financial Analysis of Tesco and Sainsbury's
VerifiedAdded on 2022/12/29
|18
|4416
|1
Report
AI Summary
This managerial finance report undertakes a comprehensive financial analysis of Tesco and Sainsbury's, two major players in the retail sector. The report begins with an introduction to managerial finance and provides background information on both companies. It then proceeds to a detailed ratio analysis, examining current ratio, quick ratio, gross profit margin, net profit margin, price-earning ratio, gearing ratio, return on capital employed, and inventory turnover ratio for the years 2018 and 2019. The analysis includes graphical representations and interpretations of each ratio, comparing the financial health and performance of the two companies. Furthermore, the report explores the utilization and limitations of investment appraisal techniques for project selection. The report concludes with recommendations based on the financial analysis and highlights the limitations of financial ratios and investment appraisal techniques. This report offers a valuable resource for understanding the financial dynamics of these retail giants and the application of key financial concepts.
Managerial
Finance
Finance
Paraphrase This Document
Need a fresh take? Get an instant paraphrase of this document with our AI Paraphraser
Table of Contents
INTRODUCTION...........................................................................................................................1
PORTFOLIO 1.................................................................................................................................1
Ratio analysis:..............................................................................................................................1
Analysis of financial position of both entities by interpretation of ratio analysis:......................3
Recommendations:.....................................................................................................................10
Limitations associated with financial ratios:..............................................................................11
PORTFOLIO 2...............................................................................................................................11
Utilization of appropriate techniques of investment appraisal for advising project that is should
be opted:.....................................................................................................................................11
Limitations of utilizing investment appraisal techniques:.........................................................13
CONCLUSION..............................................................................................................................14
REFERENCES..............................................................................................................................15
INTRODUCTION
Finance can be elaborated as activities that links banking, credit or debt, capital markets,
investments etc. The term 'finance' is an essential element for business as it focuses on creation
and management of money which enables expansion of an entity. Hence, financing is a
procedure of providing monetary value for activities of an organization for purchase or
investment purpose. Managerial finance can be described as that branch of finance which is
concerned towards managerial applications for techniques of finance. It enables value creation
with adequate allocation of resources (Agyei-Mensah and Buertey, 2019). Basis of this report is
analysis of managerial finance in context to Tesco and Sainsbury's. Tesco is a multinational firm
that serves in the sector of retailing. It is founded in 1919 and founder of this organization is Jack
Cohen. Firm is based in England, United Kingdom. Sainsbury's is a retailing entity which was
founded by John James Sainsbury's in 1869. Sainsbury's is based in London, United Kingdom.
This report consists ratio analysis of both organizations along with its interpretation,
graphs, recommendations and limitations. Further, investment appraisal techniques are applied
for selection of appropriate project and its limitations are described.
PORTFOLIO 1
Ratio analysis:
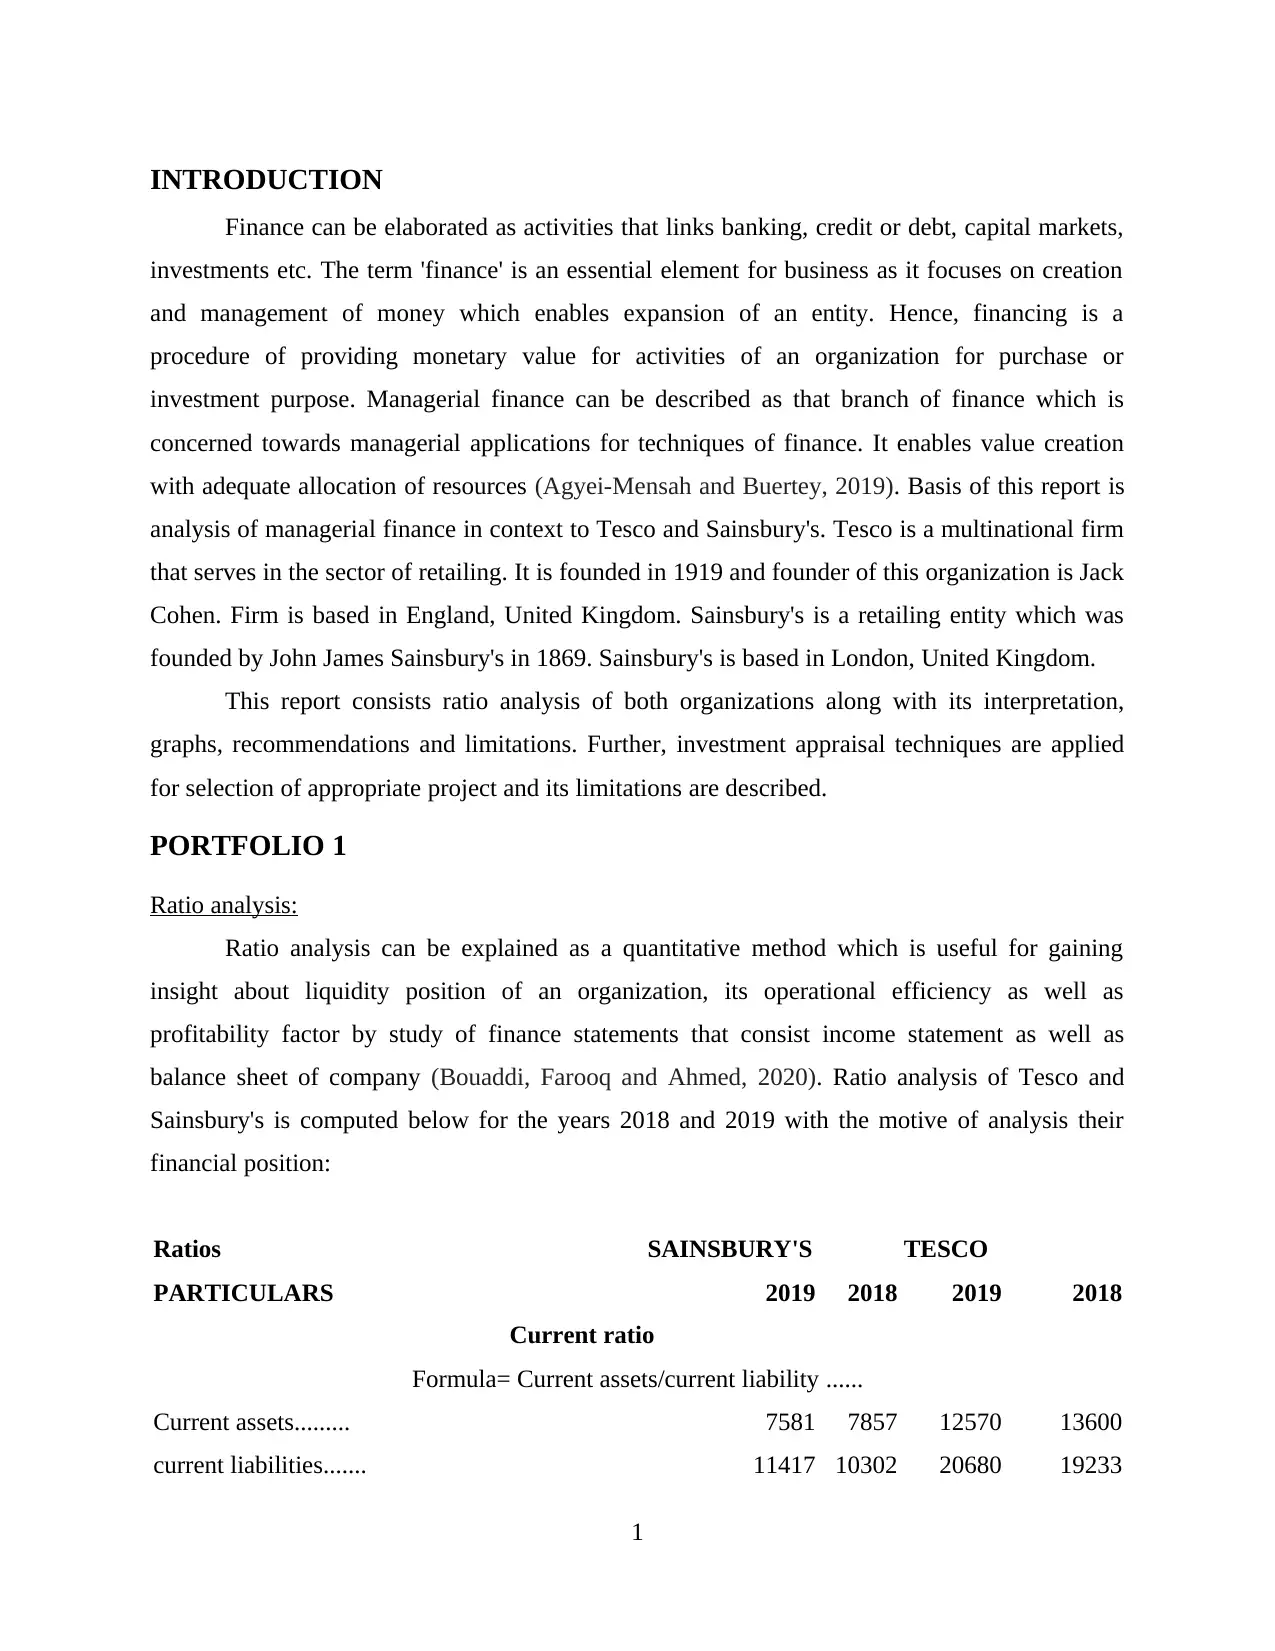
Ratio analysis can be explained as a quantitative method which is useful for gaining
insight about liquidity position of an organization, its operational efficiency as well as
profitability factor by study of finance statements that consist income statement as well as
balance sheet of company (Bouaddi, Farooq and Ahmed, 2020). Ratio analysis of Tesco and
Sainsbury's is computed below for the years 2018 and 2019 with the motive of analysis their
financial position:
Ratios SAINSBURY'S TESCO
PARTICULARS 2019 2018 2019 2018
Current ratio
Formula= Current assets/current liability ......
Current assets......... 7581 7857 12570 13600
current liabilities....... 11417 10302 20680 19233
1
Finance can be elaborated as activities that links banking, credit or debt, capital markets,
investments etc. The term 'finance' is an essential element for business as it focuses on creation
and management of money which enables expansion of an entity. Hence, financing is a
procedure of providing monetary value for activities of an organization for purchase or
investment purpose. Managerial finance can be described as that branch of finance which is
concerned towards managerial applications for techniques of finance. It enables value creation
with adequate allocation of resources (Agyei-Mensah and Buertey, 2019). Basis of this report is
analysis of managerial finance in context to Tesco and Sainsbury's. Tesco is a multinational firm
that serves in the sector of retailing. It is founded in 1919 and founder of this organization is Jack
Cohen. Firm is based in England, United Kingdom. Sainsbury's is a retailing entity which was
founded by John James Sainsbury's in 1869. Sainsbury's is based in London, United Kingdom.
This report consists ratio analysis of both organizations along with its interpretation,
graphs, recommendations and limitations. Further, investment appraisal techniques are applied
for selection of appropriate project and its limitations are described.
PORTFOLIO 1
Ratio analysis:
Ratio analysis can be explained as a quantitative method which is useful for gaining
insight about liquidity position of an organization, its operational efficiency as well as
profitability factor by study of finance statements that consist income statement as well as
balance sheet of company (Bouaddi, Farooq and Ahmed, 2020). Ratio analysis of Tesco and
Sainsbury's is computed below for the years 2018 and 2019 with the motive of analysis their
financial position:
Ratios SAINSBURY'S TESCO
PARTICULARS 2019 2018 2019 2018
Current ratio
Formula= Current assets/current liability ......
Current assets......... 7581 7857 12570 13600
current liabilities....... 11417 10302 20680 19233
1
⊘ This is a preview!⊘
Do you want full access?
Subscribe today to unlock all pages.
Trusted by 1+ million students worldwide
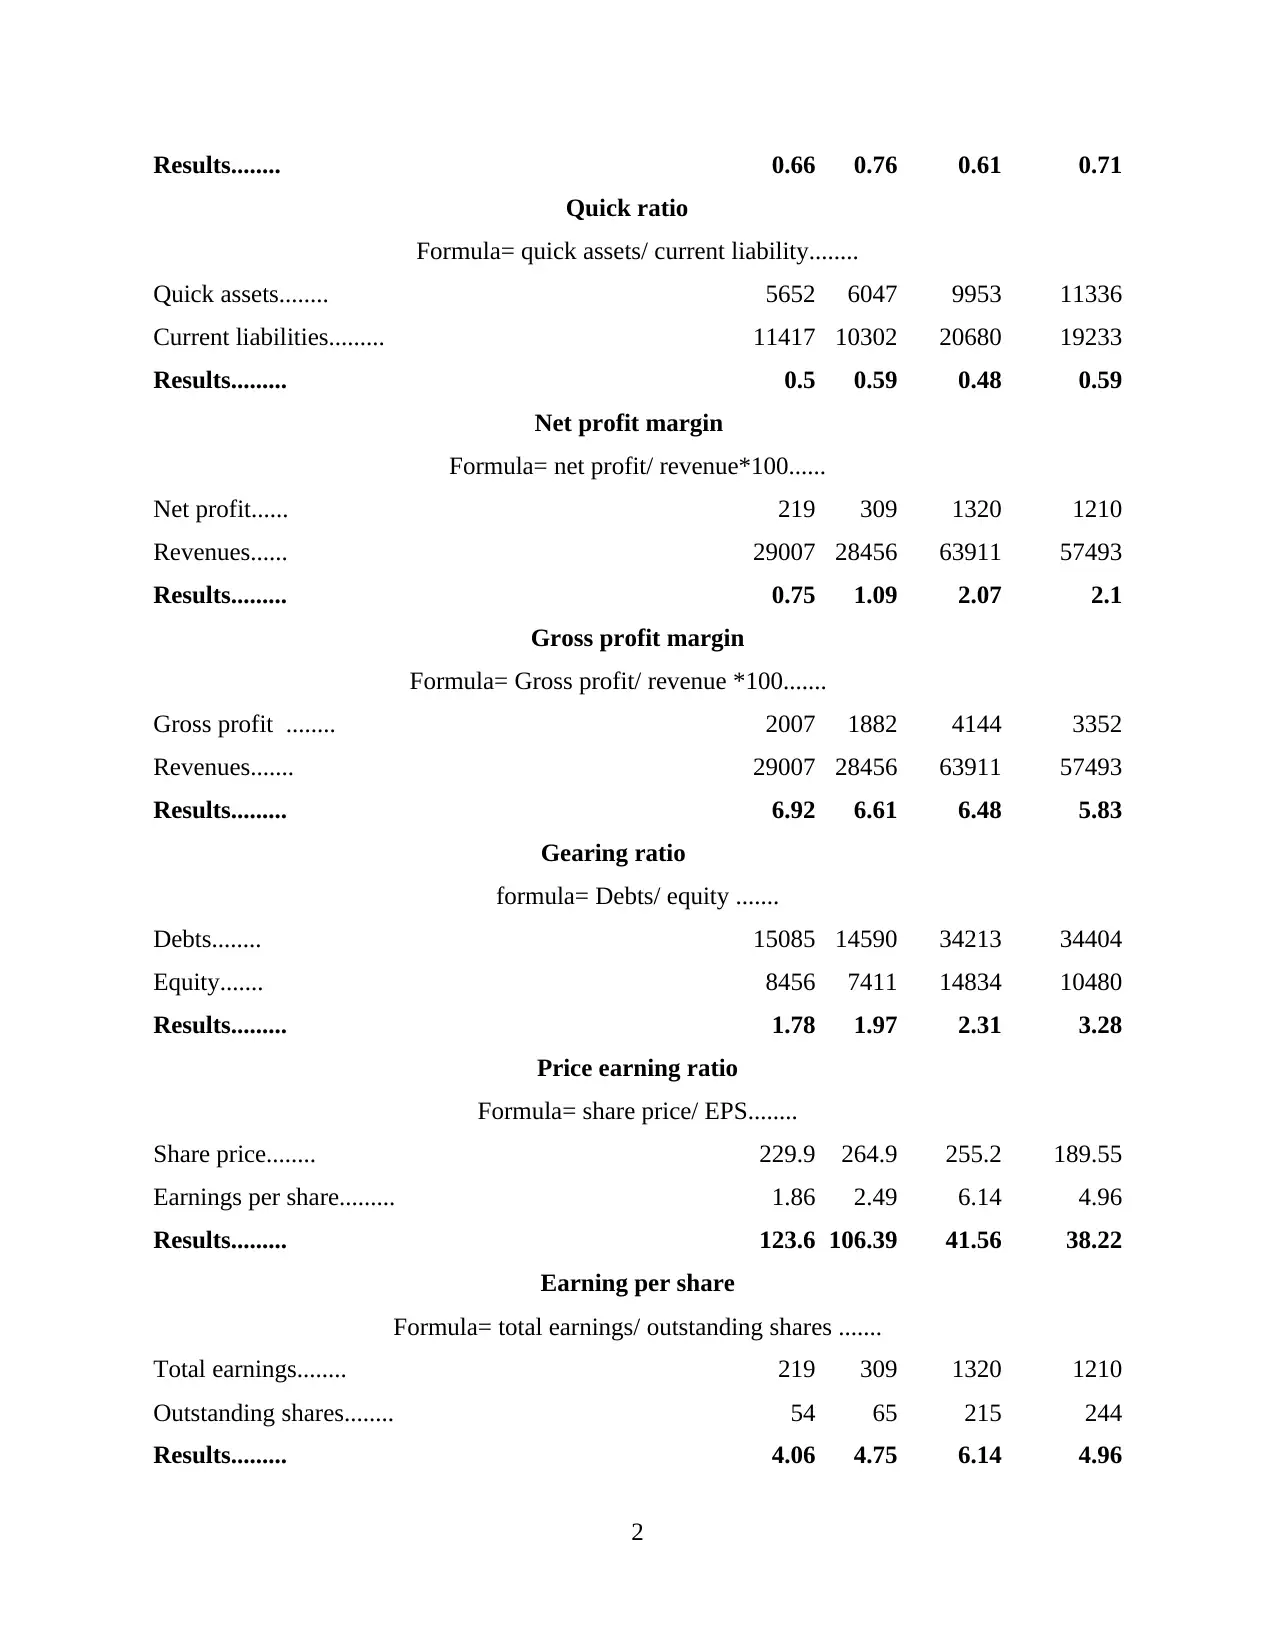
Results........ 0.66 0.76 0.61 0.71
Quick ratio
Formula= quick assets/ current liability........
Quick assets........ 5652 6047 9953 11336
Current liabilities......... 11417 10302 20680 19233
Results......... 0.5 0.59 0.48 0.59
Net profit margin
Formula= net profit/ revenue*100......
Net profit...... 219 309 1320 1210
Revenues...... 29007 28456 63911 57493
Results......... 0.75 1.09 2.07 2.1
Gross profit margin
Formula= Gross profit/ revenue *100.......
Gross profit ........ 2007 1882 4144 3352
Revenues....... 29007 28456 63911 57493
Results......... 6.92 6.61 6.48 5.83
Gearing ratio
formula= Debts/ equity .......
Debts........ 15085 14590 34213 34404
Equity....... 8456 7411 14834 10480
Results......... 1.78 1.97 2.31 3.28
Price earning ratio
Formula= share price/ EPS........
Share price........ 229.9 264.9 255.2 189.55
Earnings per share......... 1.86 2.49 6.14 4.96
Results......... 123.6 106.39 41.56 38.22
Earning per share
Formula= total earnings/ outstanding shares .......
Total earnings........ 219 309 1320 1210
Outstanding shares........ 54 65 215 244
Results......... 4.06 4.75 6.14 4.96
2
Paraphrase This Document
Need a fresh take? Get an instant paraphrase of this document with our AI Paraphraser
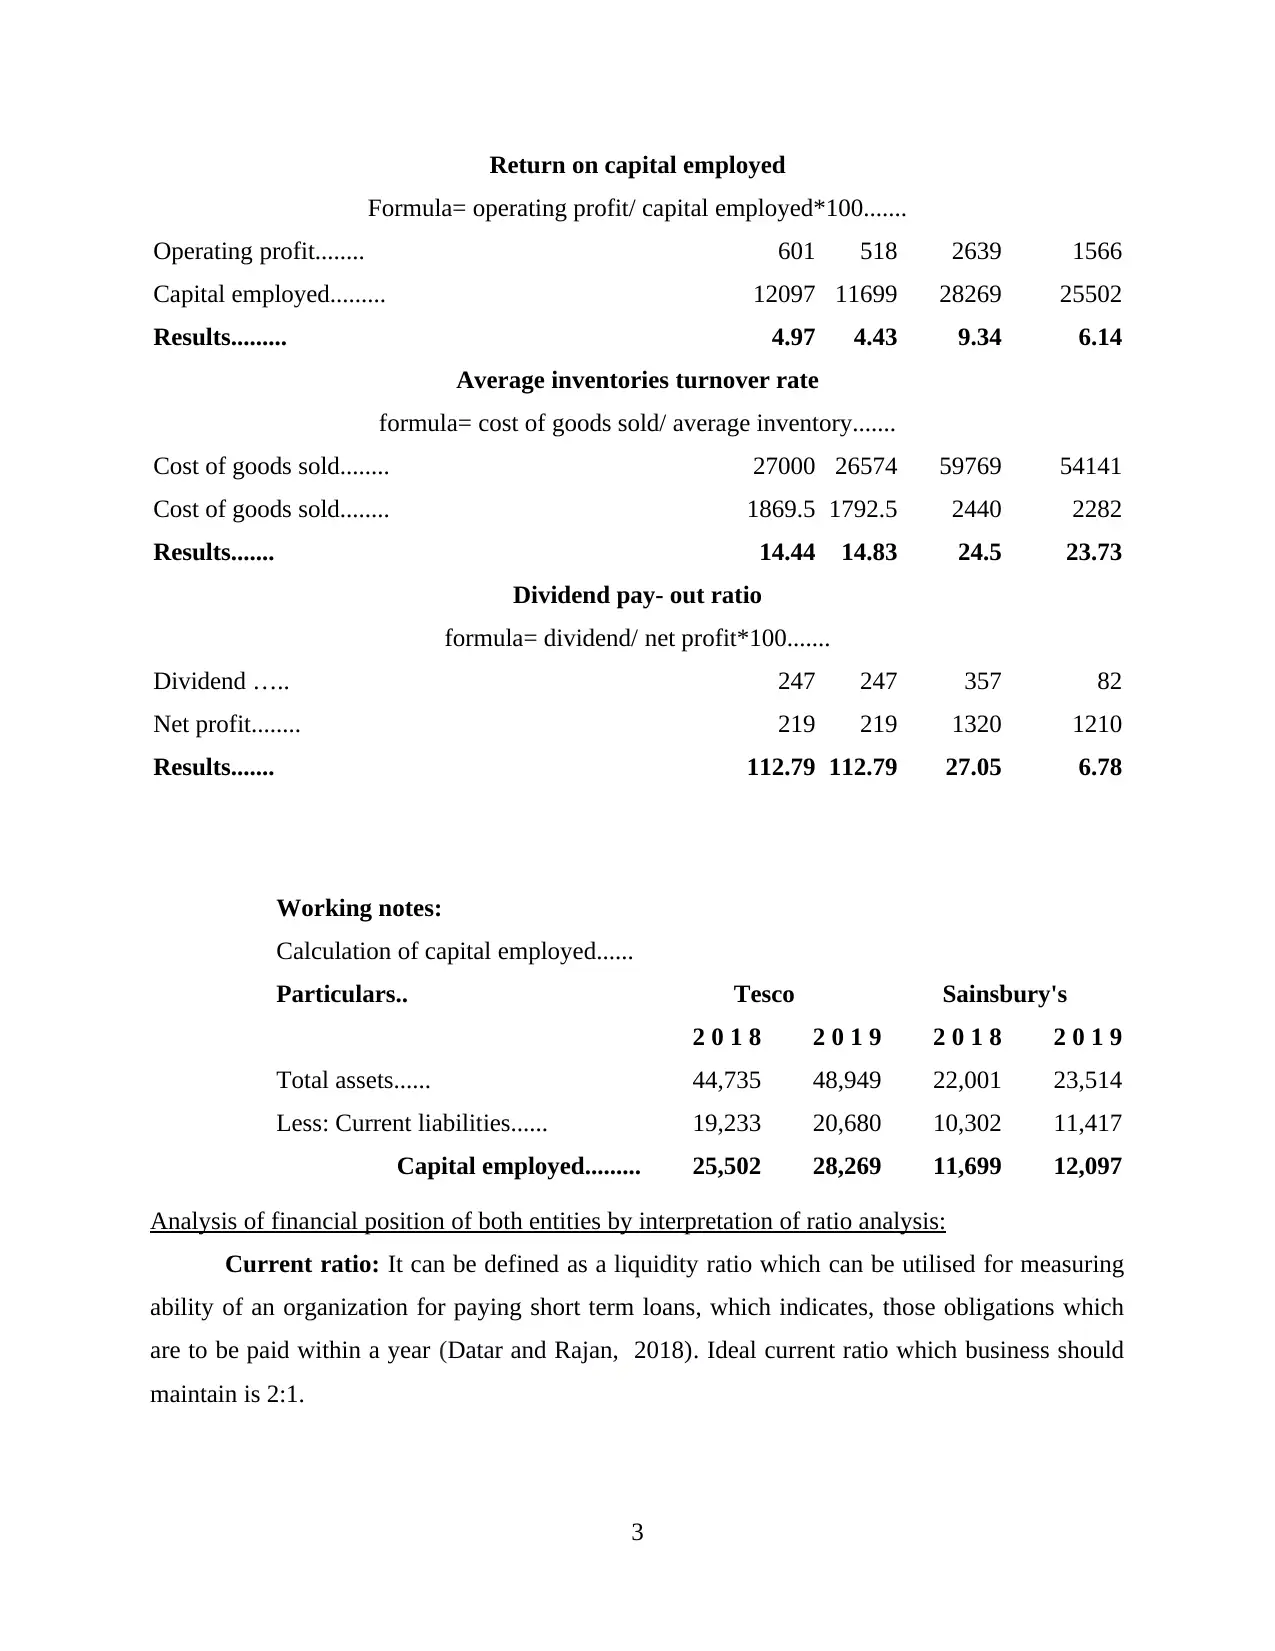
Return on capital employed
Formula= operating profit/ capital employed*100.......
Operating profit........ 601 518 2639 1566
Capital employed......... 12097 11699 28269 25502
Results......... 4.97 4.43 9.34 6.14
Average inventories turnover rate
formula= cost of goods sold/ average inventory.......
Cost of goods sold........ 27000 26574 59769 54141
Cost of goods sold........ 1869.5 1792.5 2440 2282
Results....... 14.44 14.83 24.5 23.73
Dividend pay- out ratio
formula= dividend/ net profit*100.......
Dividend ….. 247 247 357 82
Net profit........ 219 219 1320 1210
Results....... 112.79 112.79 27.05 6.78
Working notes:
Calculation of capital employed......
Particulars.. Tesco Sainsbury's
2 0 1 8 2 0 1 9 2 0 1 8 2 0 1 9
Total assets...... 44,735 48,949 22,001 23,514
Less: Current liabilities...... 19,233 20,680 10,302 11,417
Capital employed......... 25,502 28,269 11,699 12,097
Analysis of financial position of both entities by interpretation of ratio analysis:
Current ratio: It can be defined as a liquidity ratio which can be utilised for measuring
ability of an organization for paying short term loans, which indicates, those obligations which
are to be paid within a year (Datar and Rajan, 2018). Ideal current ratio which business should
maintain is 2:1.
3
Tes c o
S a in s b u ry
0
0 .2
0 .4
0 .6
0 .8 0 .7 1 0 .7 6
0 .6 1 0 .6 6
C u rre n t ra tio
2 0 1 8 2 0 1 9
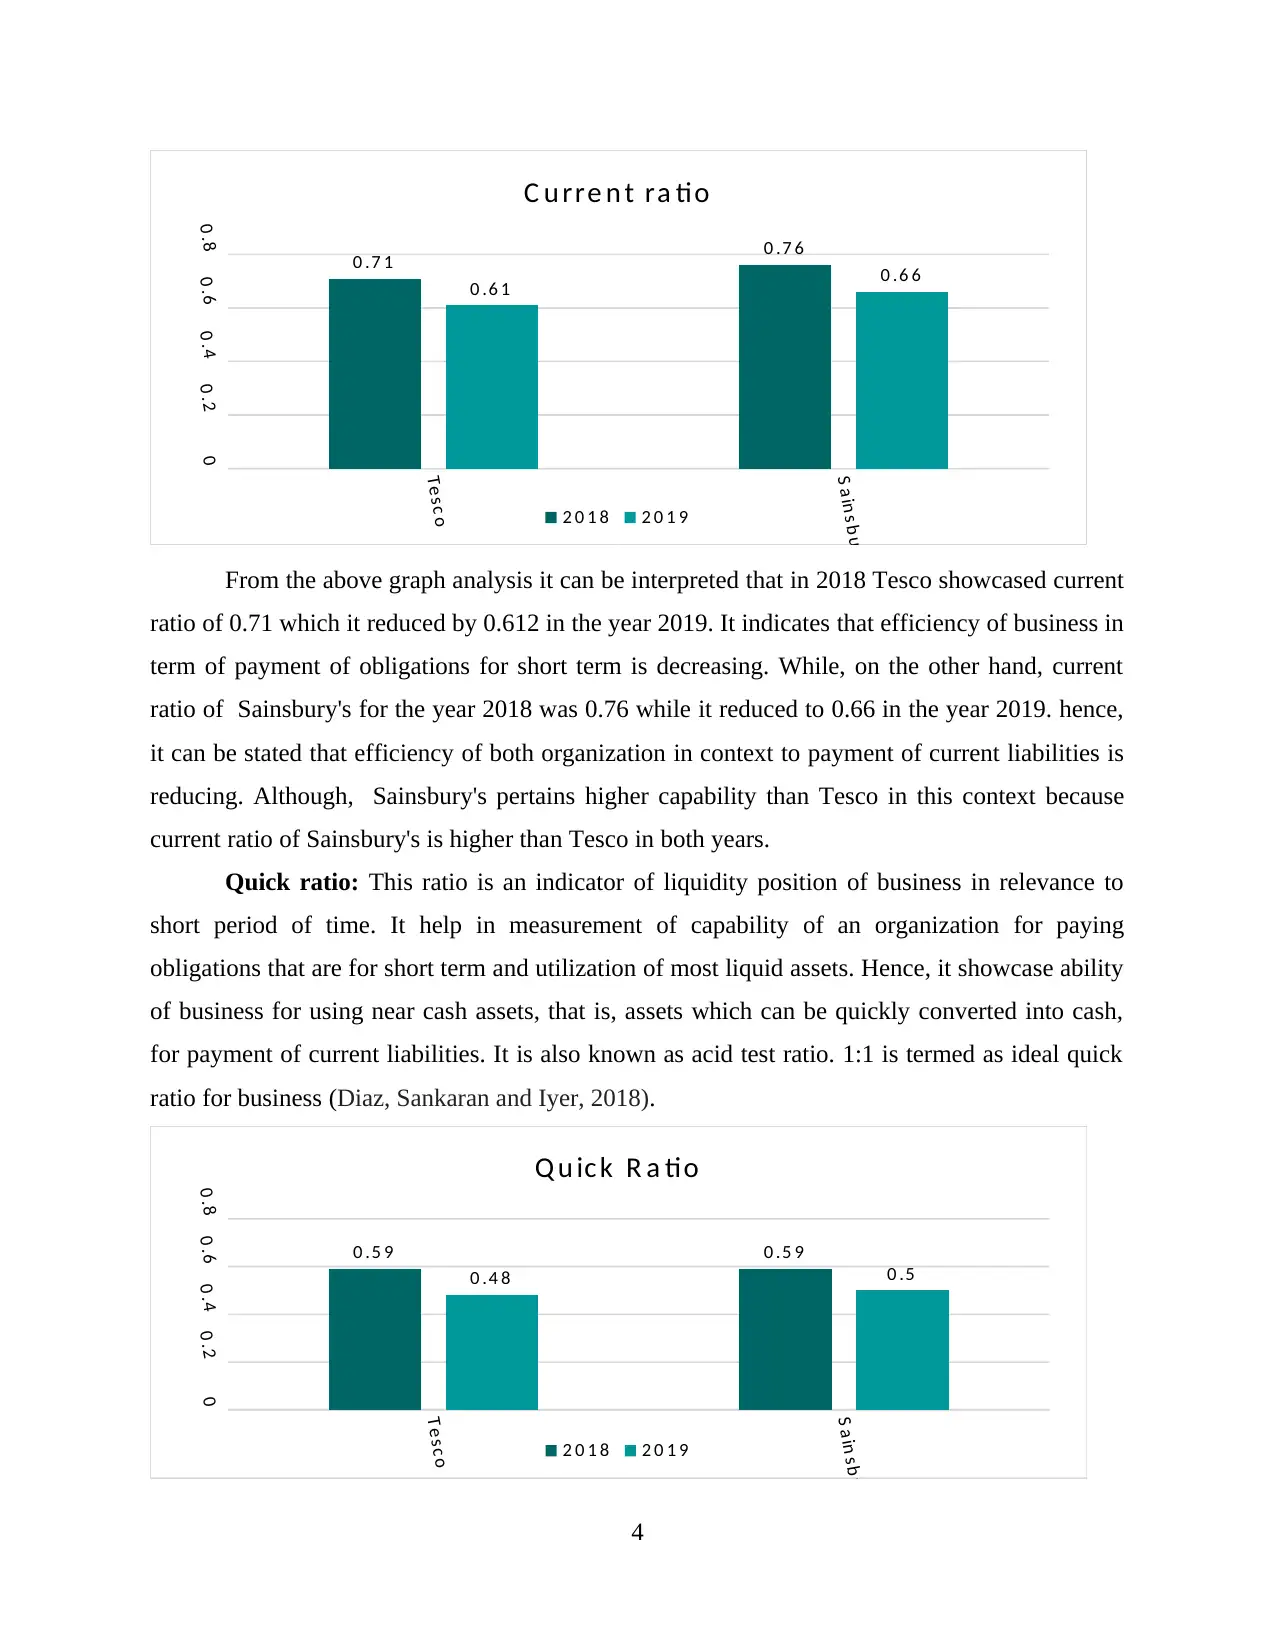
From the above graph analysis it can be interpreted that in 2018 Tesco showcased current
ratio of 0.71 which it reduced by 0.612 in the year 2019. It indicates that efficiency of business in
term of payment of obligations for short term is decreasing. While, on the other hand, current
ratio of Sainsbury's for the year 2018 was 0.76 while it reduced to 0.66 in the year 2019. hence,
it can be stated that efficiency of both organization in context to payment of current liabilities is
reducing. Although, Sainsbury's pertains higher capability than Tesco in this context because
current ratio of Sainsbury's is higher than Tesco in both years.
Quick ratio: This ratio is an indicator of liquidity position of business in relevance to
short period of time. It help in measurement of capability of an organization for paying
obligations that are for short term and utilization of most liquid assets. Hence, it showcase ability
of business for using near cash assets, that is, assets which can be quickly converted into cash,
for payment of current liabilities. It is also known as acid test ratio. 1:1 is termed as ideal quick
ratio for business (Diaz, Sankaran and Iyer, 2018).
Tes c o
S a in s b u ry
00 .20 .40 .60 .8
0 .5 9 0 .5 9
0 .4 8 0 .5
Q u ic k R a tio
2 0 1 8 2 0 1 9
4
S a in s b u ry
0
0 .2
0 .4
0 .6
0 .8 0 .7 1 0 .7 6
0 .6 1 0 .6 6
C u rre n t ra tio
2 0 1 8 2 0 1 9
From the above graph analysis it can be interpreted that in 2018 Tesco showcased current
ratio of 0.71 which it reduced by 0.612 in the year 2019. It indicates that efficiency of business in
term of payment of obligations for short term is decreasing. While, on the other hand, current
ratio of Sainsbury's for the year 2018 was 0.76 while it reduced to 0.66 in the year 2019. hence,
it can be stated that efficiency of both organization in context to payment of current liabilities is
reducing. Although, Sainsbury's pertains higher capability than Tesco in this context because
current ratio of Sainsbury's is higher than Tesco in both years.
Quick ratio: This ratio is an indicator of liquidity position of business in relevance to
short period of time. It help in measurement of capability of an organization for paying
obligations that are for short term and utilization of most liquid assets. Hence, it showcase ability
of business for using near cash assets, that is, assets which can be quickly converted into cash,
for payment of current liabilities. It is also known as acid test ratio. 1:1 is termed as ideal quick
ratio for business (Diaz, Sankaran and Iyer, 2018).
Tes c o
S a in s b u ry
00 .20 .40 .60 .8
0 .5 9 0 .5 9
0 .4 8 0 .5
Q u ic k R a tio
2 0 1 8 2 0 1 9
4
⊘ This is a preview!⊘
Do you want full access?
Subscribe today to unlock all pages.
Trusted by 1+ million students worldwide
Above graph analysis interprets that Tesco maintained quick ratio of 0.59 in 2018 while it
decreased to 0.48 in the year 2019. on the contrary, quick ratio of Sainsbury's is 0.59 in 2018 but
0.50 in 2019. But in 2019, efficiency of Tesco reduced at high level in 2019 which indicates that
company was not able maintain its liquid assets in an appropriate manner.
Gross profit ratio: This metric analyst is utilised for the purpose of assessing financial
health of an enterprise by computation of fund that is earned as profit after deduction of cost of
goods sold. It is also termed as 'gross margin ratio' (Freedland, 2018).
Tes c o
S a in s b u ry
5
6
7
8
5 .8 3
6 .6 16 .4 8
6 .9 2
G ro s s p ro fi t m a rg in
2 0 1 8 2 0 1 9
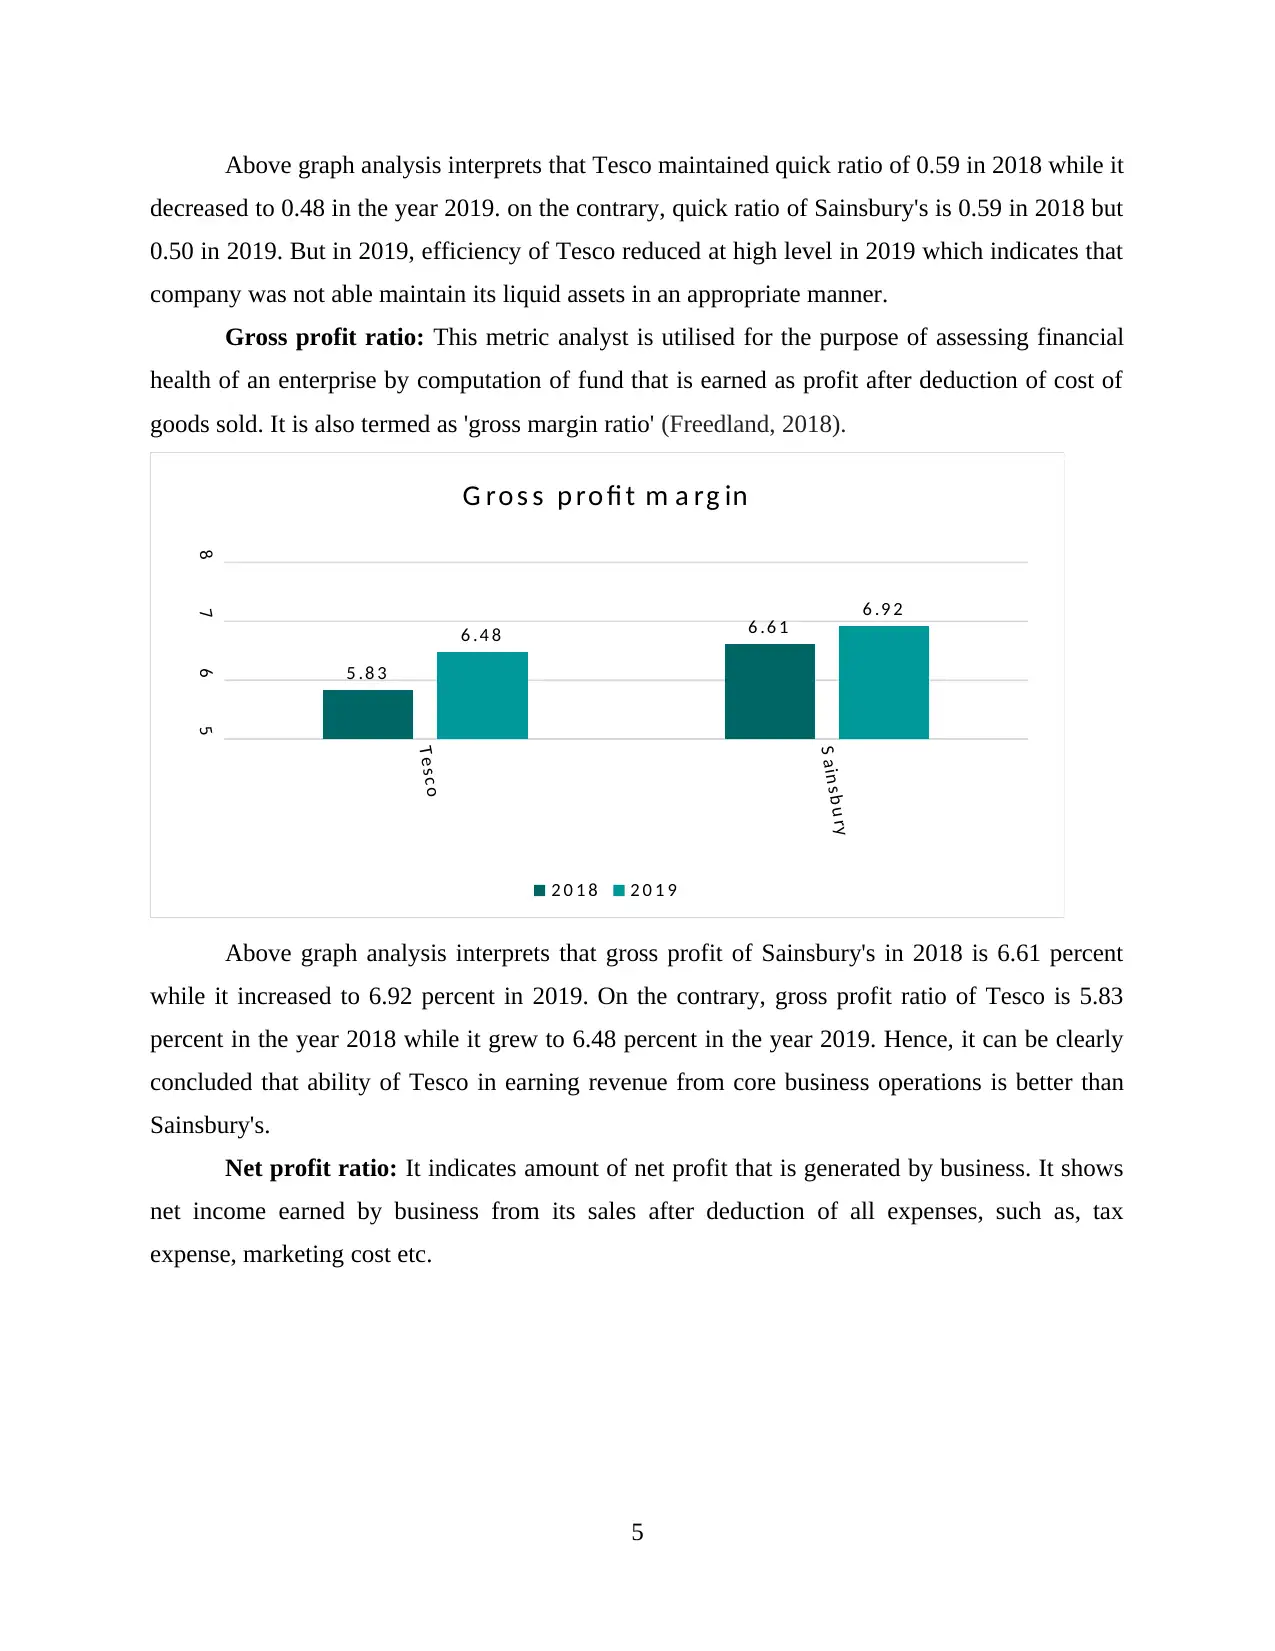
Above graph analysis interprets that gross profit of Sainsbury's in 2018 is 6.61 percent
while it increased to 6.92 percent in 2019. On the contrary, gross profit ratio of Tesco is 5.83
percent in the year 2018 while it grew to 6.48 percent in the year 2019. Hence, it can be clearly
concluded that ability of Tesco in earning revenue from core business operations is better than
Sainsbury's.
Net profit ratio: It indicates amount of net profit that is generated by business. It shows
net income earned by business from its sales after deduction of all expenses, such as, tax
expense, marketing cost etc.
5
decreased to 0.48 in the year 2019. on the contrary, quick ratio of Sainsbury's is 0.59 in 2018 but
0.50 in 2019. But in 2019, efficiency of Tesco reduced at high level in 2019 which indicates that
company was not able maintain its liquid assets in an appropriate manner.
Gross profit ratio: This metric analyst is utilised for the purpose of assessing financial
health of an enterprise by computation of fund that is earned as profit after deduction of cost of
goods sold. It is also termed as 'gross margin ratio' (Freedland, 2018).
Tes c o
S a in s b u ry
5
6
7
8
5 .8 3
6 .6 16 .4 8
6 .9 2
G ro s s p ro fi t m a rg in
2 0 1 8 2 0 1 9
Above graph analysis interprets that gross profit of Sainsbury's in 2018 is 6.61 percent
while it increased to 6.92 percent in 2019. On the contrary, gross profit ratio of Tesco is 5.83
percent in the year 2018 while it grew to 6.48 percent in the year 2019. Hence, it can be clearly
concluded that ability of Tesco in earning revenue from core business operations is better than
Sainsbury's.
Net profit ratio: It indicates amount of net profit that is generated by business. It shows
net income earned by business from its sales after deduction of all expenses, such as, tax
expense, marketing cost etc.
5
Paraphrase This Document
Need a fresh take? Get an instant paraphrase of this document with our AI Paraphraser
Tes c o
S a in s b u ry
00 .511 .522 .5
2 .1
1 .0 9
2 .0 7
0 .7 5
N e t p ro fi t m a rg in
2 0 1 8 2 0 1 9
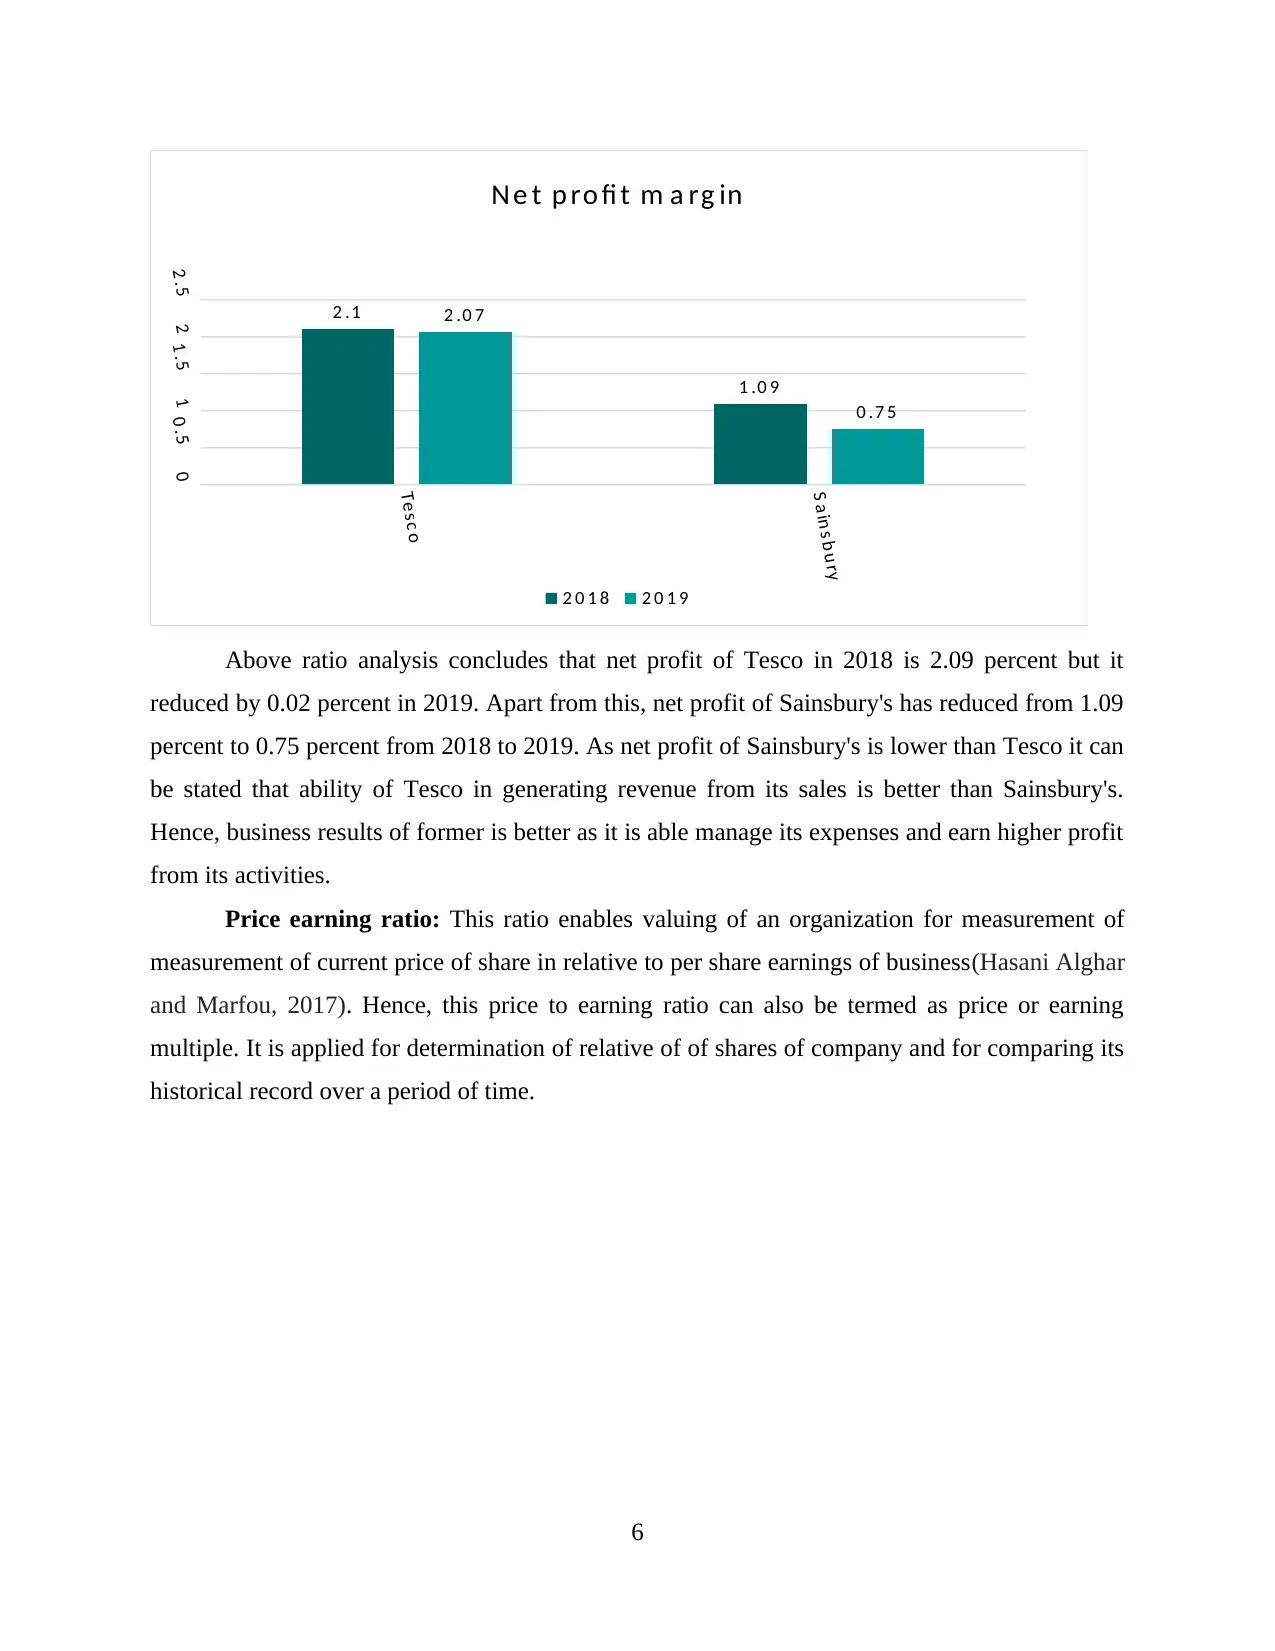
Above ratio analysis concludes that net profit of Tesco in 2018 is 2.09 percent but it
reduced by 0.02 percent in 2019. Apart from this, net profit of Sainsbury's has reduced from 1.09
percent to 0.75 percent from 2018 to 2019. As net profit of Sainsbury's is lower than Tesco it can
be stated that ability of Tesco in generating revenue from its sales is better than Sainsbury's.
Hence, business results of former is better as it is able manage its expenses and earn higher profit
from its activities.
Price earning ratio: This ratio enables valuing of an organization for measurement of
measurement of current price of share in relative to per share earnings of business(Hasani Alghar
and Marfou, 2017). Hence, this price to earning ratio can also be termed as price or earning
multiple. It is applied for determination of relative of of shares of company and for comparing its
historical record over a period of time.
6
S a in s b u ry
00 .511 .522 .5
2 .1
1 .0 9
2 .0 7
0 .7 5
N e t p ro fi t m a rg in
2 0 1 8 2 0 1 9
Above ratio analysis concludes that net profit of Tesco in 2018 is 2.09 percent but it
reduced by 0.02 percent in 2019. Apart from this, net profit of Sainsbury's has reduced from 1.09
percent to 0.75 percent from 2018 to 2019. As net profit of Sainsbury's is lower than Tesco it can
be stated that ability of Tesco in generating revenue from its sales is better than Sainsbury's.
Hence, business results of former is better as it is able manage its expenses and earn higher profit
from its activities.
Price earning ratio: This ratio enables valuing of an organization for measurement of
measurement of current price of share in relative to per share earnings of business(Hasani Alghar
and Marfou, 2017). Hence, this price to earning ratio can also be termed as price or earning
multiple. It is applied for determination of relative of of shares of company and for comparing its
historical record over a period of time.
6
Tes c o
S a in s b u ry
05 01 0 01 5 0
3 8 .2 2
1 0 6 .3 9
4 1 .5 6
1 2 3 .6
Pric e e a rn in g s ra tio
2 0 1 8 2 0 1 9
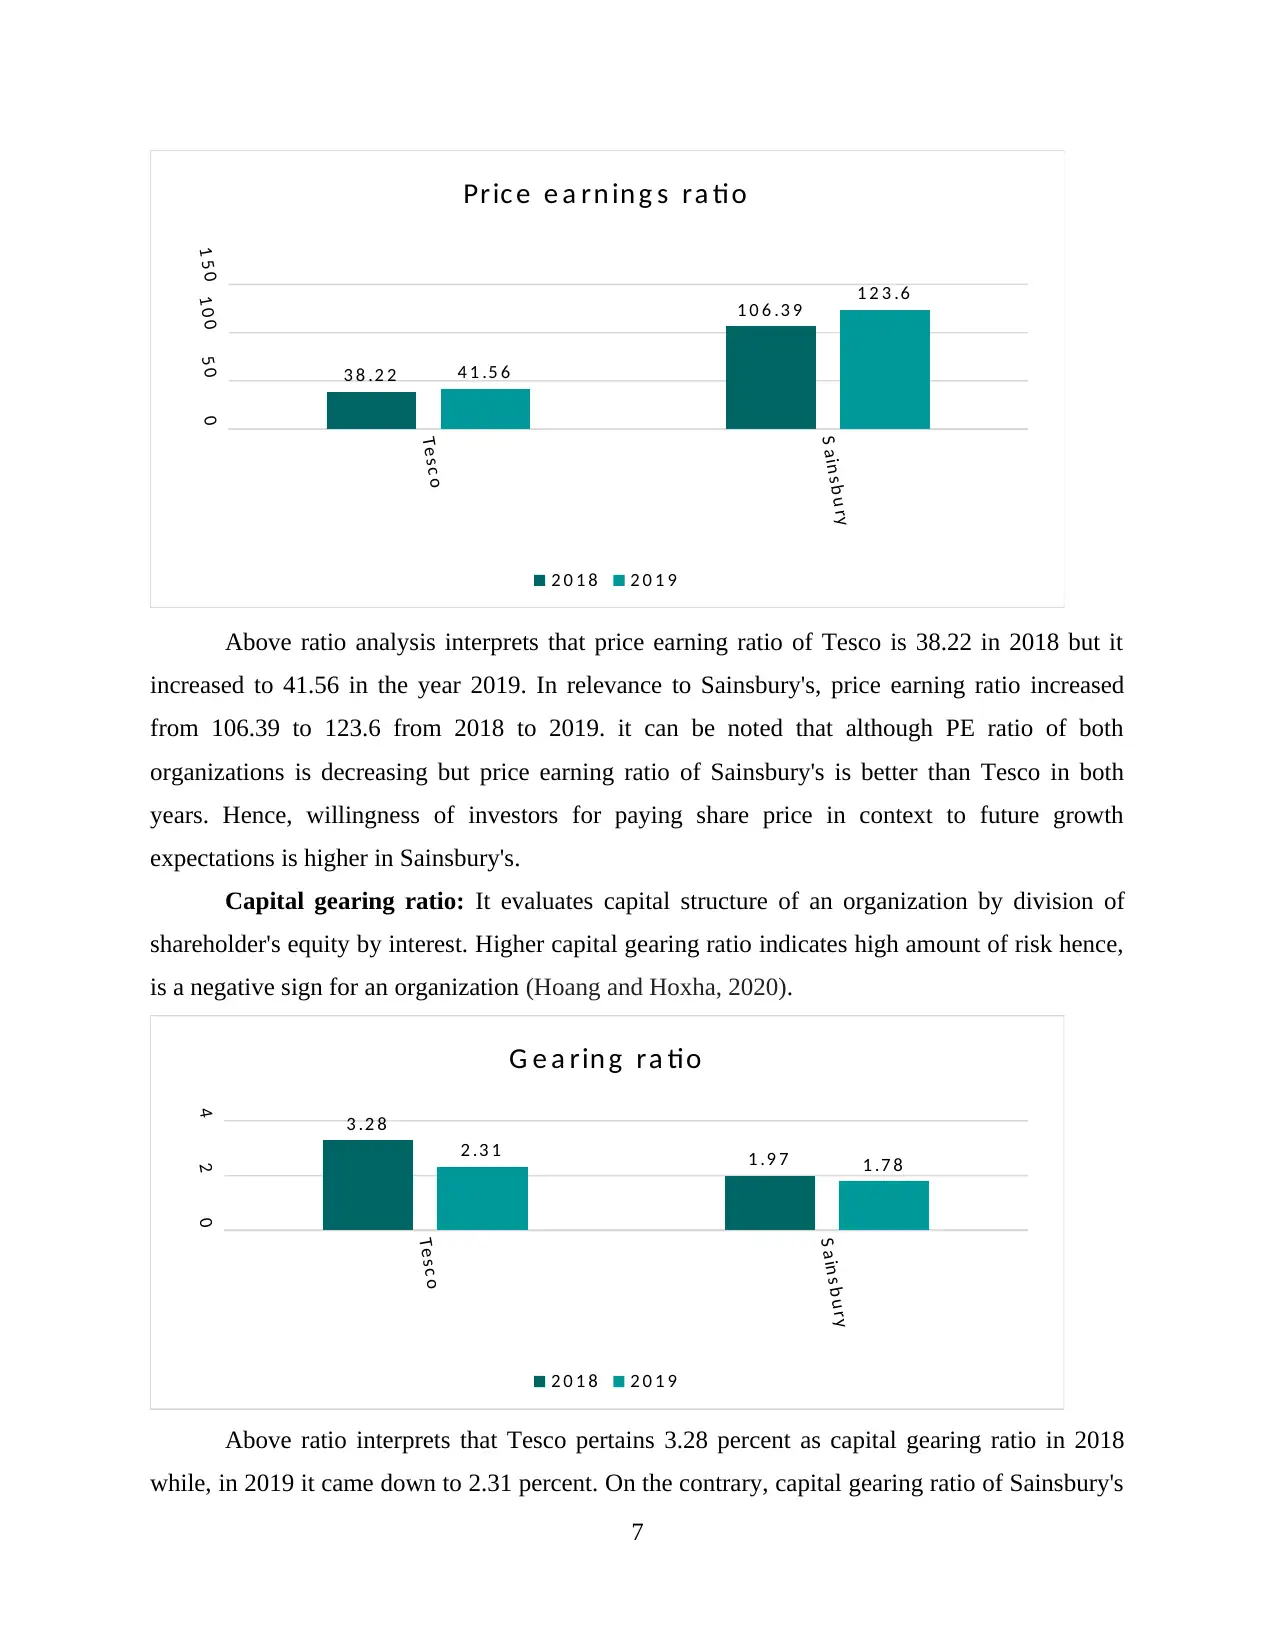
Above ratio analysis interprets that price earning ratio of Tesco is 38.22 in 2018 but it
increased to 41.56 in the year 2019. In relevance to Sainsbury's, price earning ratio increased
from 106.39 to 123.6 from 2018 to 2019. it can be noted that although PE ratio of both
organizations is decreasing but price earning ratio of Sainsbury's is better than Tesco in both
years. Hence, willingness of investors for paying share price in context to future growth
expectations is higher in Sainsbury's.
Capital gearing ratio: It evaluates capital structure of an organization by division of
shareholder's equity by interest. Higher capital gearing ratio indicates high amount of risk hence,
is a negative sign for an organization (Hoang and Hoxha, 2020).
Tes c o
S a in s b u ry
0
2
4 3 .2 8
1 .9 72 .3 1 1 .7 8
G e a rin g ra tio
2 0 1 8 2 0 1 9
Above ratio interprets that Tesco pertains 3.28 percent as capital gearing ratio in 2018
while, in 2019 it came down to 2.31 percent. On the contrary, capital gearing ratio of Sainsbury's
7
S a in s b u ry
05 01 0 01 5 0
3 8 .2 2
1 0 6 .3 9
4 1 .5 6
1 2 3 .6
Pric e e a rn in g s ra tio
2 0 1 8 2 0 1 9
Above ratio analysis interprets that price earning ratio of Tesco is 38.22 in 2018 but it
increased to 41.56 in the year 2019. In relevance to Sainsbury's, price earning ratio increased
from 106.39 to 123.6 from 2018 to 2019. it can be noted that although PE ratio of both
organizations is decreasing but price earning ratio of Sainsbury's is better than Tesco in both
years. Hence, willingness of investors for paying share price in context to future growth
expectations is higher in Sainsbury's.
Capital gearing ratio: It evaluates capital structure of an organization by division of
shareholder's equity by interest. Higher capital gearing ratio indicates high amount of risk hence,
is a negative sign for an organization (Hoang and Hoxha, 2020).
Tes c o
S a in s b u ry
0
2
4 3 .2 8
1 .9 72 .3 1 1 .7 8
G e a rin g ra tio
2 0 1 8 2 0 1 9
Above ratio interprets that Tesco pertains 3.28 percent as capital gearing ratio in 2018
while, in 2019 it came down to 2.31 percent. On the contrary, capital gearing ratio of Sainsbury's
7
⊘ This is a preview!⊘
Do you want full access?
Subscribe today to unlock all pages.
Trusted by 1+ million students worldwide
showcase 1.97 percent in 2018 that decreased to 1.78 percent in 2019. Hence, it clearly indicates
that risk factor associated with Tesco is higher than Sainsbury's as it consists high capital gearing
ratio which states that amount of debt in Tesco is high.
Return on capital employed: This financial ratio cam be applied got assessment of
profitability as well as capital efficiency of an enterprise. It helps in understanding efficiency of
an organization in generating income from capital that is employed in it. It is used by financial
managers and potential investors for analysing entity for investment purpose.
Tes c o
S ain s b u ry
024681 0
6 .1 4
4 .4 3
9 .3 4
4 .9 7
R e tu rn o n c a p ita l e m p lo y e d
2 0 1 8 2 0 1 9
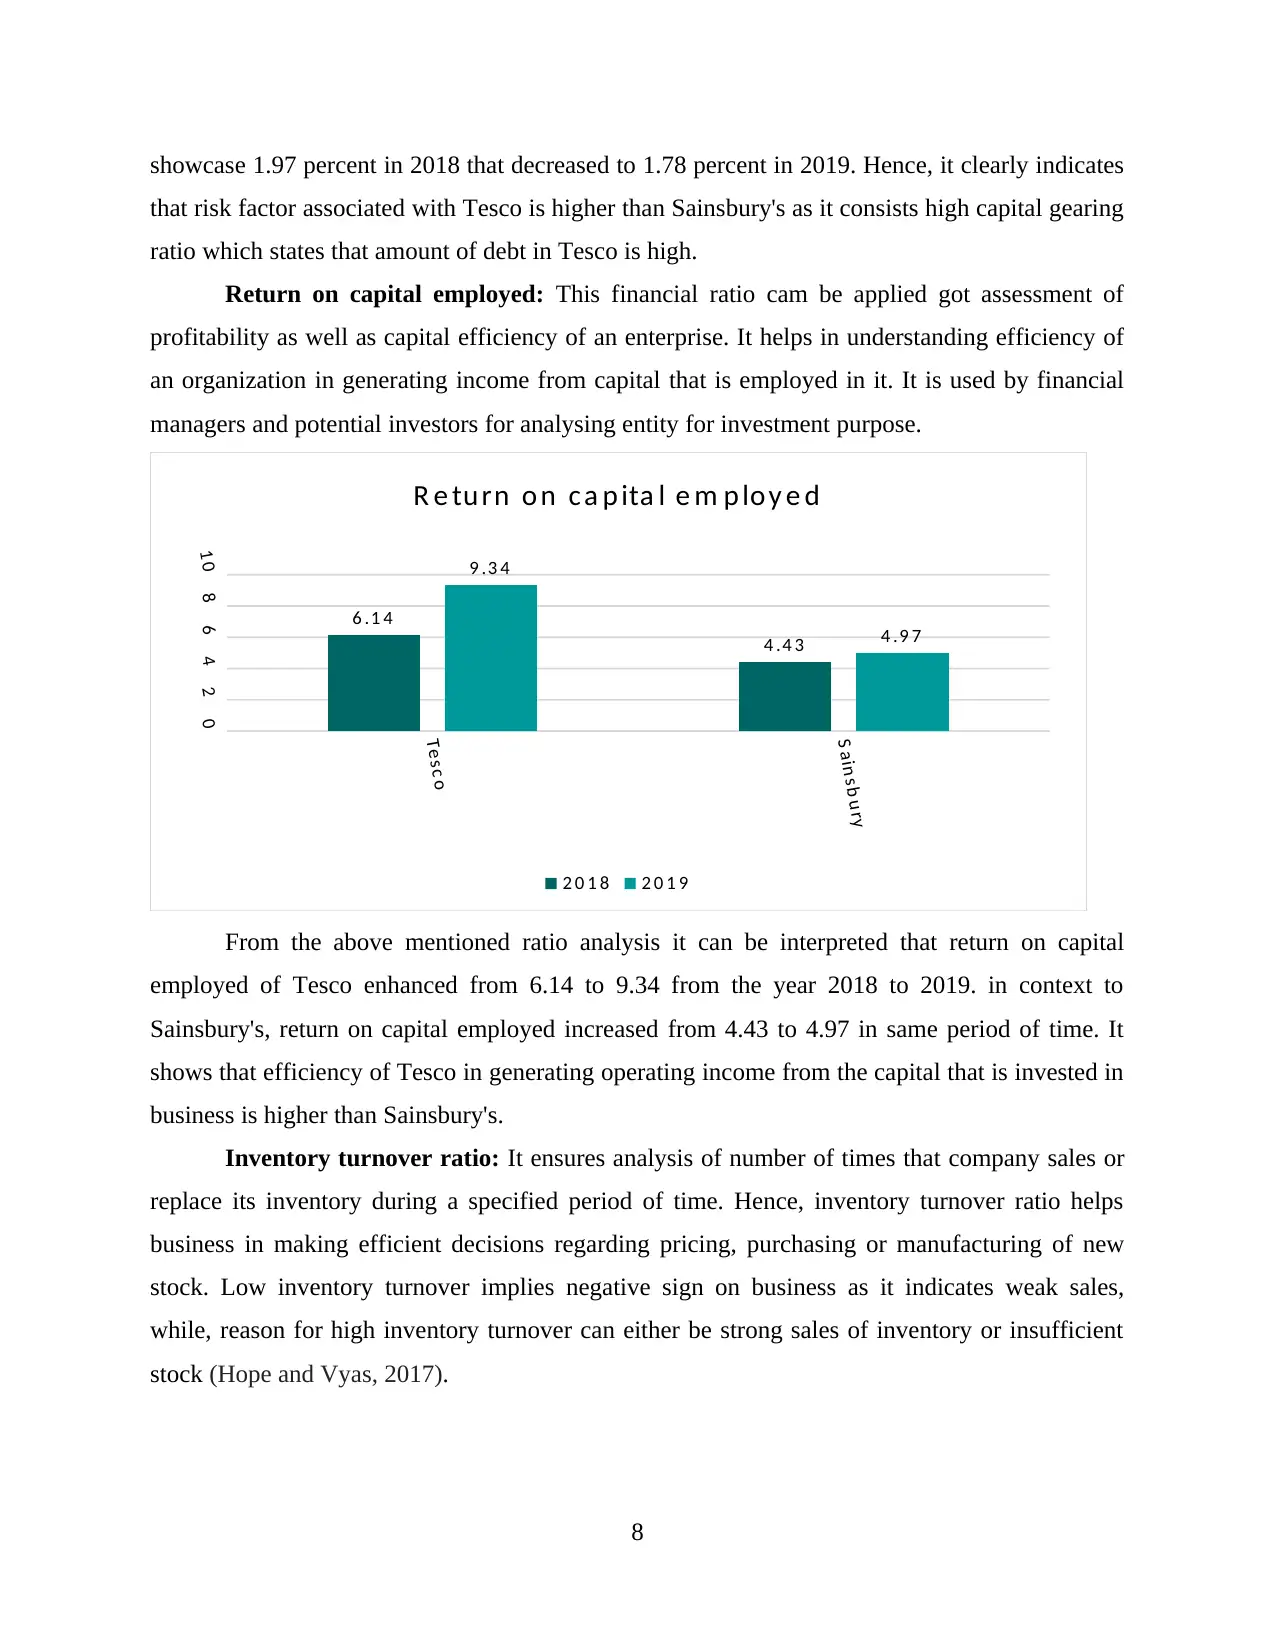
From the above mentioned ratio analysis it can be interpreted that return on capital
employed of Tesco enhanced from 6.14 to 9.34 from the year 2018 to 2019. in context to
Sainsbury's, return on capital employed increased from 4.43 to 4.97 in same period of time. It
shows that efficiency of Tesco in generating operating income from the capital that is invested in
business is higher than Sainsbury's.
Inventory turnover ratio: It ensures analysis of number of times that company sales or
replace its inventory during a specified period of time. Hence, inventory turnover ratio helps
business in making efficient decisions regarding pricing, purchasing or manufacturing of new
stock. Low inventory turnover implies negative sign on business as it indicates weak sales,
while, reason for high inventory turnover can either be strong sales of inventory or insufficient
stock (Hope and Vyas, 2017).
8
that risk factor associated with Tesco is higher than Sainsbury's as it consists high capital gearing
ratio which states that amount of debt in Tesco is high.
Return on capital employed: This financial ratio cam be applied got assessment of
profitability as well as capital efficiency of an enterprise. It helps in understanding efficiency of
an organization in generating income from capital that is employed in it. It is used by financial
managers and potential investors for analysing entity for investment purpose.
Tes c o
S ain s b u ry
024681 0
6 .1 4
4 .4 3
9 .3 4
4 .9 7
R e tu rn o n c a p ita l e m p lo y e d
2 0 1 8 2 0 1 9
From the above mentioned ratio analysis it can be interpreted that return on capital
employed of Tesco enhanced from 6.14 to 9.34 from the year 2018 to 2019. in context to
Sainsbury's, return on capital employed increased from 4.43 to 4.97 in same period of time. It
shows that efficiency of Tesco in generating operating income from the capital that is invested in
business is higher than Sainsbury's.
Inventory turnover ratio: It ensures analysis of number of times that company sales or
replace its inventory during a specified period of time. Hence, inventory turnover ratio helps
business in making efficient decisions regarding pricing, purchasing or manufacturing of new
stock. Low inventory turnover implies negative sign on business as it indicates weak sales,
while, reason for high inventory turnover can either be strong sales of inventory or insufficient
stock (Hope and Vyas, 2017).
8
Paraphrase This Document
Need a fresh take? Get an instant paraphrase of this document with our AI Paraphraser
Tes c o
S a in s b u ry
051 01 52 02 53 0
2 3 .7 3
1 4 .8 3
2 4 .5
1 4 .4 4
A v e ra g e in v e n to rie s tu rn o v e r ra tio
2 0 1 8 2 0 1 9
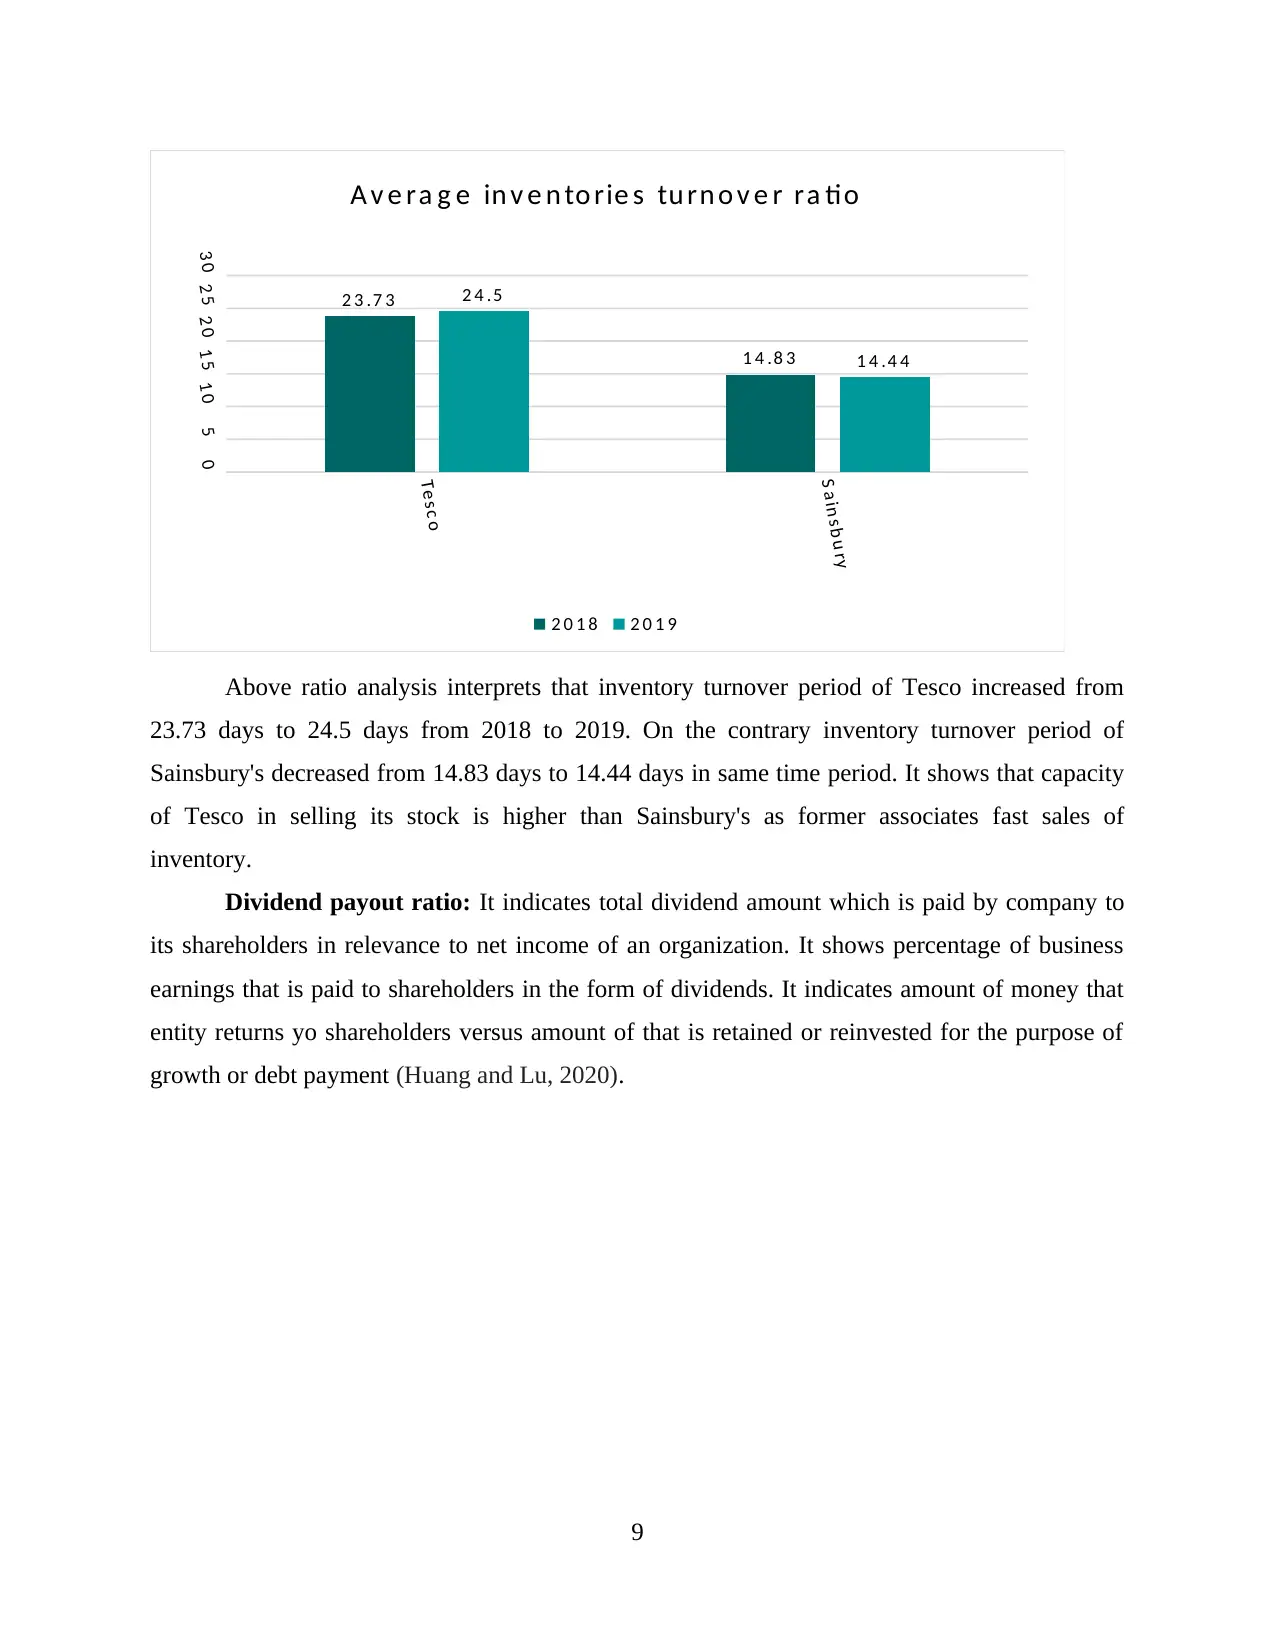
Above ratio analysis interprets that inventory turnover period of Tesco increased from
23.73 days to 24.5 days from 2018 to 2019. On the contrary inventory turnover period of
Sainsbury's decreased from 14.83 days to 14.44 days in same time period. It shows that capacity
of Tesco in selling its stock is higher than Sainsbury's as former associates fast sales of
inventory.
Dividend payout ratio: It indicates total dividend amount which is paid by company to
its shareholders in relevance to net income of an organization. It shows percentage of business
earnings that is paid to shareholders in the form of dividends. It indicates amount of money that
entity returns yo shareholders versus amount of that is retained or reinvested for the purpose of
growth or debt payment (Huang and Lu, 2020).
9
S a in s b u ry
051 01 52 02 53 0
2 3 .7 3
1 4 .8 3
2 4 .5
1 4 .4 4
A v e ra g e in v e n to rie s tu rn o v e r ra tio
2 0 1 8 2 0 1 9
Above ratio analysis interprets that inventory turnover period of Tesco increased from
23.73 days to 24.5 days from 2018 to 2019. On the contrary inventory turnover period of
Sainsbury's decreased from 14.83 days to 14.44 days in same time period. It shows that capacity
of Tesco in selling its stock is higher than Sainsbury's as former associates fast sales of
inventory.
Dividend payout ratio: It indicates total dividend amount which is paid by company to
its shareholders in relevance to net income of an organization. It shows percentage of business
earnings that is paid to shareholders in the form of dividends. It indicates amount of money that
entity returns yo shareholders versus amount of that is retained or reinvested for the purpose of
growth or debt payment (Huang and Lu, 2020).
9
Tes c o
S a in s b u ry
0
5 0
1 0 0
1 5 0
6 .7 8
7 6 .0 5
2 7 .0 5
1 1 2 .7 9
D iv id e n d p a y o u t ra tio
2 0 1 8 2 0 1 9
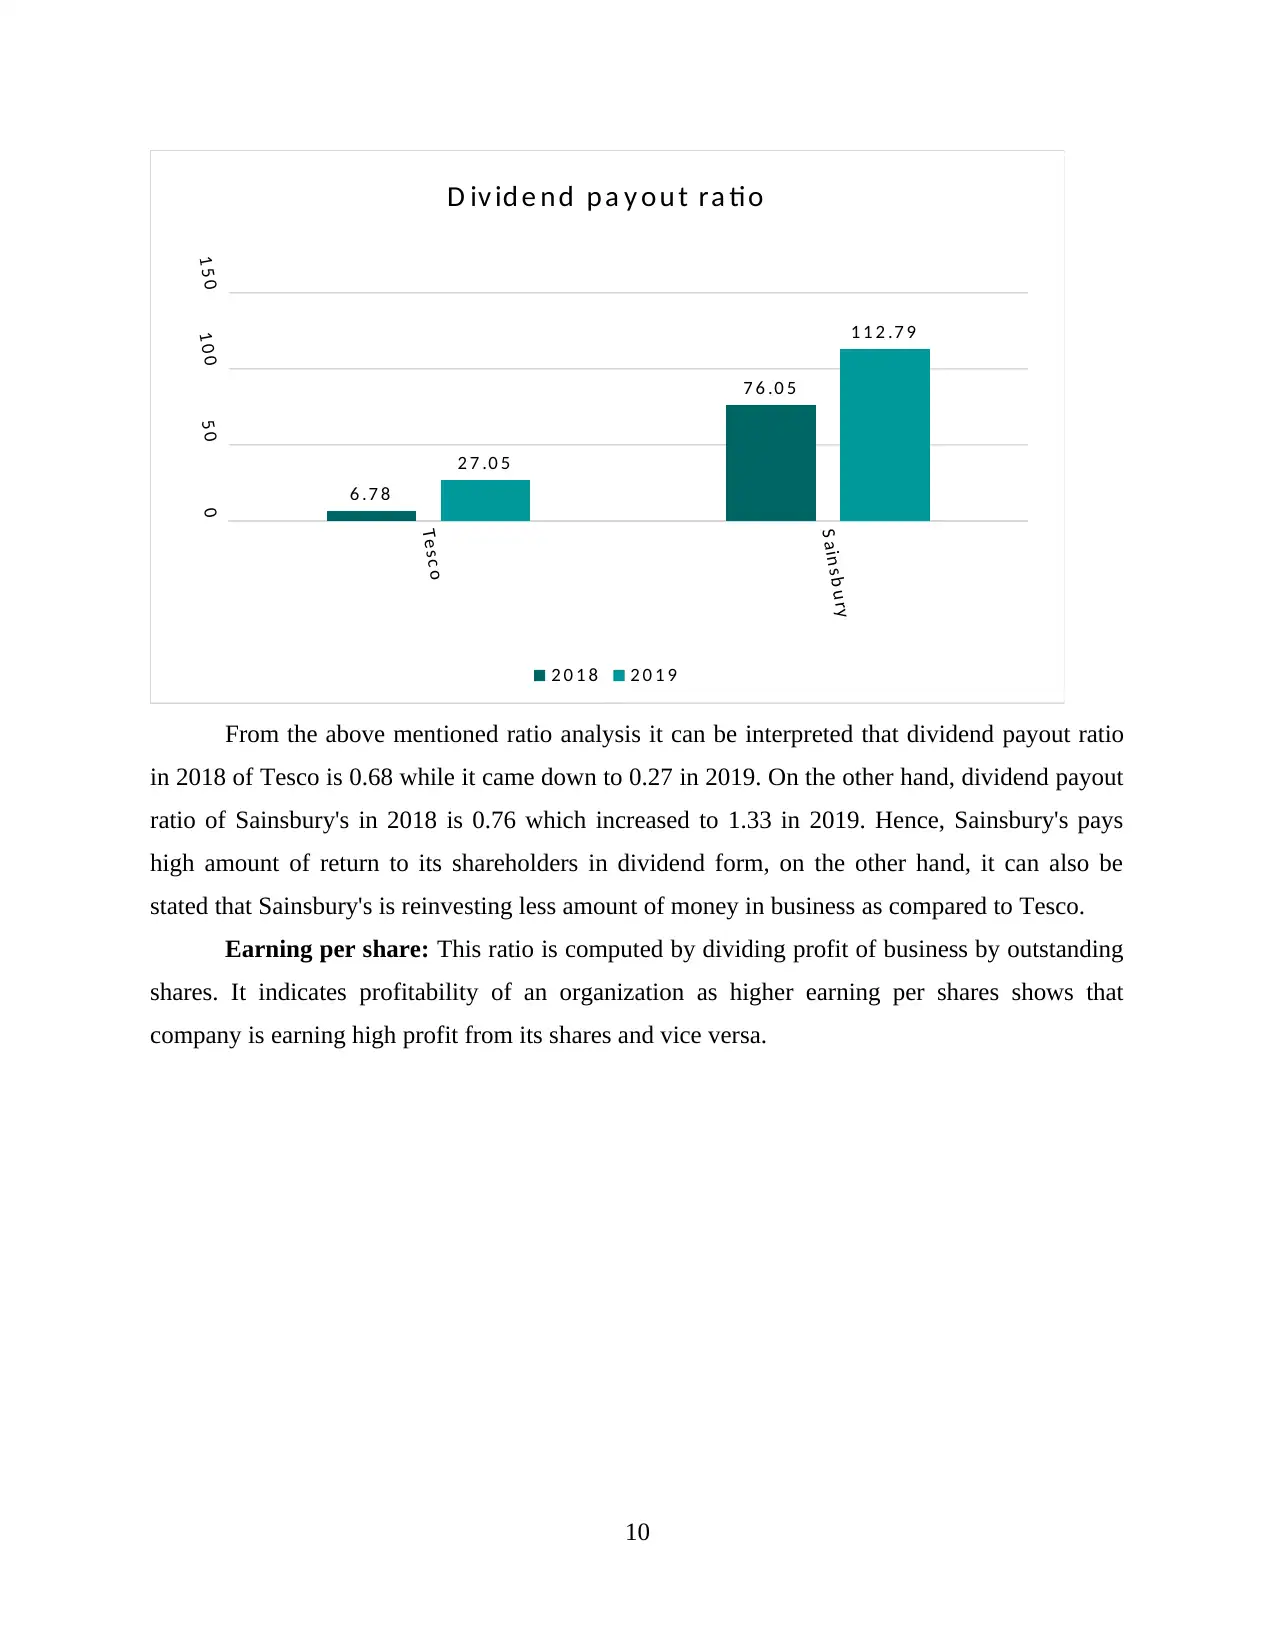
From the above mentioned ratio analysis it can be interpreted that dividend payout ratio
in 2018 of Tesco is 0.68 while it came down to 0.27 in 2019. On the other hand, dividend payout
ratio of Sainsbury's in 2018 is 0.76 which increased to 1.33 in 2019. Hence, Sainsbury's pays
high amount of return to its shareholders in dividend form, on the other hand, it can also be
stated that Sainsbury's is reinvesting less amount of money in business as compared to Tesco.
Earning per share: This ratio is computed by dividing profit of business by outstanding
shares. It indicates profitability of an organization as higher earning per shares shows that
company is earning high profit from its shares and vice versa.
10
S a in s b u ry
0
5 0
1 0 0
1 5 0
6 .7 8
7 6 .0 5
2 7 .0 5
1 1 2 .7 9
D iv id e n d p a y o u t ra tio
2 0 1 8 2 0 1 9
From the above mentioned ratio analysis it can be interpreted that dividend payout ratio
in 2018 of Tesco is 0.68 while it came down to 0.27 in 2019. On the other hand, dividend payout
ratio of Sainsbury's in 2018 is 0.76 which increased to 1.33 in 2019. Hence, Sainsbury's pays
high amount of return to its shareholders in dividend form, on the other hand, it can also be
stated that Sainsbury's is reinvesting less amount of money in business as compared to Tesco.
Earning per share: This ratio is computed by dividing profit of business by outstanding
shares. It indicates profitability of an organization as higher earning per shares shows that
company is earning high profit from its shares and vice versa.
10
⊘ This is a preview!⊘
Do you want full access?
Subscribe today to unlock all pages.
Trusted by 1+ million students worldwide
1 out of 18
Related Documents


Your All-in-One AI-Powered Toolkit for Academic Success.
+13062052269
info@desklib.com
Available 24*7 on WhatsApp / Email
![[object Object]](/_next/static/media/star-bottom.7253800d.svg)
Unlock your academic potential
Copyright © 2020–2026 A2Z Services. All Rights Reserved. Developed and managed by ZUCOL.