Managerial Finance Report: Comparing Tesco and Sainsbury's Performance
VerifiedAdded on 2022/12/30
|19
|4050
|61
Report
AI Summary
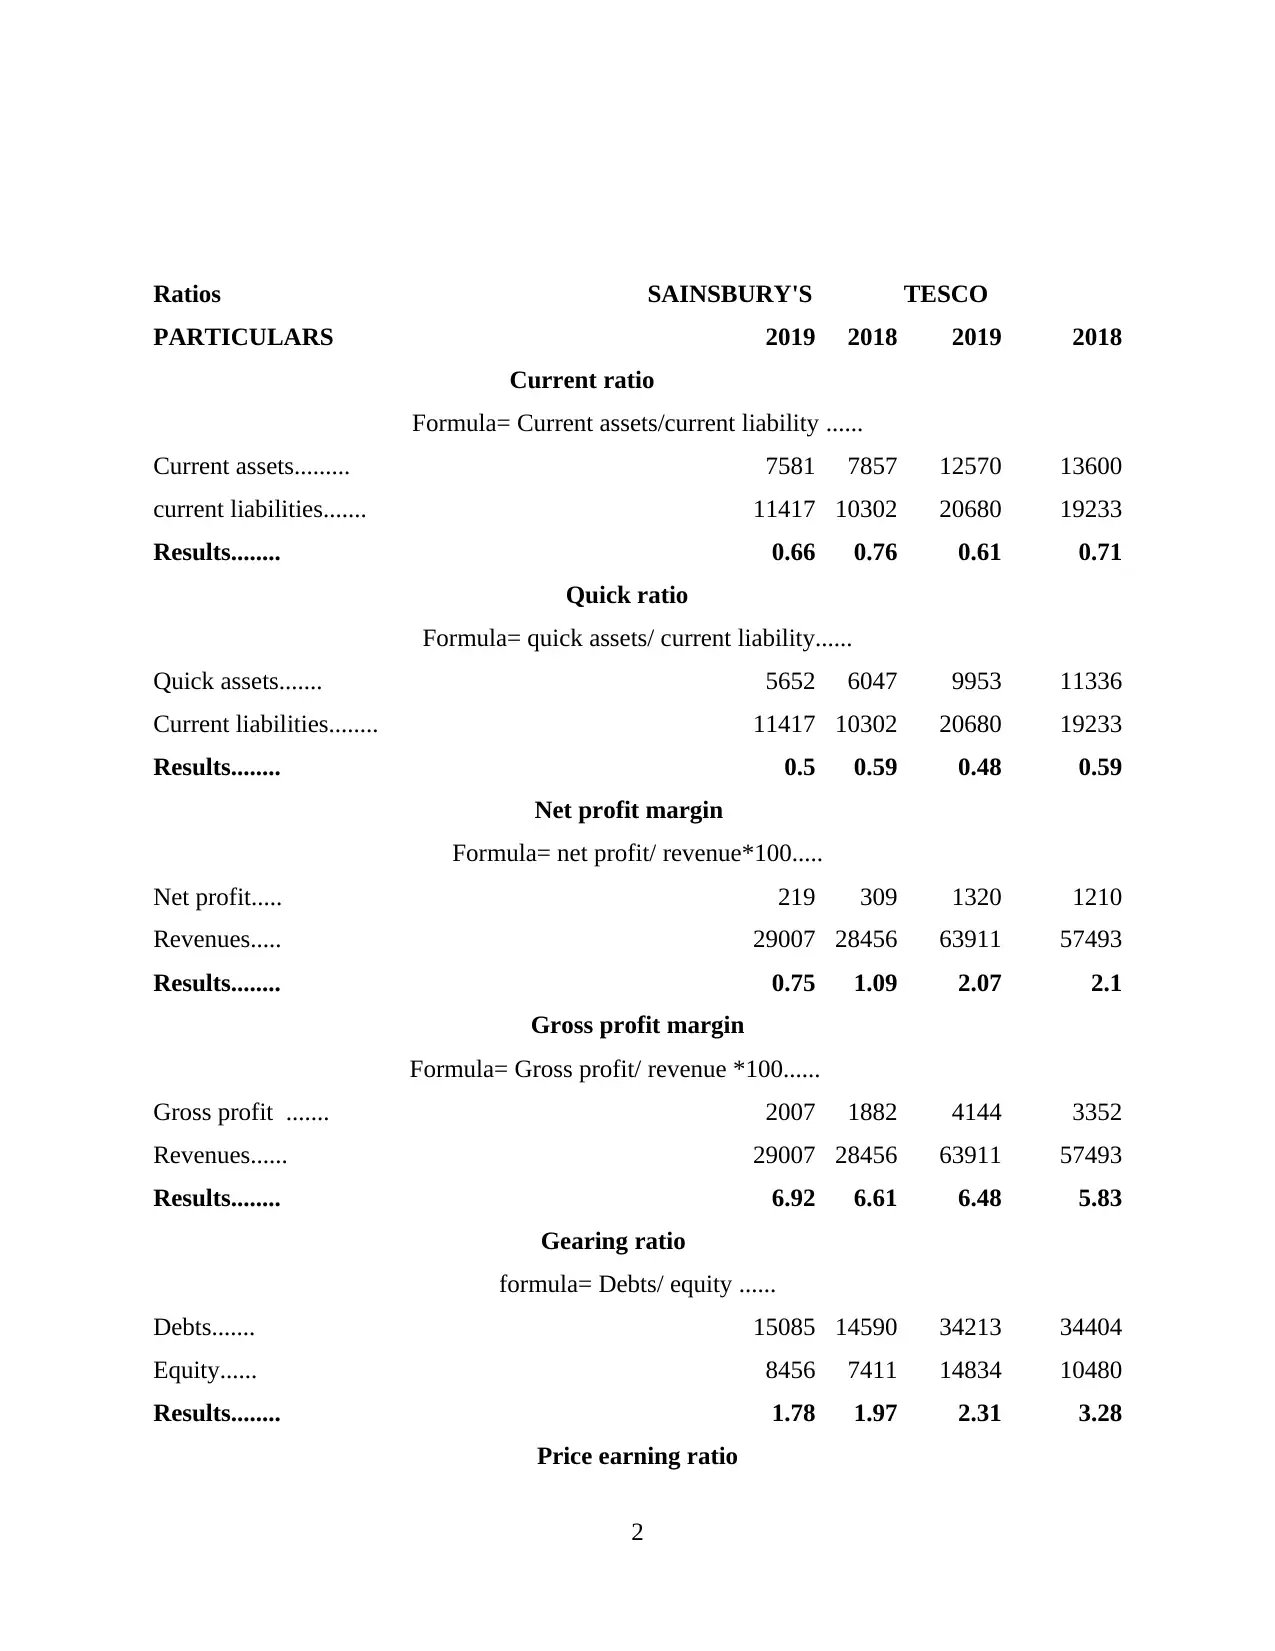
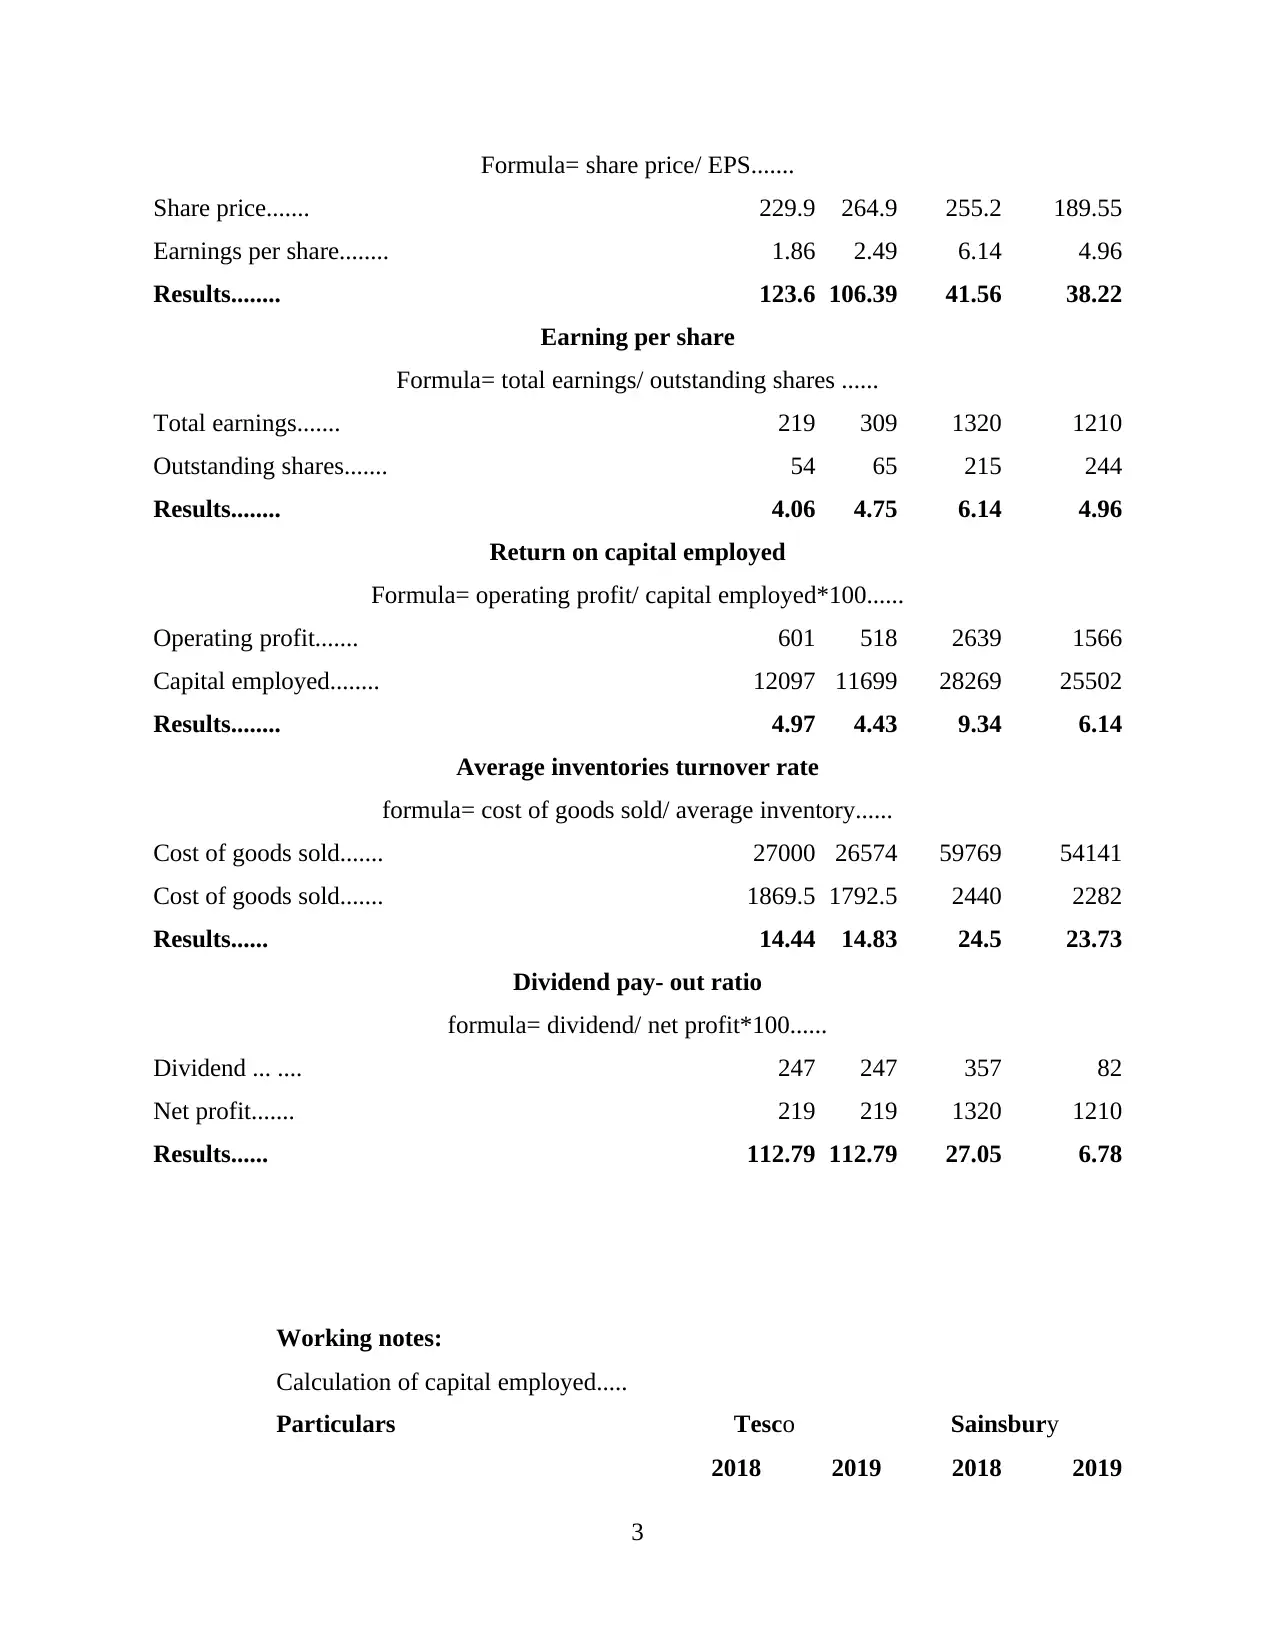
This report provides a comprehensive analysis of the financial performance of Tesco and Sainsbury's, two major players in the UK retail market. The report begins with an introduction to managerial finance, emphasizing the importance of financial statement analysis for assessing company performance and making informed investment decisions. Portfolio 1 focuses on a detailed ratio analysis, comparing key financial metrics such as current ratio, quick ratio, net profit margin, gross profit margin, gearing ratio, price earning ratio, earnings per share, return on capital employed, average inventories turnover rate, and dividend payout ratio for both companies across 2018 and 2019. The analysis includes the interpretation of each ratio, providing insights into the liquidity, efficiency, and profitability of each firm, supported by charts illustrating the trends. The report also addresses the limitations of ratio analysis. Portfolio 2 explores investment appraisal techniques, comparing alternatives and discussing their limitations. The report concludes with a summary of the key findings and provides relevant references.

MANAGERIAL
FINANCE
FINANCE
Paraphrase This Document
Need a fresh take? Get an instant paraphrase of this document with our AI Paraphraser

Table of Contents
INTRODUCTION...........................................................................................................................1
PORTFOLIO 1.................................................................................................................................1
Compare the performance by ratio analysis of two company .....................................................1
Interpretation of financial performance and position of the business entity on the basis of ratio
and chart.......................................................................................................................................3
Recommendation on the poor performance ..............................................................................11
Limitations of the ratio analysis ................................................................................................12
PORTFOLIO 2...............................................................................................................................13
Use of the investment appraisal techniques for the adoption of the two alternatives ...............13
Limitation of the investment appraisal techniques....................................................................15
CONCLUSION..............................................................................................................................15
REFERENCES .............................................................................................................................16

INTRODUCTION
Managerial finance means assessing of the evaluation of the financial statements for
determine the performance of the company in the market by seeing the significance of the data,
they also provide financial information which help in prevent the losses and help in improvement
of the organization planning. In simple terms it means the combination of the corporate finance
and managerial accounting for maintaining the business strategies for control their effectiveness
working and monitoring their day to day activities. It is used by all firms for apply the financial
techniques at different level of department (Altaf and Ahmad, 2019). This report is based on the
two company TESCO AND SAINSBURY'S. Tesco Plc is the British multinational groceries and
general merchandise retailer headquarter in Welwyn Garden city, England. It is the third largest
retailer in the world which is determine by the revenue. Sainsbury's is also the second largest
chain in the supermarket in the United kingdom, it has 16% share in the market among the
sector. It became the largest retailer of groceries. In this report there is the ratio analysis of both
the firm is determine to get the exact performance and limitations of the ratio also. There is the
limitation of investment appraisal techniques is also discussed.
PORTFOLIO 1
Compare the performance by ratio analysis of two company
Ratio analysis means measure and analysis of the performance in the minds of investor
and analyst so they can invest their investment to get better return in the future. Through this
they can easily know the liquidity, efficiency and profitability position of the entity. This is very
important element for the evaluation of the financial statements. This is very useful in deciding
which firm is profitable or which is not. It is also helpful in evaluation of the detailed operation
in the organization.
There is the analysis of both entity Tesco and Sainsbury's to determine which is best for
the investor and which give higher profit in the long run, to maintain their brand image in the
minds of them (Hotchkiss and Wang, 2019).
1
⊘ This is a preview!⊘
Do you want full access?
Subscribe today to unlock all pages.

Trusted by 1+ million students worldwide

Ratios SAINSBURY'S TESCO
PARTICULARS 2019 2018 2019 2018
Current ratio
Formula= Current assets/current liability ......
Current assets......... 7581 7857 12570 13600
current liabilities....... 11417 10302 20680 19233
Results........ 0.66 0.76 0.61 0.71
Quick ratio
Formula= quick assets/ current liability......
Quick assets....... 5652 6047 9953 11336
Current liabilities........ 11417 10302 20680 19233
Results........ 0.5 0.59 0.48 0.59
Net profit margin
Formula= net profit/ revenue*100.....
Net profit..... 219 309 1320 1210
Revenues..... 29007 28456 63911 57493
Results........ 0.75 1.09 2.07 2.1
Gross profit margin
Formula= Gross profit/ revenue *100......
Gross profit ....... 2007 1882 4144 3352
Revenues...... 29007 28456 63911 57493
Results........ 6.92 6.61 6.48 5.83
Gearing ratio
formula= Debts/ equity ......
Debts....... 15085 14590 34213 34404
Equity...... 8456 7411 14834 10480
Results........ 1.78 1.97 2.31 3.28
Price earning ratio
2
Paraphrase This Document
Need a fresh take? Get an instant paraphrase of this document with our AI Paraphraser

Formula= share price/ EPS.......
Share price....... 229.9 264.9 255.2 189.55
Earnings per share........ 1.86 2.49 6.14 4.96
Results........ 123.6 106.39 41.56 38.22
Earning per share
Formula= total earnings/ outstanding shares ......
Total earnings....... 219 309 1320 1210
Outstanding shares....... 54 65 215 244
Results........ 4.06 4.75 6.14 4.96
Return on capital employed
Formula= operating profit/ capital employed*100......
Operating profit....... 601 518 2639 1566
Capital employed........ 12097 11699 28269 25502
Results........ 4.97 4.43 9.34 6.14
Average inventories turnover rate
formula= cost of goods sold/ average inventory......
Cost of goods sold....... 27000 26574 59769 54141
Cost of goods sold....... 1869.5 1792.5 2440 2282
Results...... 14.44 14.83 24.5 23.73
Dividend pay- out ratio
formula= dividend/ net profit*100......
Dividend ... .... 247 247 357 82
Net profit....... 219 219 1320 1210
Results...... 112.79 112.79 27.05 6.78
Working notes:
Calculation of capital employed.....
Particulars Tesco Sainsbury
2018 2019 2018 2019
3

Total assets..... 44,735 48,949 22,001 23,514
Less: Current liabilities..... 19,233 20,680 10,302 11,417
Capital employed........ 25,502 28,269 11,699 12,097
Interpretation of financial performance and position of the business entity on the basis of ratio
and chart
Current ratio- Current ratio is used to meet the requirement of the short term obligations
for determine the liquidity of the company which is necessary to determine the current assets and
current liability. Through this ratio manager is able to know the requirement of the cash and debt
which they want to return off in short term. From the above calculation of this ratio it has been
analysed that Sainsbury's has highest ratio than the Tesco during boith year 2019 and 2018. it
means Tesco is not able to meet their short term obligation, there liquidity position is also low as
compare to other company (Barbosa, 2019).
Quick ratio- this ratio help the organization to pay their debt which is payed by the
current assets minus the inventory or stock which is useful in the main core of the operations.
4
Tesco
Sains...
00.10.20.30.40.50.60.70.8 0.71 0.76
0.61 0.66
Current ratio
2018 2019
⊘ This is a preview!⊘
Do you want full access?
Subscribe today to unlock all pages.

Trusted by 1+ million students worldwide

This ratio help in determine the financial health of the company ans also liquidity position of the
entity. From the above calculation it has been interpreted that this ratio is same for both the
company in 2018 but in 2019 this ratio is increasing for the Sainsbury's which mean they have
high financial health and efficiency position in the market among their competitor. It also help
them in payment of the current liabilities by the fastest payment (Boyd and Pitre, 2020).
Tesco
Sains...
00.10.20.30.40.50.60.7
0.59 0.59
0.48 0.5
Quick Ratio
2018 2019
Net profit margin- This ratio is used by the business to evaluate the ability of the
business to determine the profits which is generated through the revenues. Through this ratio it
helps in analysis of the profitability position of the company in the market. This ratio help
organization for incurring the improvement for increasing the profit of the entity. From the above
ratio it has been analysed that in 2018 there is the same net profit of both company but in 2019
there is high profitability position of the Tesco than Sainsbury's. It is beneficial for the investor
to get high return in the long run and they also incur large revenues through the help of this ratio
(Das and Manoharan, 2019).
5
Paraphrase This Document
Need a fresh take? Get an instant paraphrase of this document with our AI Paraphraser

Tesco
Sainsbury
00.511.522.5 2.1
1.09
2.07
0.75
Net profit margin
2018 2019
Gross profit margin- this ratio is used to measure the profitability position of the
business for generating the profit against the revenue, this ratio help in determine the ability of
the company to determine the operational efficiency of both the firm for determine the
probability of the entity. From the above ratio it has been analysed that Sainsbury's has highest
ratio than the Tesco which means they have higher profitability position in the market. From the
above calculation, it has been analysed that Tesco has small margin than the Sainsbury's. This
help the them to increase their gross profit margin by increase the sales and reduce the expenses.
In both year 2018 and 2019 there is the increasing flow of the profit for Sainsbury's than Tesco.
There is the chart is there for the analysis of the ratio (Dicko, 2017).
6

Tesco
Sainsbury
5.25.666.46.87.2
5.83
6.61
6.48
6.92
Gross profit margin
2018 2019
Gearing ratio- this ratio is very useful in compare the owners equities with the debt
which is important for determine the operational efficiency of the entity. This ratio is very useful
for the use of the external funds by the manager for maintain their initial funds for getting the
benefits of the Tax because in this ratio tax deductible is used commonly. From the above ratio it
has been concluded that Tesco has higher ratio than the Sainsbury in both year 2018 and 2019
which means use of the proper internal and external funds for the capital gearing ratio which is
used by the Tesco in the better way as compared to the Sainsbury's. Apart from this Tesco is
focus on the managing the equity and debt properly (García-Meca and García-Sánchez, 2018).
7
Tesco
Sainsbury
0
1
2
3
3.28
1.97
2.31
1.78
Gearing ratio
2018 2019
Sainsbury
5.25.666.46.87.2
5.83
6.61
6.48
6.92
Gross profit margin
2018 2019
Gearing ratio- this ratio is very useful in compare the owners equities with the debt
which is important for determine the operational efficiency of the entity. This ratio is very useful
for the use of the external funds by the manager for maintain their initial funds for getting the
benefits of the Tax because in this ratio tax deductible is used commonly. From the above ratio it
has been concluded that Tesco has higher ratio than the Sainsbury in both year 2018 and 2019
which means use of the proper internal and external funds for the capital gearing ratio which is
used by the Tesco in the better way as compared to the Sainsbury's. Apart from this Tesco is
focus on the managing the equity and debt properly (García-Meca and García-Sánchez, 2018).
7
Tesco
Sainsbury
0
1
2
3
3.28
1.97
2.31
1.78
Gearing ratio
2018 2019
⊘ This is a preview!⊘
Do you want full access?
Subscribe today to unlock all pages.

Trusted by 1+ million students worldwide

Price earning ratio- This ratio is used for analyse the relation between the earning of the
form and their share price. This is the best ratio through which organization is able to attract the
investors and analyst by making the charts which help in determine the share price of the entity.
This is based on the calculation of both company. It has been analysed that Sainsbury's has
higher ratio than Tesco which is very important for showing the share values. Through this
investors earn more investment through large number of shares.
Tesco
Sainsbury
020406080100120140
38.22
106.39
41.56
123.6
Price earnings ratio
2018 2019
Earning per share- This ratio means profit earning capacity of the company which is
used for the allocation of the shares that is outstanding in the company. It is very helpful in
generated each entity which is useful for evaluation of each share. It is operate through the total
earnings. From the above ratio it has been analysed that it generate more earnings on the equity
shares which is beneficial for the equity shareholders. In 2019 this ratio is increasing for the
Tesco as compare to other firm (Habib and Huang, 2019).
8
Paraphrase This Document
Need a fresh take? Get an instant paraphrase of this document with our AI Paraphraser

Tesco
Sainsbury
01234567
4.96 4.75
6.14
4.06
Earnings per share
2018 2019
Return on capital employed- This ratio is very useful in deciding the capital efficiency
and profitability of the entity for determine the profit capacity of the firm in the systematic
manner. From the above ratio calculation it has been interpreted that Tesco has high capital
employed than the Sainsbury's which meansthey can easily operate their operational efficiency in
the perfect manner. In 2019 it is increasing for both the company which is very useful nin
determination of the comparison. Tesco perform better for the capital employed as compare to
Sainsbury's.
9
Tesco
Sainsbury
012345678910
6.14
4.43
9.34
4.97
Return on capital employed
2018 2019
Sainsbury
01234567
4.96 4.75
6.14
4.06
Earnings per share
2018 2019
Return on capital employed- This ratio is very useful in deciding the capital efficiency
and profitability of the entity for determine the profit capacity of the firm in the systematic
manner. From the above ratio calculation it has been interpreted that Tesco has high capital
employed than the Sainsbury's which meansthey can easily operate their operational efficiency in
the perfect manner. In 2019 it is increasing for both the company which is very useful nin
determination of the comparison. Tesco perform better for the capital employed as compare to
Sainsbury's.
9
Tesco
Sainsbury
012345678910
6.14
4.43
9.34
4.97
Return on capital employed
2018 2019

Average inventories turnover period- This ratio is useful for the determination of the
stock level in the company which is used for calculate the cost of goods sold for converting the
goods in sales. It is analysed that if it is low than it is very difficult to convey the raw material
into cash easily. Form the above calculation it has been analysed that Tesco has higher ratio as
compare to the Sainsbury's which means they convert the stock into cash in limited time. In the
2019 this ratio is decreasing for the Sainsbury's which means they are not able to maintain the
stock in sales (HACIOGLU and Dincer, 2016).
10
⊘ This is a preview!⊘
Do you want full access?
Subscribe today to unlock all pages.

Trusted by 1+ million students worldwide
1 out of 19
Related Documents
Your All-in-One AI-Powered Toolkit for Academic Success.
+13062052269
info@desklib.com
Available 24*7 on WhatsApp / Email
Unlock your academic potential
Copyright © 2020–2025 A2Z Services. All Rights Reserved. Developed and managed by ZUCOL.


