Comparative Analysis Report: Risk and Return of Portfolio Stocks

Verified

Added on  2021/05/30

|9
|1845
|228
Report
AI Summary
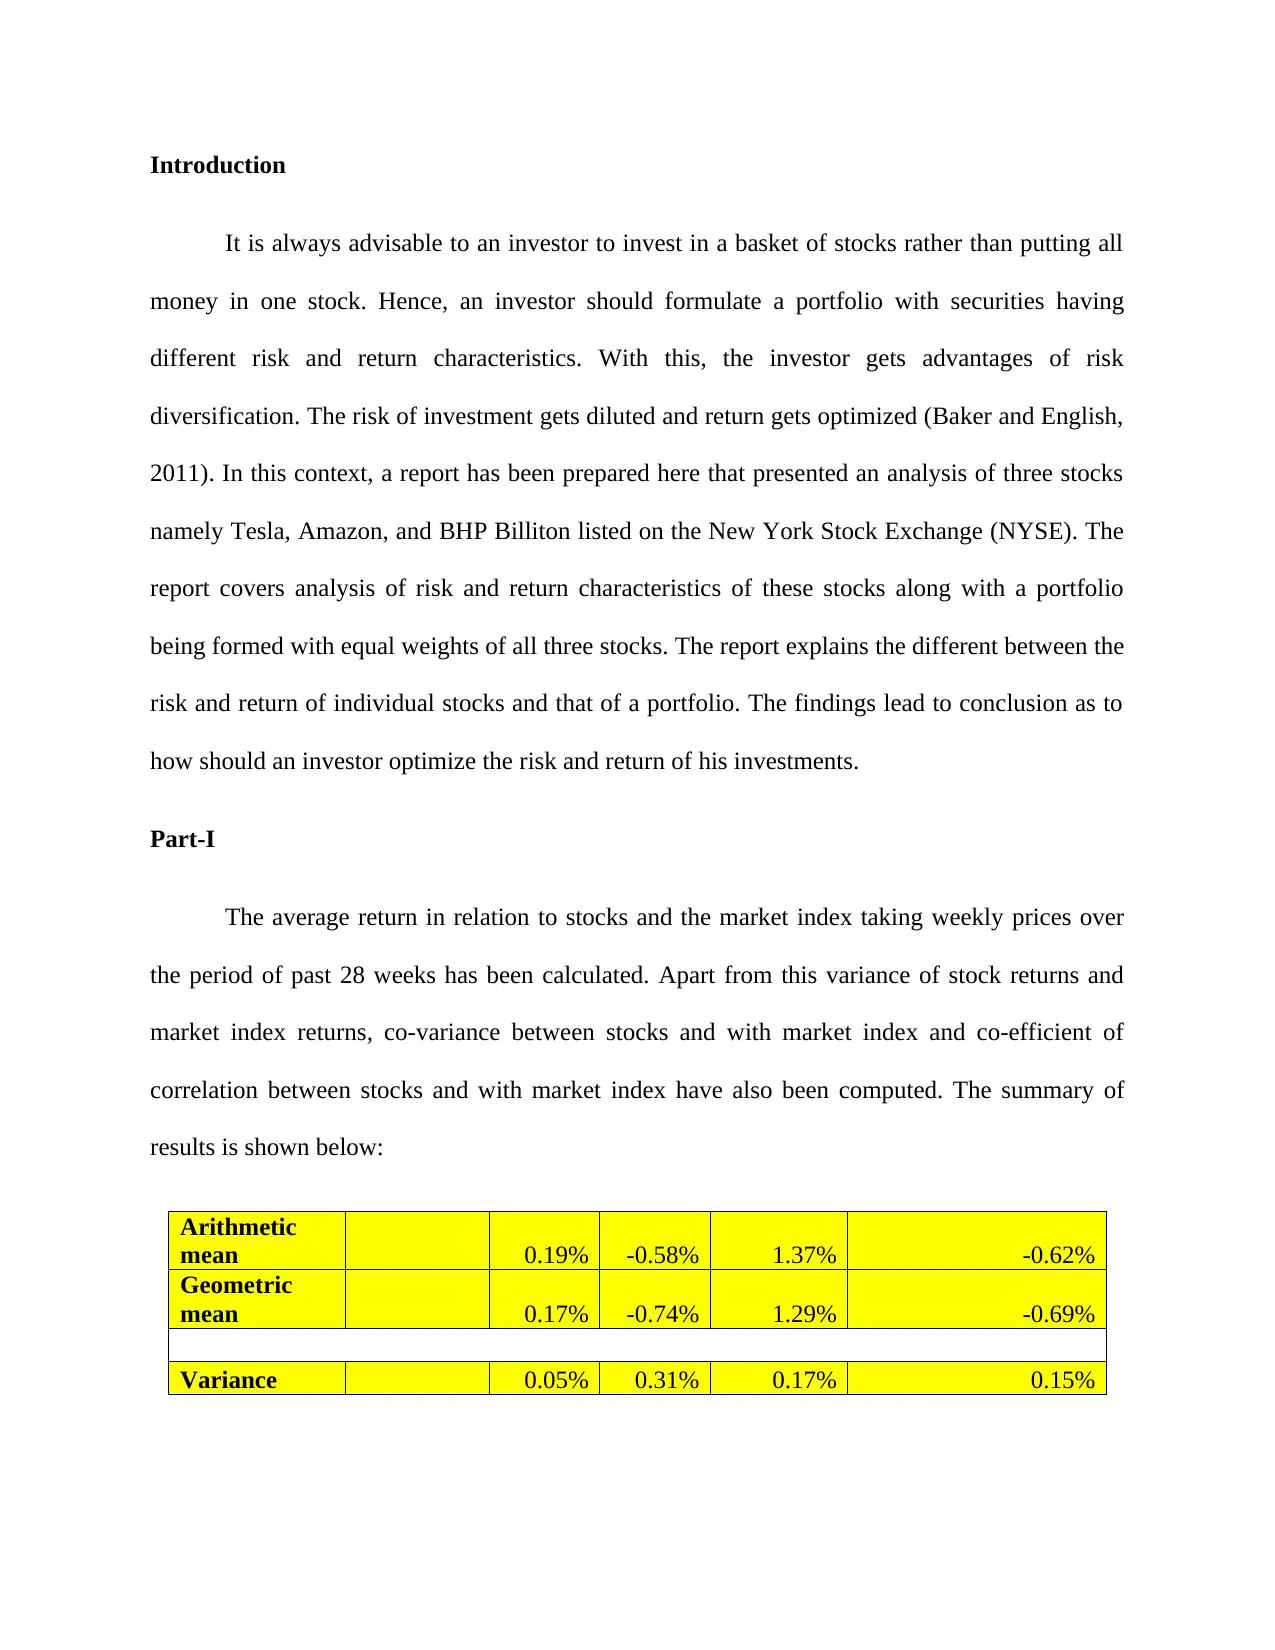
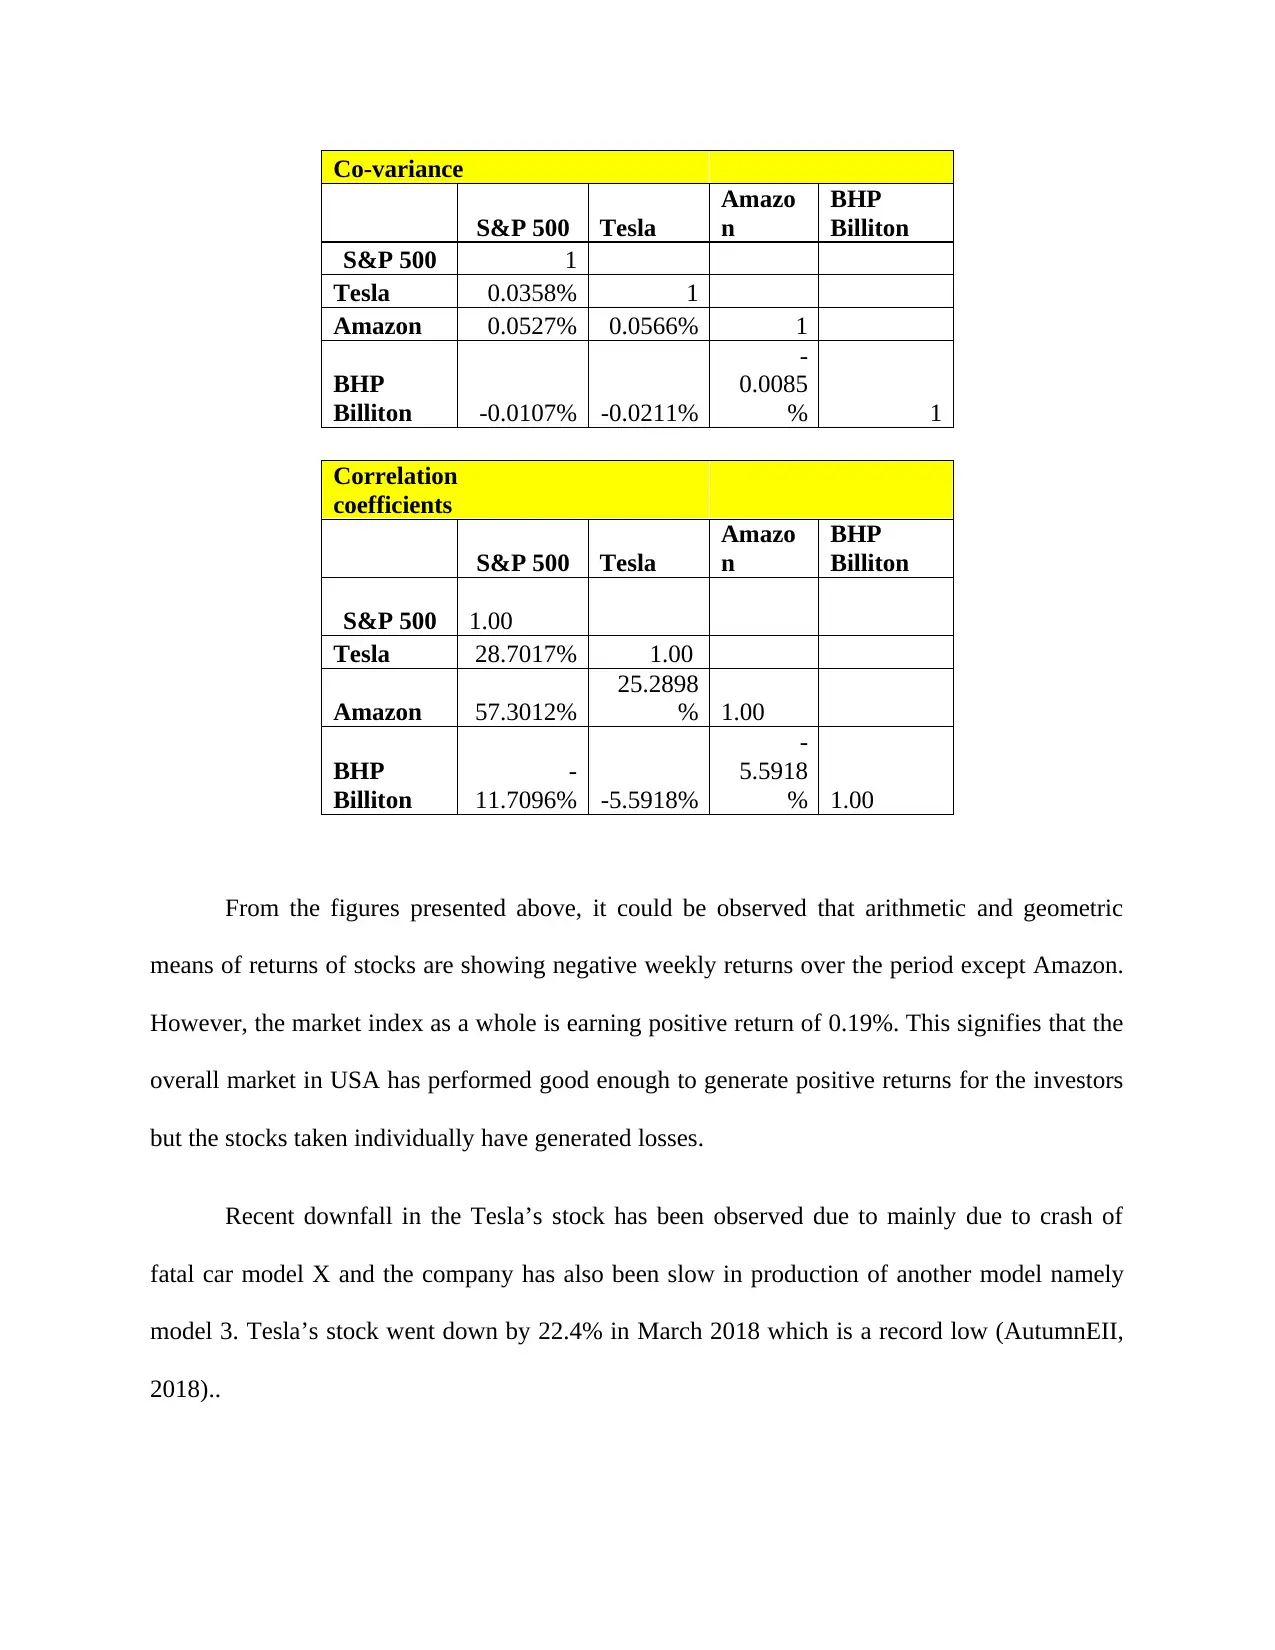
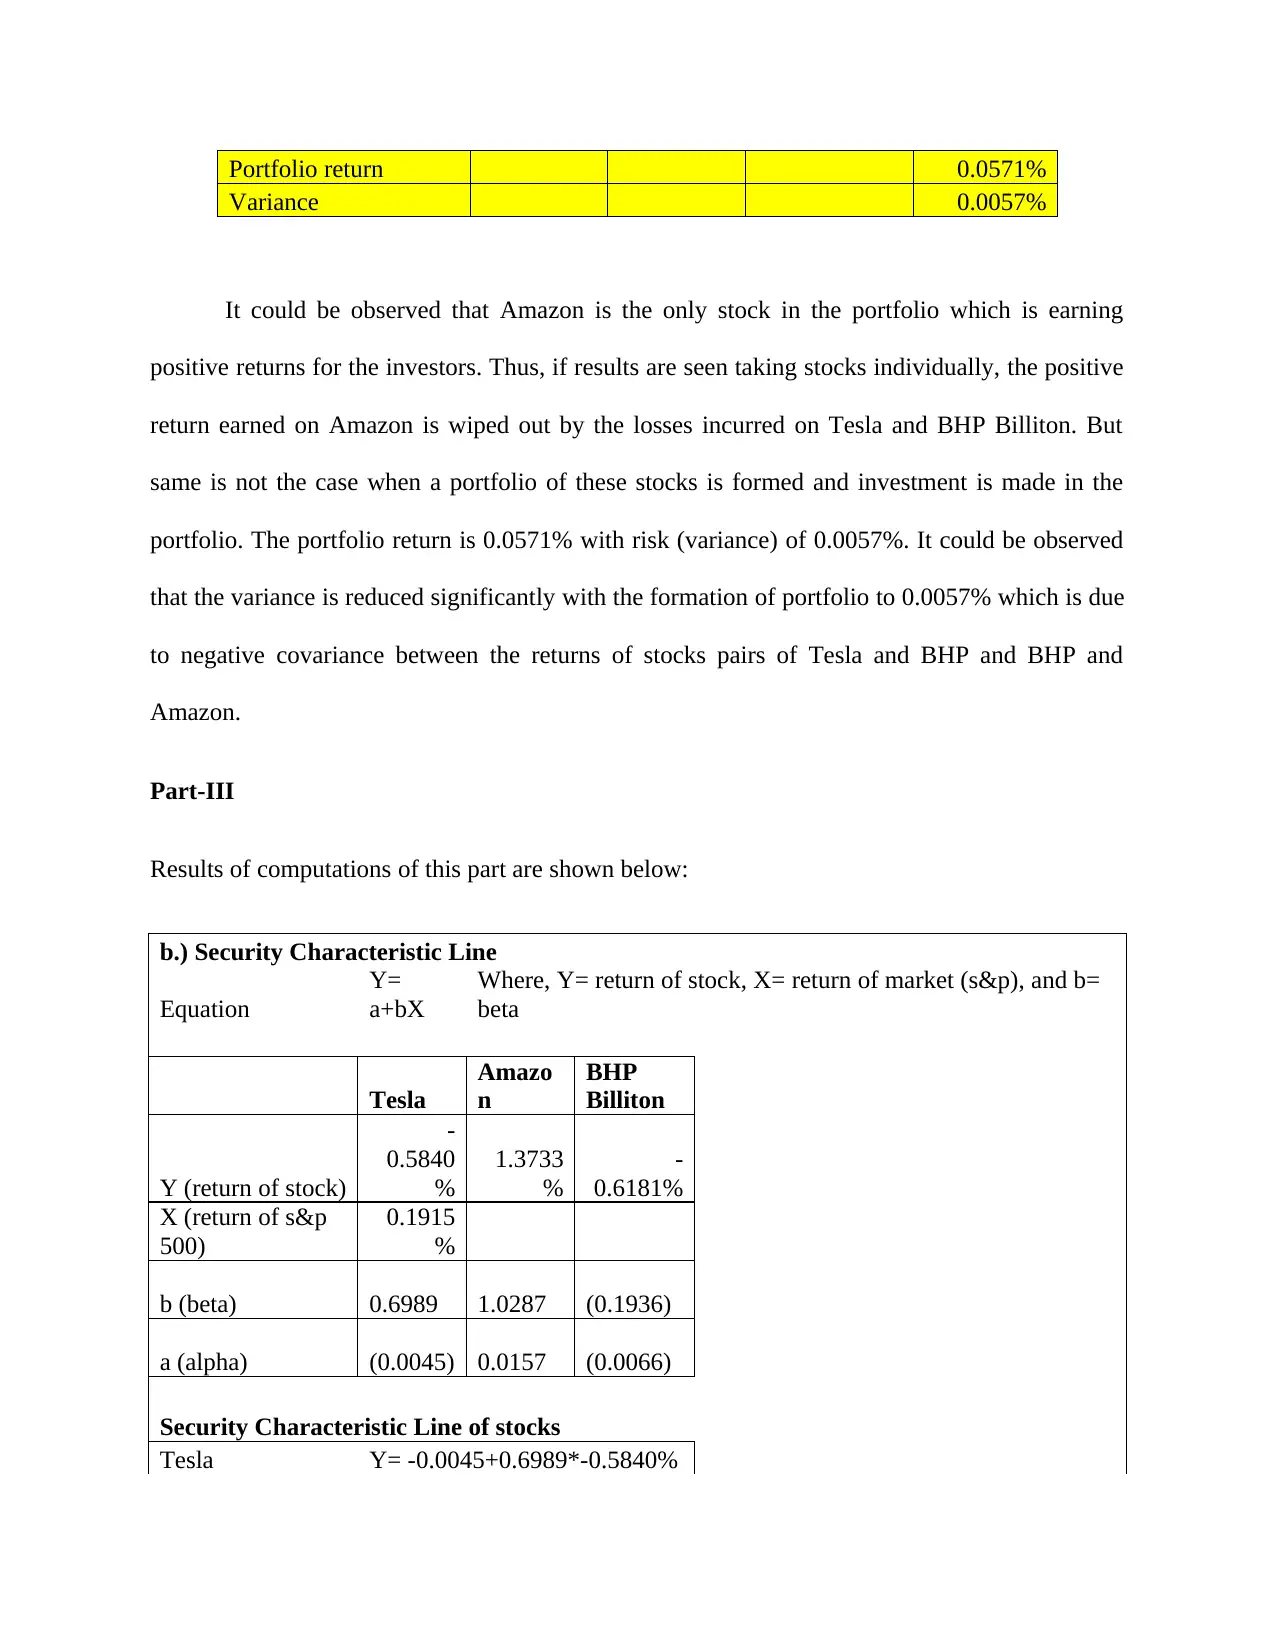
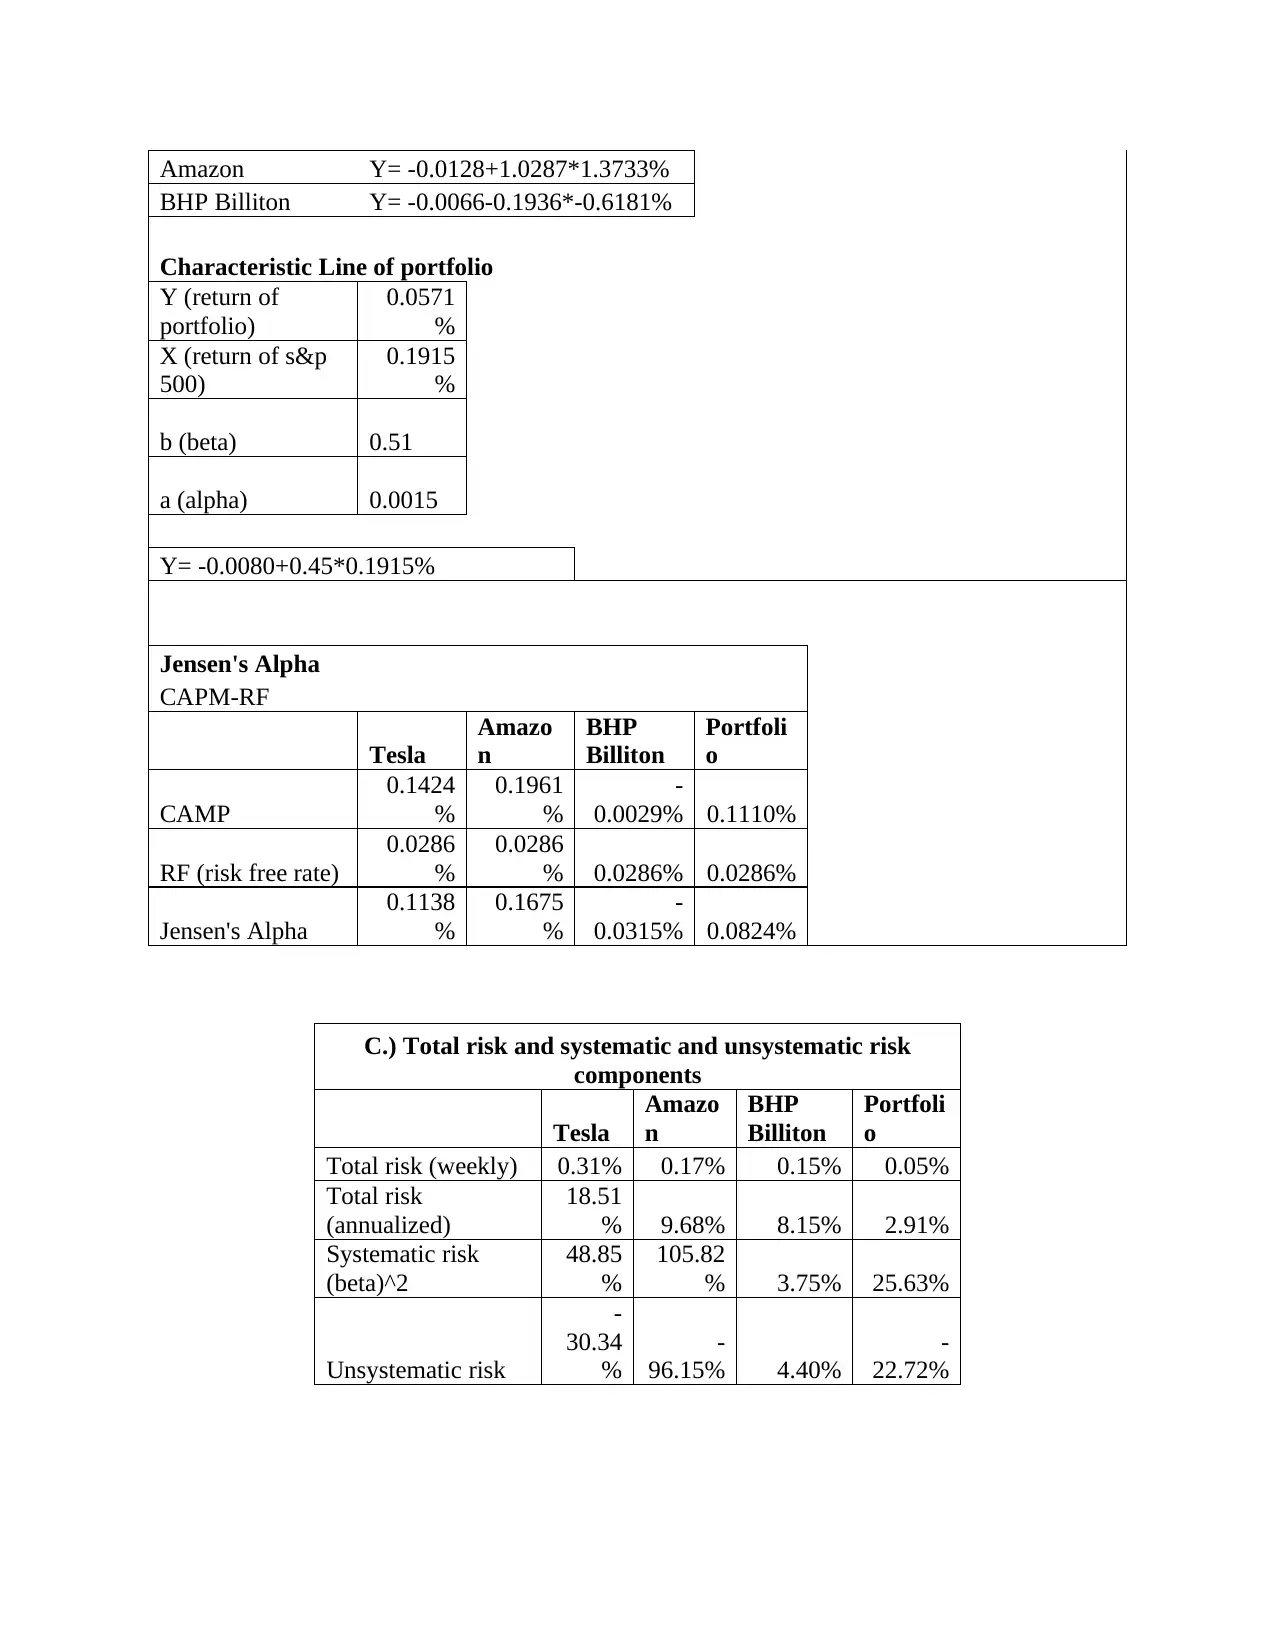
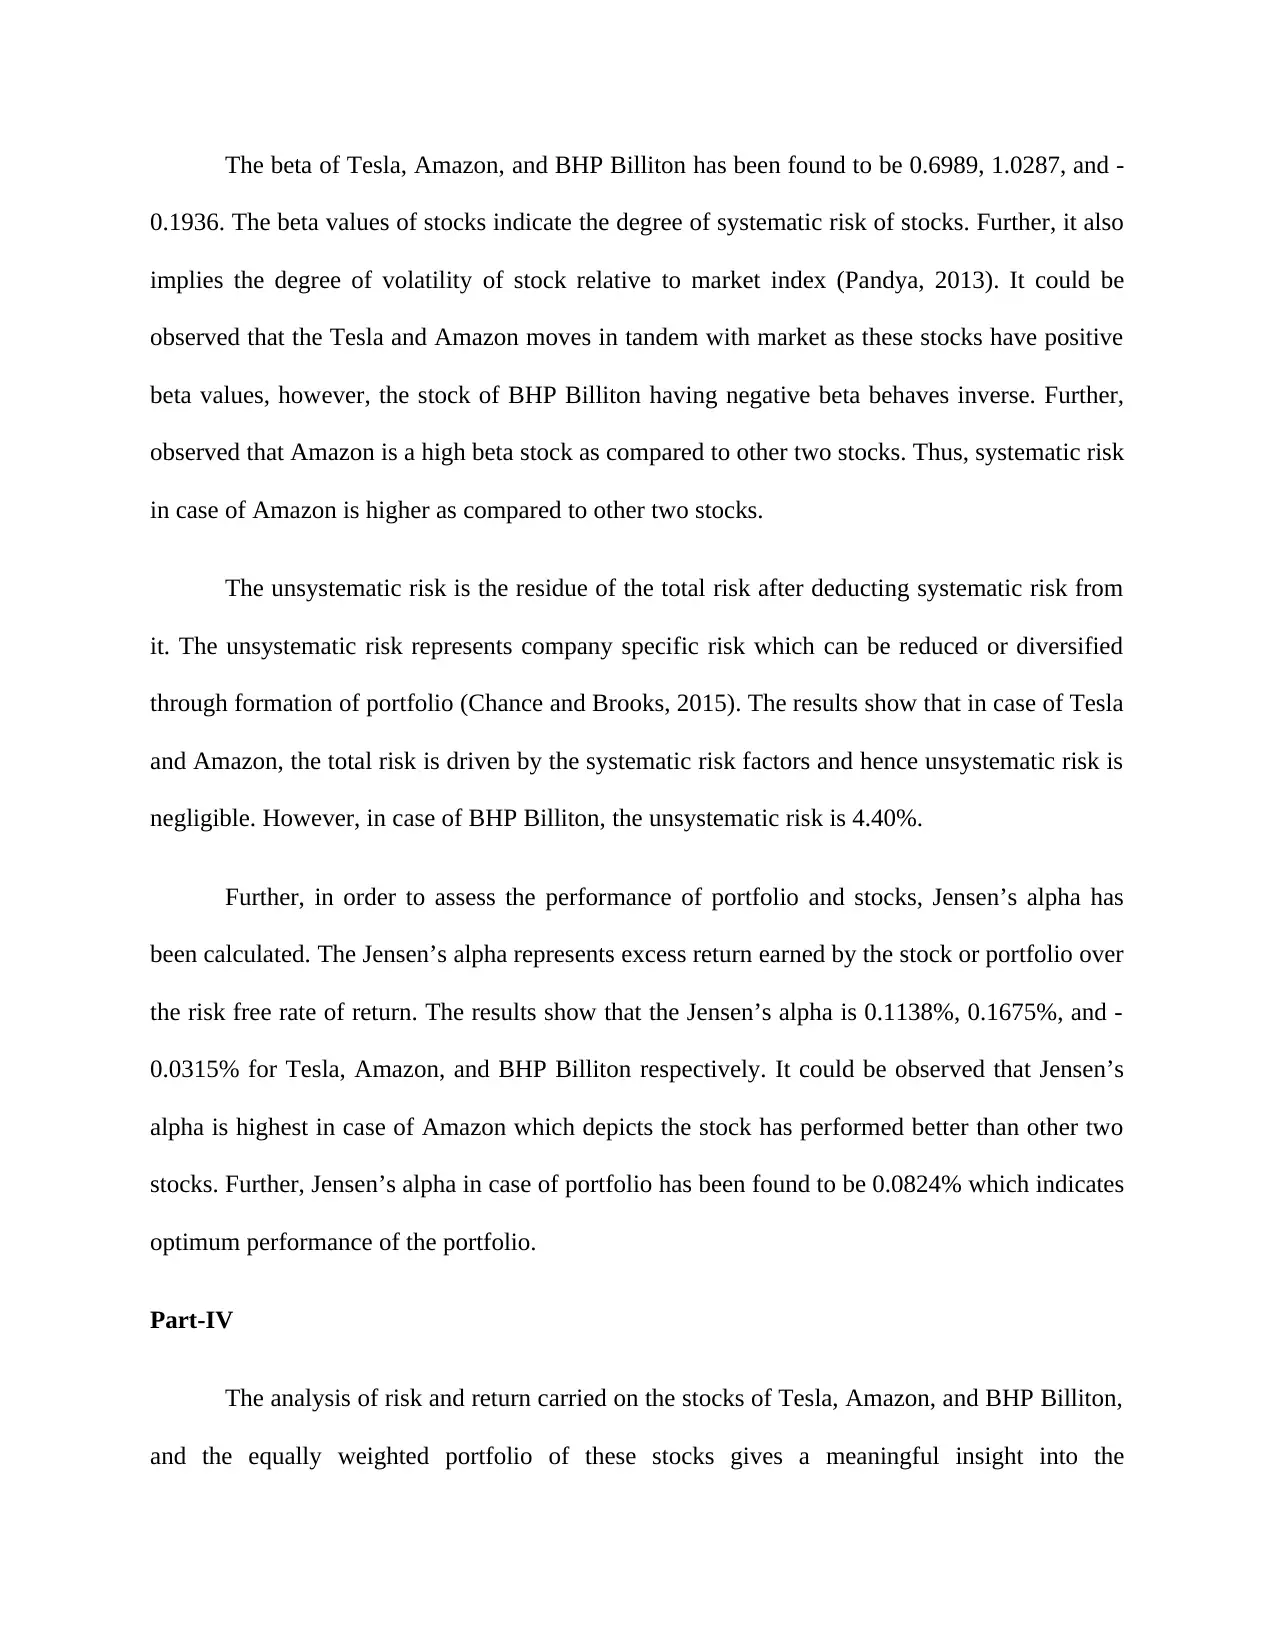
This report presents an analysis of portfolio management, focusing on the stocks of Tesla, Amazon, and BHP Billiton. It evaluates the risk and return characteristics of each stock, along with a portfolio constructed with equal weights of all three. The report examines weekly average returns, variances, covariances, and correlation coefficients, comparing individual stock performance to the portfolio's overall performance. The analysis includes calculations of beta, alpha, and systematic/unsystematic risk to assess the performance of each stock and the portfolio. Findings indicate that while individual stocks may exhibit losses, portfolio diversification can mitigate risk and optimize returns, as shown by the comparison of individual stock returns with portfolio returns and the reduction in variance. The report concludes with insights for investors seeking to optimize their investment strategies, considering both the benefits of diversification and the limitations of historical data-based analysis.
tabler-icon-diamond-filled.svg

Contribute Materials

Your contribution can guide someone’s learning journey. Share your documents today.
Document Page
Portfolio Management
tabler-icon-diamond-filled.svg

Secure Best Marks with AI Grader

Need help grading? Try our AI Grader for instant feedback on your assignments.
Document Page
Introduction
It is always advisable to an investor to invest in a basket of stocks rather than putting all
money in one stock. Hence, an investor should formulate a portfolio with securities having
different risk and return characteristics. With this, the investor gets advantages of risk
diversification. The risk of investment gets diluted and return gets optimized (Baker and English,
2011). In this context, a report has been prepared here that presented an analysis of three stocks
namely Tesla, Amazon, and BHP Billiton listed on the New York Stock Exchange (NYSE). The
report covers analysis of risk and return characteristics of these stocks along with a portfolio
being formed with equal weights of all three stocks. The report explains the different between the
risk and return of individual stocks and that of a portfolio. The findings lead to conclusion as to
how should an investor optimize the risk and return of his investments.
Part-I
The average return in relation to stocks and the market index taking weekly prices over
the period of past 28 weeks has been calculated. Apart from this variance of stock returns and
market index returns, co-variance between stocks and with market index and co-efficient of
correlation between stocks and with market index have also been computed. The summary of
results is shown below:
Arithmetic
mean 0.19% -0.58% 1.37% -0.62%
Geometric
mean 0.17% -0.74% 1.29% -0.69%
Variance 0.05% 0.31% 0.17% 0.15%
Document Page
Co-variance
S&P 500 Tesla
Amazo
n
BHP
Billiton
S&P 500 1
Tesla 0.0358% 1
Amazon 0.0527% 0.0566% 1
BHP
Billiton -0.0107% -0.0211%
-
0.0085
% 1
Correlation
coefficients
S&P 500 Tesla
Amazo
n
BHP
Billiton
S&P 500 1.00
Tesla 28.7017% 1.00
Amazon 57.3012%
25.2898
% 1.00
BHP
Billiton
-
11.7096% -5.5918%
-
5.5918
% 1.00
From the figures presented above, it could be observed that arithmetic and geometric
means of returns of stocks are showing negative weekly returns over the period except Amazon.
However, the market index as a whole is earning positive return of 0.19%. This signifies that the
overall market in USA has performed good enough to generate positive returns for the investors
but the stocks taken individually have generated losses.
Recent downfall in the Tesla’s stock has been observed due to mainly due to crash of
fatal car model X and the company has also been slow in production of another model namely
model 3. Tesla’s stock went down by 22.4% in March 2018 which is a record low (AutumnEII,
2018)..
Document Page
Figure 1: Tesla stock performance over past 6 months
[Source: https://finance.yahoo.com/quote/TSLA?p=TSLA]
However, Amazon has earned a weekly return of 1.37%. The company is growing rapidly
and latest merger deal with India’s one of the biggest retailers Flipkart has caused upward
movements in the price of Amazon’s stock (Economictimes, 2018). In regards to BHP Billiton, it
has been observed that the company is facing industry wide downfall all over the world. The
reduction in demand of coal and Iron ore has caused the company to lose its share prices.
Part-II
In this part, the return and risk of portfolio formulated with equal weights of all three
stocks and the return and risk of individual stocks has been compared based on data presented
below:
Stocks
Tesla Amazon BHP Billiton
Weights 33.3333% 33.3333% 33.3333%
Weekly Average
Returns -0.5840% 1.3733% -0.6181%
Variance 0.3150% 0.1712% 0.1452%
Covariance 0.0566% -0.0107% -0.0211%
tabler-icon-diamond-filled.svg

Secure Best Marks with AI Grader

Need help grading? Try our AI Grader for instant feedback on your assignments.
Document Page
Portfolio return 0.0571%
Variance 0.0057%
It could be observed that Amazon is the only stock in the portfolio which is earning
positive returns for the investors. Thus, if results are seen taking stocks individually, the positive
return earned on Amazon is wiped out by the losses incurred on Tesla and BHP Billiton. But
same is not the case when a portfolio of these stocks is formed and investment is made in the
portfolio. The portfolio return is 0.0571% with risk (variance) of 0.0057%. It could be observed
that the variance is reduced significantly with the formation of portfolio to 0.0057% which is due
to negative covariance between the returns of stocks pairs of Tesla and BHP and BHP and
Amazon.
Part-III
Results of computations of this part are shown below:
b.) Security Characteristic Line
Equation
Y=
a+bX
Where, Y= return of stock, X= return of market (s&p), and b=
beta
Tesla
Amazo
n
BHP
Billiton
Y (return of stock)
-
0.5840
%
1.3733
%
-
0.6181%
X (return of s&p
500)
0.1915
%
b (beta) 0.6989 1.0287 (0.1936)
a (alpha) (0.0045) 0.0157 (0.0066)
Security Characteristic Line of stocks
Tesla Y= -0.0045+0.6989*-0.5840%
Document Page
Amazon Y= -0.0128+1.0287*1.3733%
BHP Billiton Y= -0.0066-0.1936*-0.6181%
Characteristic Line of portfolio
Y (return of
portfolio)
0.0571
%
X (return of s&p
500)
0.1915
%
b (beta) 0.51
a (alpha) 0.0015
Y= -0.0080+0.45*0.1915%
Jensen's Alpha
CAPM-RF
Tesla
Amazo
n
BHP
Billiton
Portfoli
o
CAMP
0.1424
%
0.1961
%
-
0.0029% 0.1110%
RF (risk free rate)
0.0286
%
0.0286
% 0.0286% 0.0286%
Jensen's Alpha
0.1138
%
0.1675
%
-
0.0315% 0.0824%
C.) Total risk and systematic and unsystematic risk
components
Tesla
Amazo
n
BHP
Billiton
Portfoli
o
Total risk (weekly) 0.31% 0.17% 0.15% 0.05%
Total risk
(annualized)
18.51
% 9.68% 8.15% 2.91%
Systematic risk
(beta)^2
48.85
%
105.82
% 3.75% 25.63%
Unsystematic risk
-
30.34
%
-
96.15% 4.40%
-
22.72%
Document Page
The beta of Tesla, Amazon, and BHP Billiton has been found to be 0.6989, 1.0287, and -
0.1936. The beta values of stocks indicate the degree of systematic risk of stocks. Further, it also
implies the degree of volatility of stock relative to market index (Pandya, 2013). It could be
observed that the Tesla and Amazon moves in tandem with market as these stocks have positive
beta values, however, the stock of BHP Billiton having negative beta behaves inverse. Further,
observed that Amazon is a high beta stock as compared to other two stocks. Thus, systematic risk
in case of Amazon is higher as compared to other two stocks.
The unsystematic risk is the residue of the total risk after deducting systematic risk from
it. The unsystematic risk represents company specific risk which can be reduced or diversified
through formation of portfolio (Chance and Brooks, 2015). The results show that in case of Tesla
and Amazon, the total risk is driven by the systematic risk factors and hence unsystematic risk is
negligible. However, in case of BHP Billiton, the unsystematic risk is 4.40%.
Further, in order to assess the performance of portfolio and stocks, Jensen’s alpha has
been calculated. The Jensen’s alpha represents excess return earned by the stock or portfolio over
the risk free rate of return. The results show that the Jensen’s alpha is 0.1138%, 0.1675%, and -
0.0315% for Tesla, Amazon, and BHP Billiton respectively. It could be observed that Jensen’s
alpha is highest in case of Amazon which depicts the stock has performed better than other two
stocks. Further, Jensen’s alpha in case of portfolio has been found to be 0.0824% which indicates
optimum performance of the portfolio.
Part-IV
The analysis of risk and return carried on the stocks of Tesla, Amazon, and BHP Billiton,
and the equally weighted portfolio of these stocks gives a meaningful insight into the
tabler-icon-diamond-filled.svg

Paraphrase This Document

Need a fresh take? Get an instant paraphrase of this document with our AI Paraphraser
Document Page
performance. The analysis revealed the average return earned on the stocks over the period of
time which could form a solid basis to predict the future movement in the stock’s prices. Further,
the analysis of variance revealed the risk or volatility of the returns which is one of the primary
concerns of an investor. The covariance and coefficient of correlation were calculated which
show relationship between the returns of stocks. The identification of this relationship is essential
to form a perfect portfolio that can generate optimum returns with minimum risk (Kevin, 2015).
Further, total risk has been analyzed in detail bifurcating into systematic and unsystematic risk
components. This bifurcation is also necessary to form a portfolio which diversifies the risk
adequately. Hence, overall, the analysis conducted in relation to risk and return of the stock and
portfolio in this report is quite useful for an investor seeking to invest his money.
However, there are certain limitations of this analysis such as it does not consider the
future aspect of the performance. It is entirely based on the analysis of historical data. Further,
there are other indicator of risk and return apart from variance, arithmetic mean, and geometric
mean which have not been considered in this analysis (Kevin, 2015). For example, an investor
could consider reputation of company in the market, the composition of its board of directors
could also reveal meaningful insight into capacity of a stock.
Further analysis of financial statements could be conducted to get insight into the state of
affairs of the company. Apart from this, it would also be necessary for the investor to analyze the
future prospects by review future plans of the companies.
Document Page
References
AutumnEII, K. 2018. Tesla's stock is falling for two reasons: UBS analyst. Accessed May 12,
2018 https://www.cnbc.com/2018/04/02/tesla-stocks-plunge-for-two-reasons-ubs-analyst.html
Economictimes. 2018. Flipkart-Amazon combine may face close scrutiny for competition
aspects. Accessed May 12, 2018
https://economictimes.indiatimes.com/small-biz/startups/newsbuzz/flipkart-amazon-combine-
may-face-close-scrutiny-for-competition-aspects/articleshow/63665561.cms
Baker, K.H. and English, P. 2011. Capital Budgeting Valuation: Financial Analysis for Today's
Investment Projects. John Wiley & Sons.
Pandya, F.H. 2013. Security Analysis and Portfolio Management. Jaico Publishing House.
Chance, D.M. and Brooks, R. 2015. Introduction to Derivatives and Risk Management. Cengage
Learning.
Kevin, S. 2015. Security Analysis And Portfolio Management. PHI Learning Pvt. Ltd.
chevron_up_icon
1 out of 9
circle_padding
hide_on_mobile
zoom_out_icon
logo.png

Your All-in-One AI-Powered Toolkit for Academic Success.

Available 24*7 on WhatsApp / Email

[object Object]