Comparative Financial Analysis: Tesla and Daimler (2014-2017)
VerifiedAdded on 2020/12/29
|33
|7802
|356
Report
AI Summary
This report provides a comprehensive financial analysis of Tesla and Daimler, comparing their performance from 2014 to 2017. It employs ratio analysis to assess liquidity, profitability, efficiency, and leverage. The report includes detailed horizontal and vertical analyses of both companies' profit and loss statements and balance sheets, offering insights into their revenue trends, expense management, and asset utilization. The analysis highlights Daimler's stronger financial position across various metrics, while also addressing Tesla's challenges and improvements over the period. The report also examines the cash positions of both companies and concludes by summarizing the key findings and contrasting the financial strengths and weaknesses of each organization, emphasizing Daimler's overall financial health and Tesla's financial challenges during the analyzed timeframe.

FAME
Paraphrase This Document
Need a fresh take? Get an instant paraphrase of this document with our AI Paraphraser
TABLE OF CONTENTS
INTRODUCTION...........................................................................................................................1
1. Critically contrasting and comparing financial performance of Tesla and Daimler (2014-
2017)............................................................................................................................................1
Ratio Analysis..............................................................................................................................1
Tesla's Horizontal statement of profit and loss..........................................................................13
Tesla's Horizontal statement of Balance sheet...........................................................................13
Tesla's Vertical statement of profit and loss..............................................................................14
Tesla's Vertical statement of Balance sheet...............................................................................14
Daimler's Horizontal statement of profit and loss.....................................................................14
Daimler's Horizontal statement of Balance sheet......................................................................14
Daimler's Vertical statement of profit and loss..........................................................................15
Daimler's Vertical statement of Balance sheet..........................................................................15
2. Cash position .........................................................................................................................15
CONCLUSION..............................................................................................................................16
REFERENCES..............................................................................................................................17
APPENDIX....................................................................................................................................18
Daimler's Horizontal analysis of statement of profit and loss...................................................18
Daimler's Horizontal analysis of statement of financial position..............................................18
Daimler's Vertical analysis of statement of profit and loss.......................................................20
Daimler's Vertical analysis of statement of financial position..................................................22
Tesla's horizontal analysis of statement of profit and loss.........................................................24
Tesla's horizontal analysis of statement of financial position....................................................25
Tesla's vertical analysis of statement of profit and loss.............................................................27
Tesla's vertical analysis of statement of financial position........................................................28
INTRODUCTION
Financial analysis is referred as assessment about viability, solvent, stable along with
profitability of business. It might be considered as measuring how fund could be invested in
effective aspect. The main application of this analysis is to evaluate various economic trends,
building long term plans for activity of business, setting financial policy and to determine
companies or project for investment. Generally, it is performed by synthesizing financial
numbers along with data. The financial analysis could be done by different methods such as ratio
analysis, horizontal and vertical analysis. The present report will give brief discussion about
Tesla and Daimler along with their comparison during 2014 to 2017. Daimler and Tesla both are
in similar industry as Tesla is American energy organization and Daimler as German
multinational corporation. In the similar aspect, it will articulate financial weakness and strength
by stating strong company with its financial backgrounds. Further, it will reflect cash position of
both organization and perform critical evaluation in same time period with specific findings.
1. Critically contrasting and comparing financial performance of Tesla and Daimler (2014-2017)
Ratio Analysis
Liquidity ratio
Daimler
T
e
s
l
a
Tesla
Particular
s Formula 2014 2015 2016 2017 2014 2015 2016 2017
Current
Ratio
Current Assets /
Current Liability 1.15 1.19 1.21 1.23 1.52 0.99 1.07 0.86
1
⊘ This is a preview!⊘
Do you want full access?
Subscribe today to unlock all pages.
Trusted by 1+ million students worldwide
Quick
ratio
(Current asset-
Inventory)/Curren
t Liability
0.84 0.88 0.90 0.92 1.02 0.49 0.69 0.53
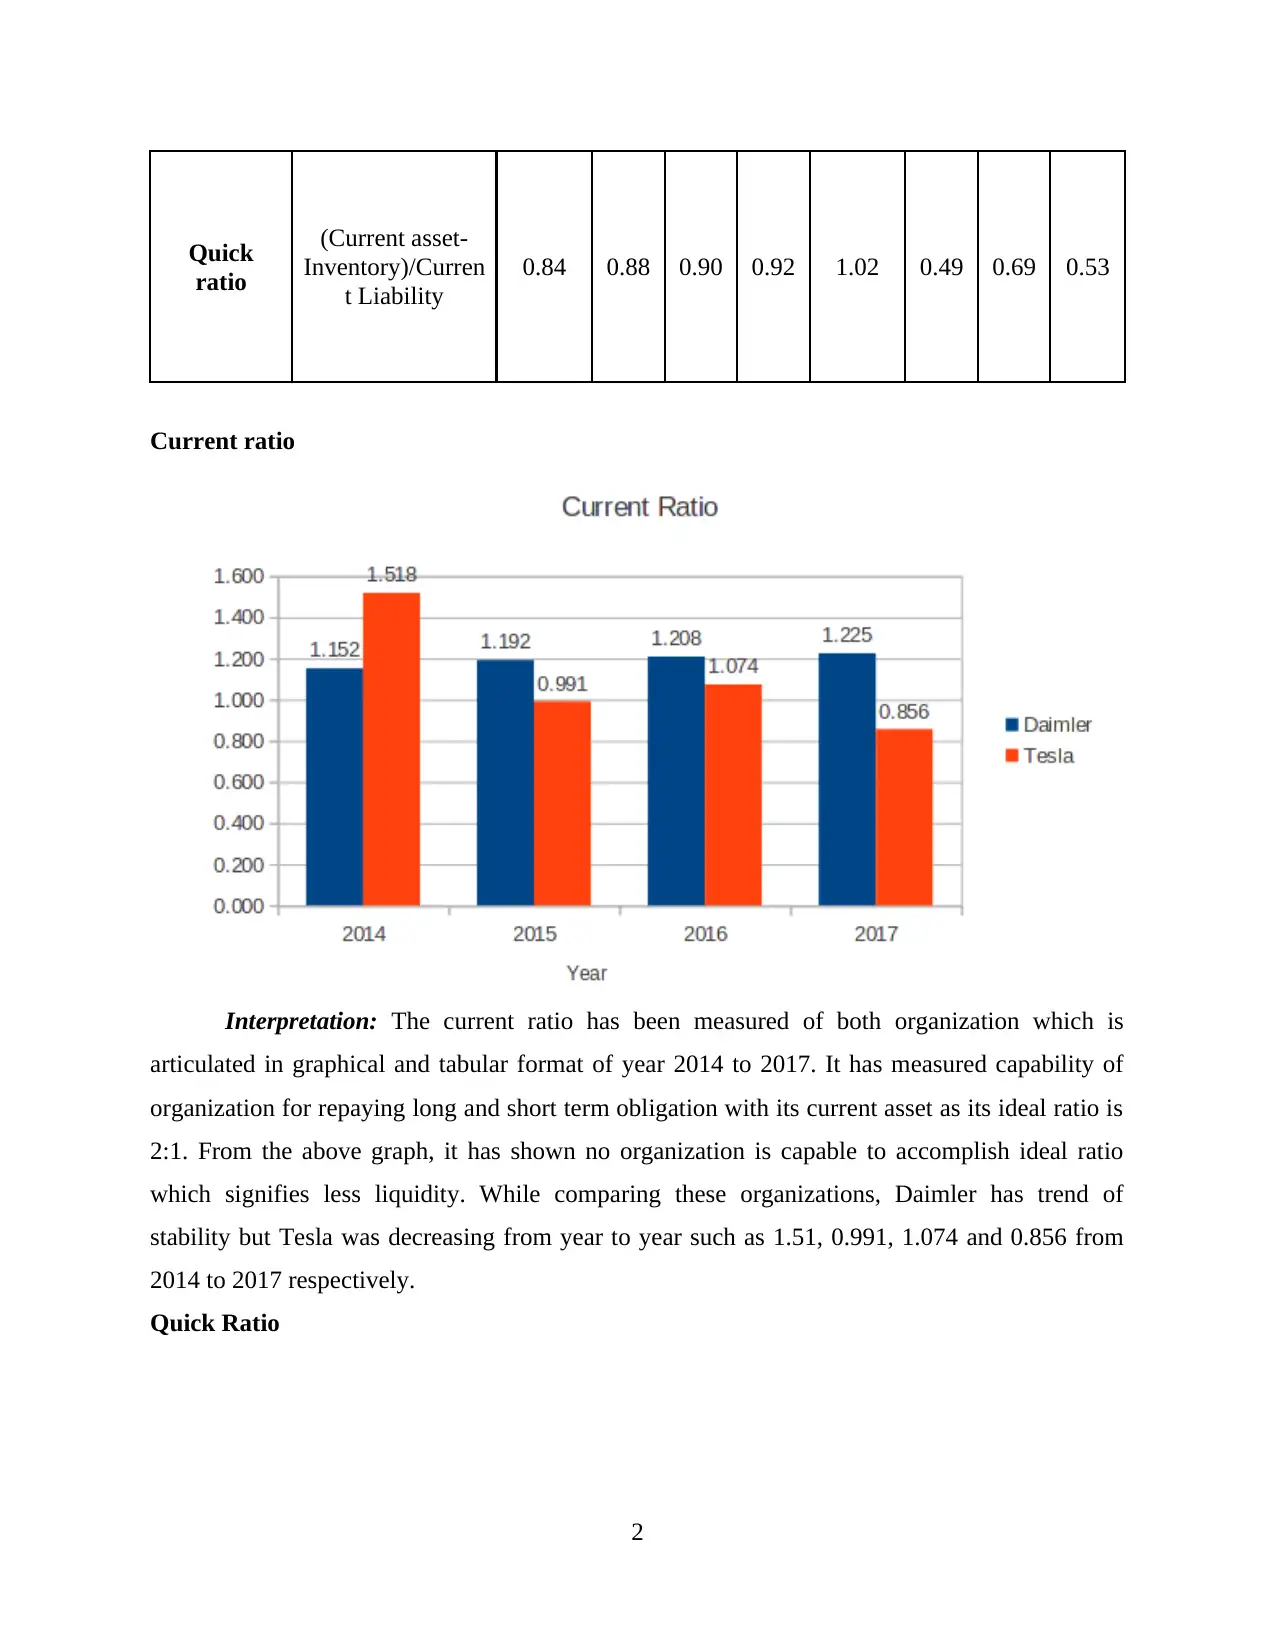
Current ratio
Interpretation: The current ratio has been measured of both organization which is
articulated in graphical and tabular format of year 2014 to 2017. It has measured capability of
organization for repaying long and short term obligation with its current asset as its ideal ratio is
2:1. From the above graph, it has shown no organization is capable to accomplish ideal ratio
which signifies less liquidity. While comparing these organizations, Daimler has trend of
stability but Tesla was decreasing from year to year such as 1.51, 0.991, 1.074 and 0.856 from
2014 to 2017 respectively.
Quick Ratio
2
ratio
(Current asset-
Inventory)/Curren
t Liability
0.84 0.88 0.90 0.92 1.02 0.49 0.69 0.53
Current ratio
Interpretation: The current ratio has been measured of both organization which is
articulated in graphical and tabular format of year 2014 to 2017. It has measured capability of
organization for repaying long and short term obligation with its current asset as its ideal ratio is
2:1. From the above graph, it has shown no organization is capable to accomplish ideal ratio
which signifies less liquidity. While comparing these organizations, Daimler has trend of
stability but Tesla was decreasing from year to year such as 1.51, 0.991, 1.074 and 0.856 from
2014 to 2017 respectively.
Quick Ratio
2
Paraphrase This Document
Need a fresh take? Get an instant paraphrase of this document with our AI Paraphraser
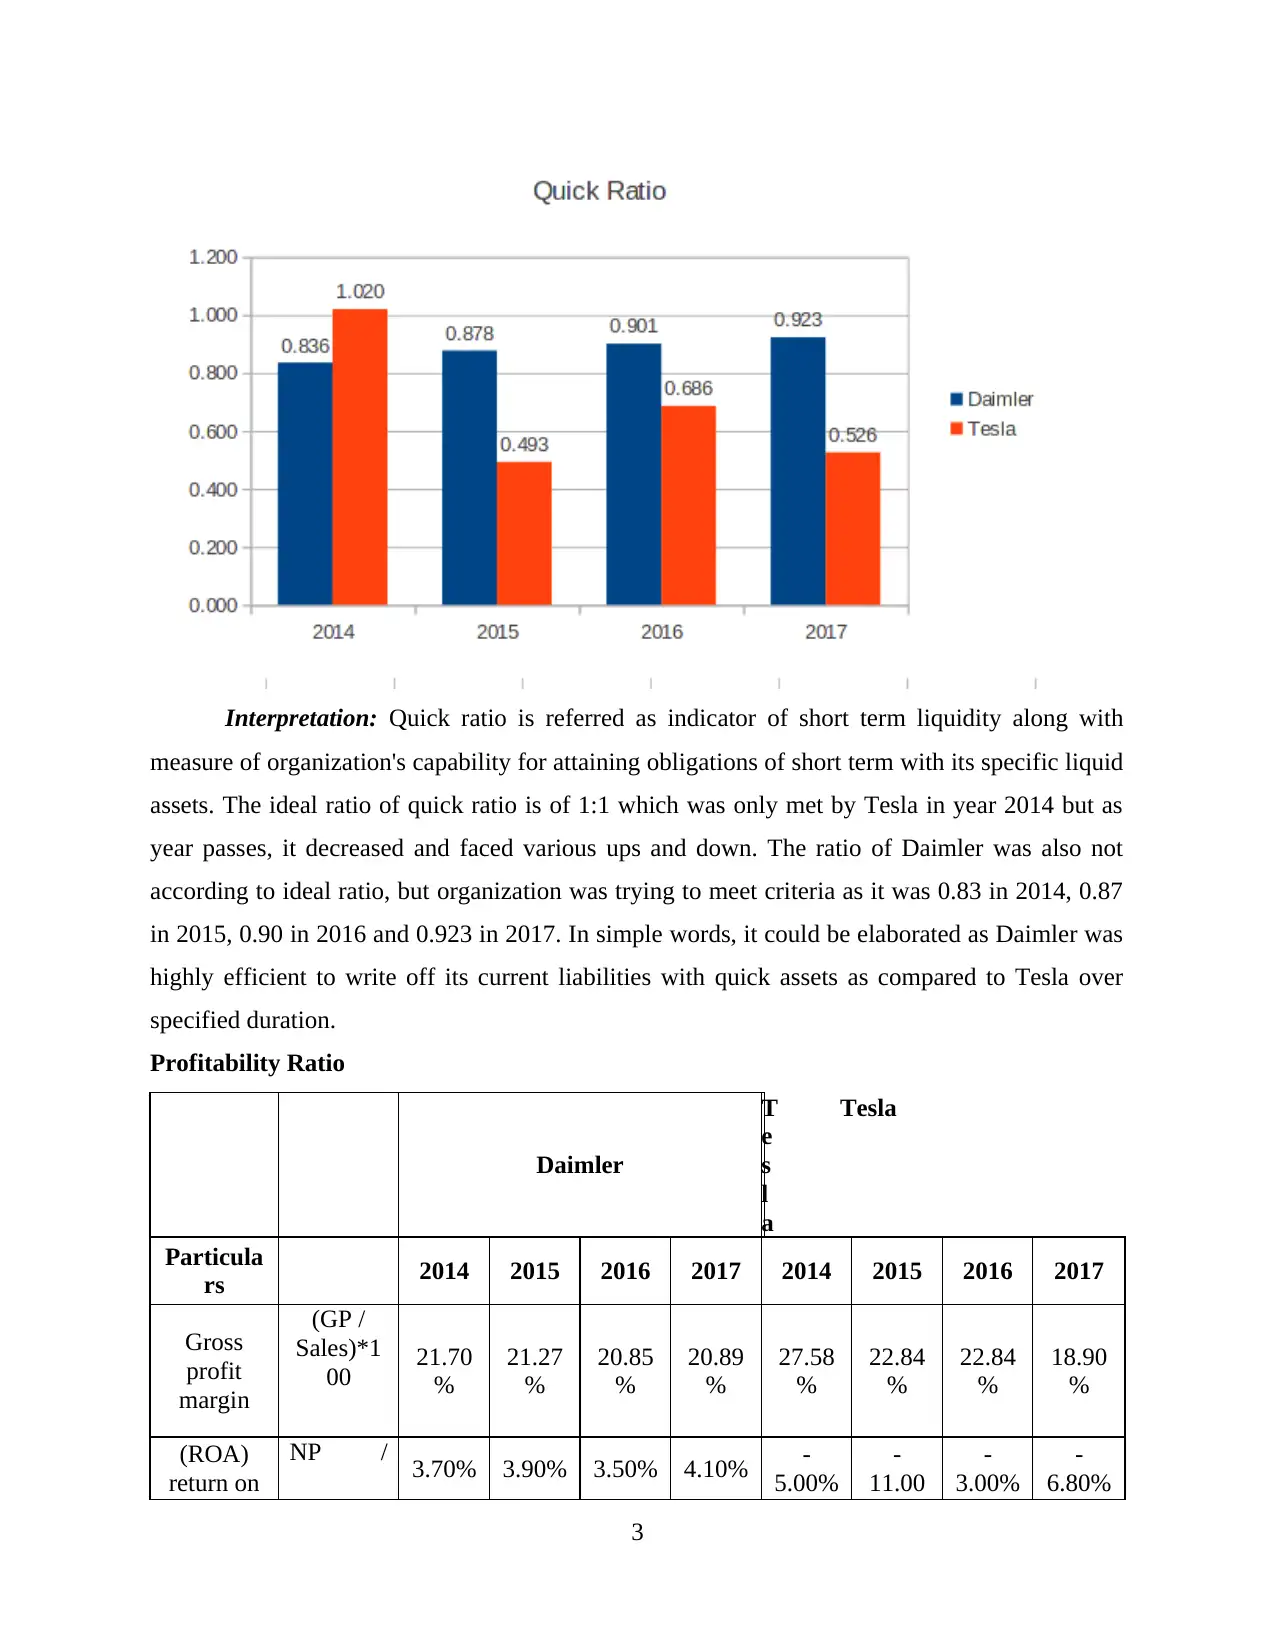
Interpretation: Quick ratio is referred as indicator of short term liquidity along with
measure of organization's capability for attaining obligations of short term with its specific liquid
assets. The ideal ratio of quick ratio is of 1:1 which was only met by Tesla in year 2014 but as
year passes, it decreased and faced various ups and down. The ratio of Daimler was also not
according to ideal ratio, but organization was trying to meet criteria as it was 0.83 in 2014, 0.87
in 2015, 0.90 in 2016 and 0.923 in 2017. In simple words, it could be elaborated as Daimler was
highly efficient to write off its current liabilities with quick assets as compared to Tesla over
specified duration.
Profitability Ratio
Daimler
T
e
s
l
a
Tesla
Particula
rs 2014 2015 2016 2017 2014 2015 2016 2017
Gross
profit
margin
(GP /
Sales)*1
00 21.70
%
21.27
%
20.85
%
20.89
%
27.58
%
22.84
%
22.84
%
18.90
%
(ROA)
return on
NP / 3.70% 3.90% 3.50% 4.10% -
5.00%
-
11.00
-
3.00%
-
6.80%
3
Assets
Total
Assets %
(ROCE)R
eturn on
capital
employed
Net
operating
profit /
Capital
employe
d)
7.70% 9.00% 7.60% 7.70% -
5.00%
-
13.60
%
-
4.00%
-
7.80%
(ROE)
Return on
Equity
Profit /
Net
worth
15.90
%
15.70
%
14.70
%
16.40
%
-
32.20
%
-
81.60
%
-
14.20
%
-
46.30
%
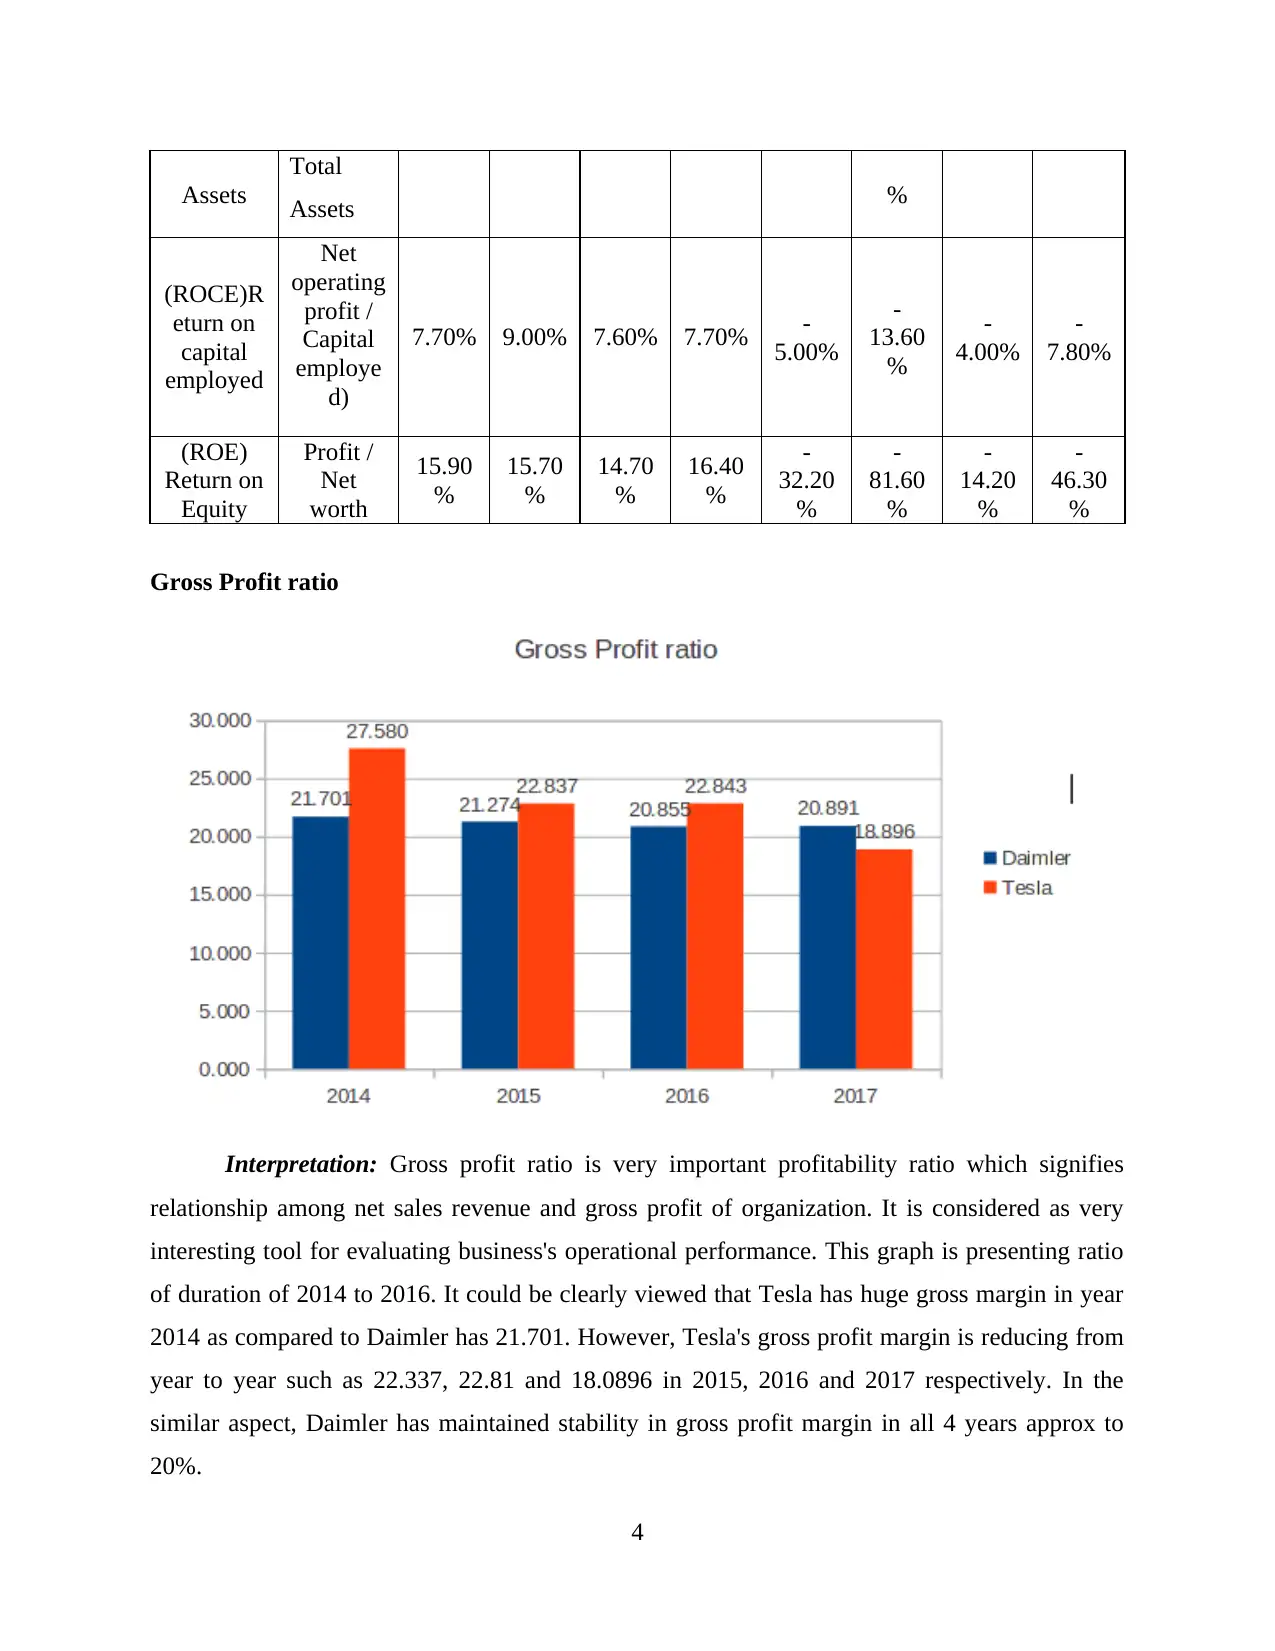
Gross Profit ratio
Interpretation: Gross profit ratio is very important profitability ratio which signifies
relationship among net sales revenue and gross profit of organization. It is considered as very
interesting tool for evaluating business's operational performance. This graph is presenting ratio
of duration of 2014 to 2016. It could be clearly viewed that Tesla has huge gross margin in year
2014 as compared to Daimler has 21.701. However, Tesla's gross profit margin is reducing from
year to year such as 22.337, 22.81 and 18.0896 in 2015, 2016 and 2017 respectively. In the
similar aspect, Daimler has maintained stability in gross profit margin in all 4 years approx to
20%.
4
Total
Assets %
(ROCE)R
eturn on
capital
employed
Net
operating
profit /
Capital
employe
d)
7.70% 9.00% 7.60% 7.70% -
5.00%
-
13.60
%
-
4.00%
-
7.80%
(ROE)
Return on
Equity
Profit /
Net
worth
15.90
%
15.70
%
14.70
%
16.40
%
-
32.20
%
-
81.60
%
-
14.20
%
-
46.30
%
Gross Profit ratio
Interpretation: Gross profit ratio is very important profitability ratio which signifies
relationship among net sales revenue and gross profit of organization. It is considered as very
interesting tool for evaluating business's operational performance. This graph is presenting ratio
of duration of 2014 to 2016. It could be clearly viewed that Tesla has huge gross margin in year
2014 as compared to Daimler has 21.701. However, Tesla's gross profit margin is reducing from
year to year such as 22.337, 22.81 and 18.0896 in 2015, 2016 and 2017 respectively. In the
similar aspect, Daimler has maintained stability in gross profit margin in all 4 years approx to
20%.
4
⊘ This is a preview!⊘
Do you want full access?
Subscribe today to unlock all pages.
Trusted by 1+ million students worldwide

Return on Asset
Interpretation: It is an indicator which helps in measuring profit is earned by
organization with reference to its assets. It also traces efficiency of management of organization
for producing earnings through various economic resources in its statement of financial position.
This graph is clearly depicting that Daimler is gaining huge return on its assets however, Tesla is
getting loss from year 2014 to 2017. Daimler's return has attained huge increment from year
2014 to 2017 as 0.007 to 0.041.
Return on capital employed
5
Paraphrase This Document
Need a fresh take? Get an instant paraphrase of this document with our AI Paraphraser
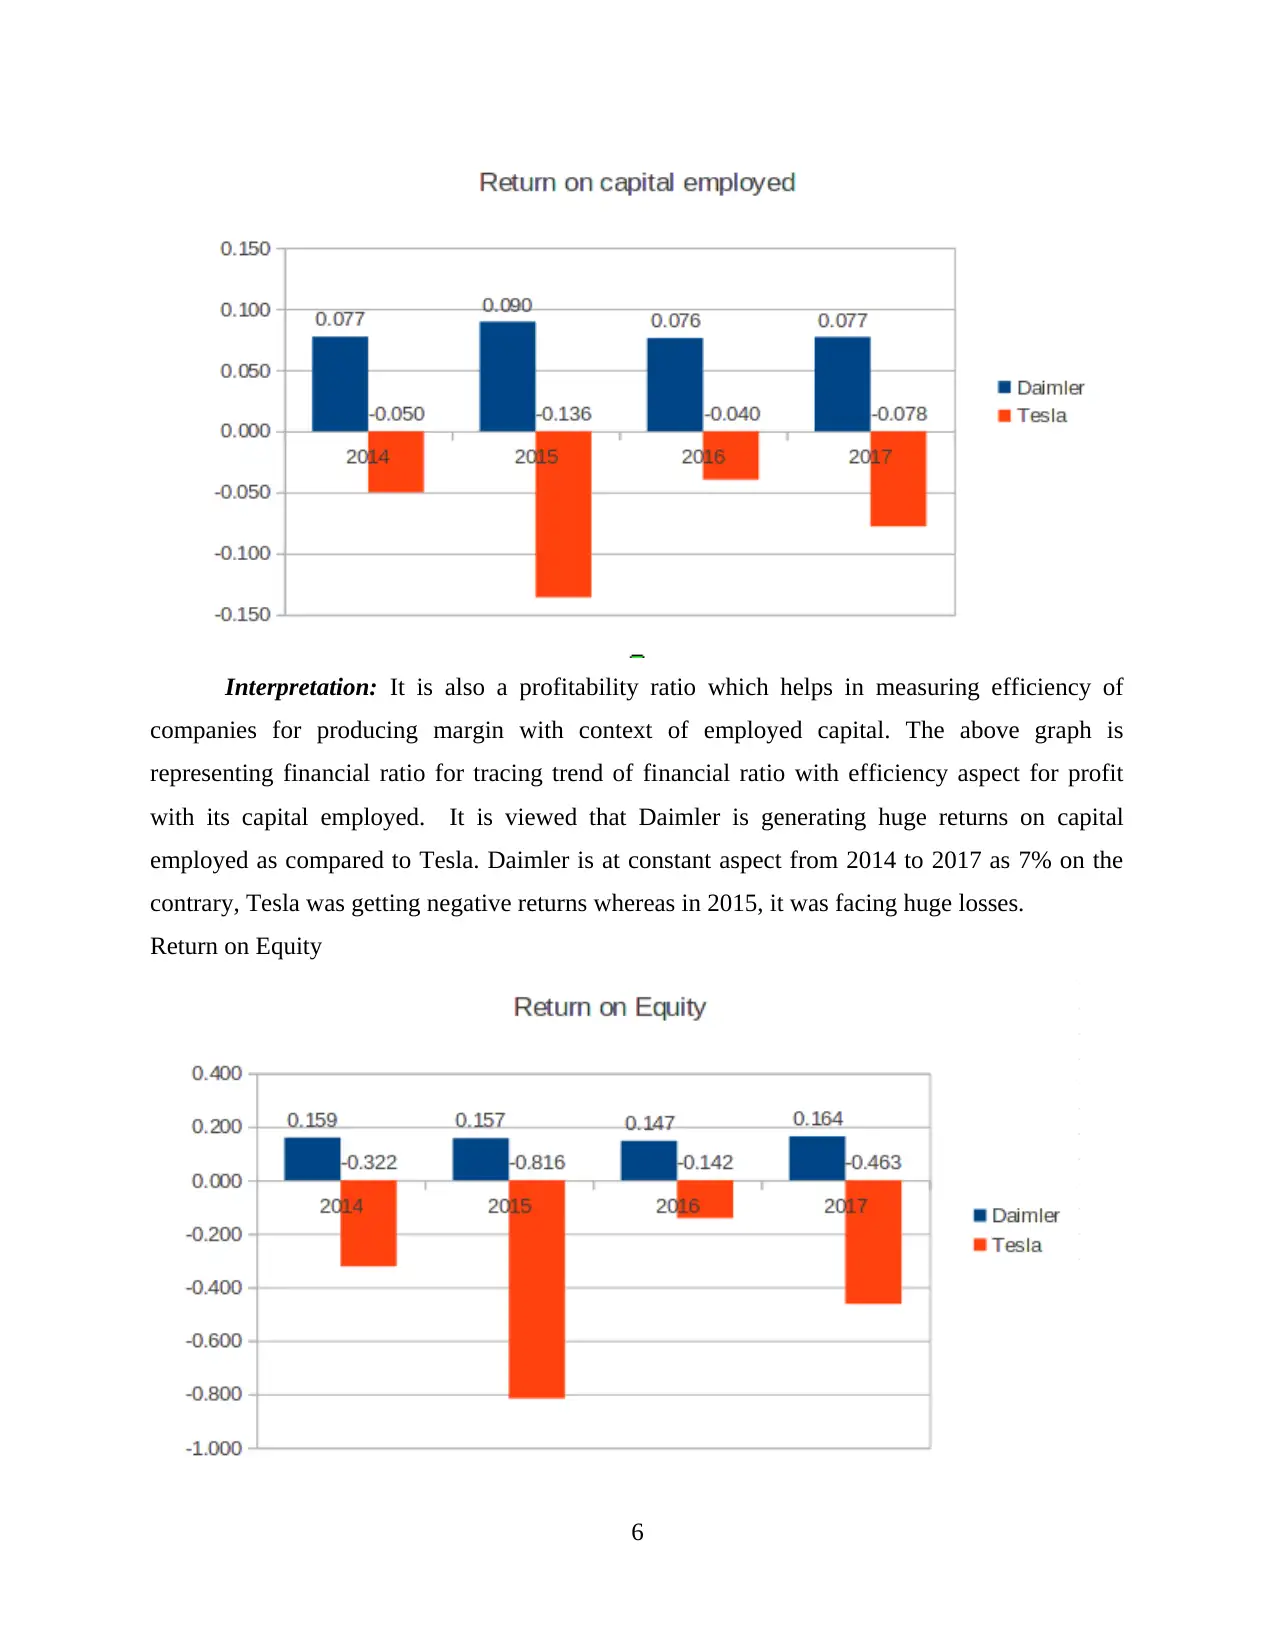
Interpretation: It is also a profitability ratio which helps in measuring efficiency of
companies for producing margin with context of employed capital. The above graph is
representing financial ratio for tracing trend of financial ratio with efficiency aspect for profit
with its capital employed. It is viewed that Daimler is generating huge returns on capital
employed as compared to Tesla. Daimler is at constant aspect from 2014 to 2017 as 7% on the
contrary, Tesla was getting negative returns whereas in 2015, it was facing huge losses.
Return on Equity
6
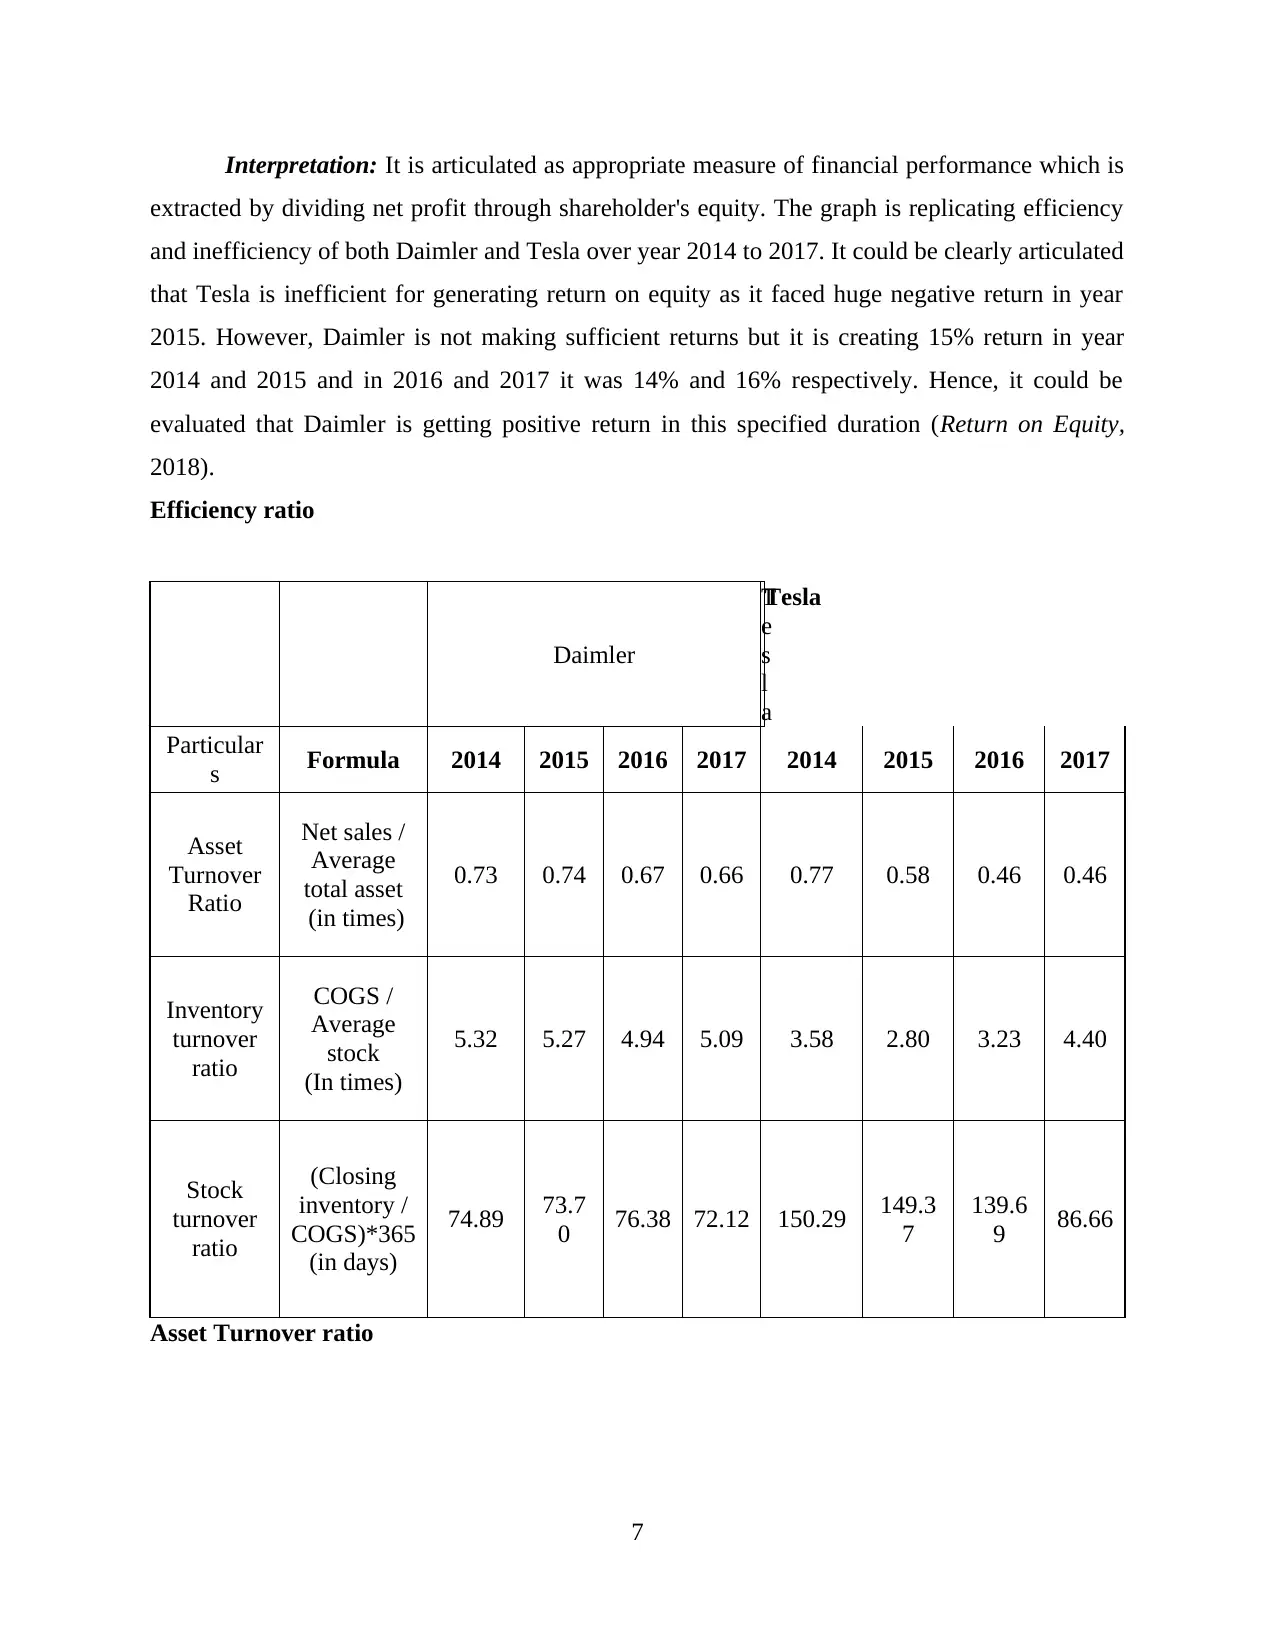
Interpretation: It is articulated as appropriate measure of financial performance which is
extracted by dividing net profit through shareholder's equity. The graph is replicating efficiency
and inefficiency of both Daimler and Tesla over year 2014 to 2017. It could be clearly articulated
that Tesla is inefficient for generating return on equity as it faced huge negative return in year
2015. However, Daimler is not making sufficient returns but it is creating 15% return in year
2014 and 2015 and in 2016 and 2017 it was 14% and 16% respectively. Hence, it could be
evaluated that Daimler is getting positive return in this specified duration (Return on Equity,
2018).
Efficiency ratio
Daimler
T
e
s
l
a
Tesla
Particular
s Formula 2014 2015 2016 2017 2014 2015 2016 2017
Asset
Turnover
Ratio
Net sales /
Average
total asset
(in times)
0.73 0.74 0.67 0.66 0.77 0.58 0.46 0.46
Inventory
turnover
ratio
COGS /
Average
stock
(In times)
5.32 5.27 4.94 5.09 3.58 2.80 3.23 4.40
Stock
turnover
ratio
(Closing
inventory /
COGS)*365
(in days)
74.89 73.7
0 76.38 72.12 150.29 149.3
7
139.6
9 86.66
Asset Turnover ratio
7
⊘ This is a preview!⊘
Do you want full access?
Subscribe today to unlock all pages.
Trusted by 1+ million students worldwide
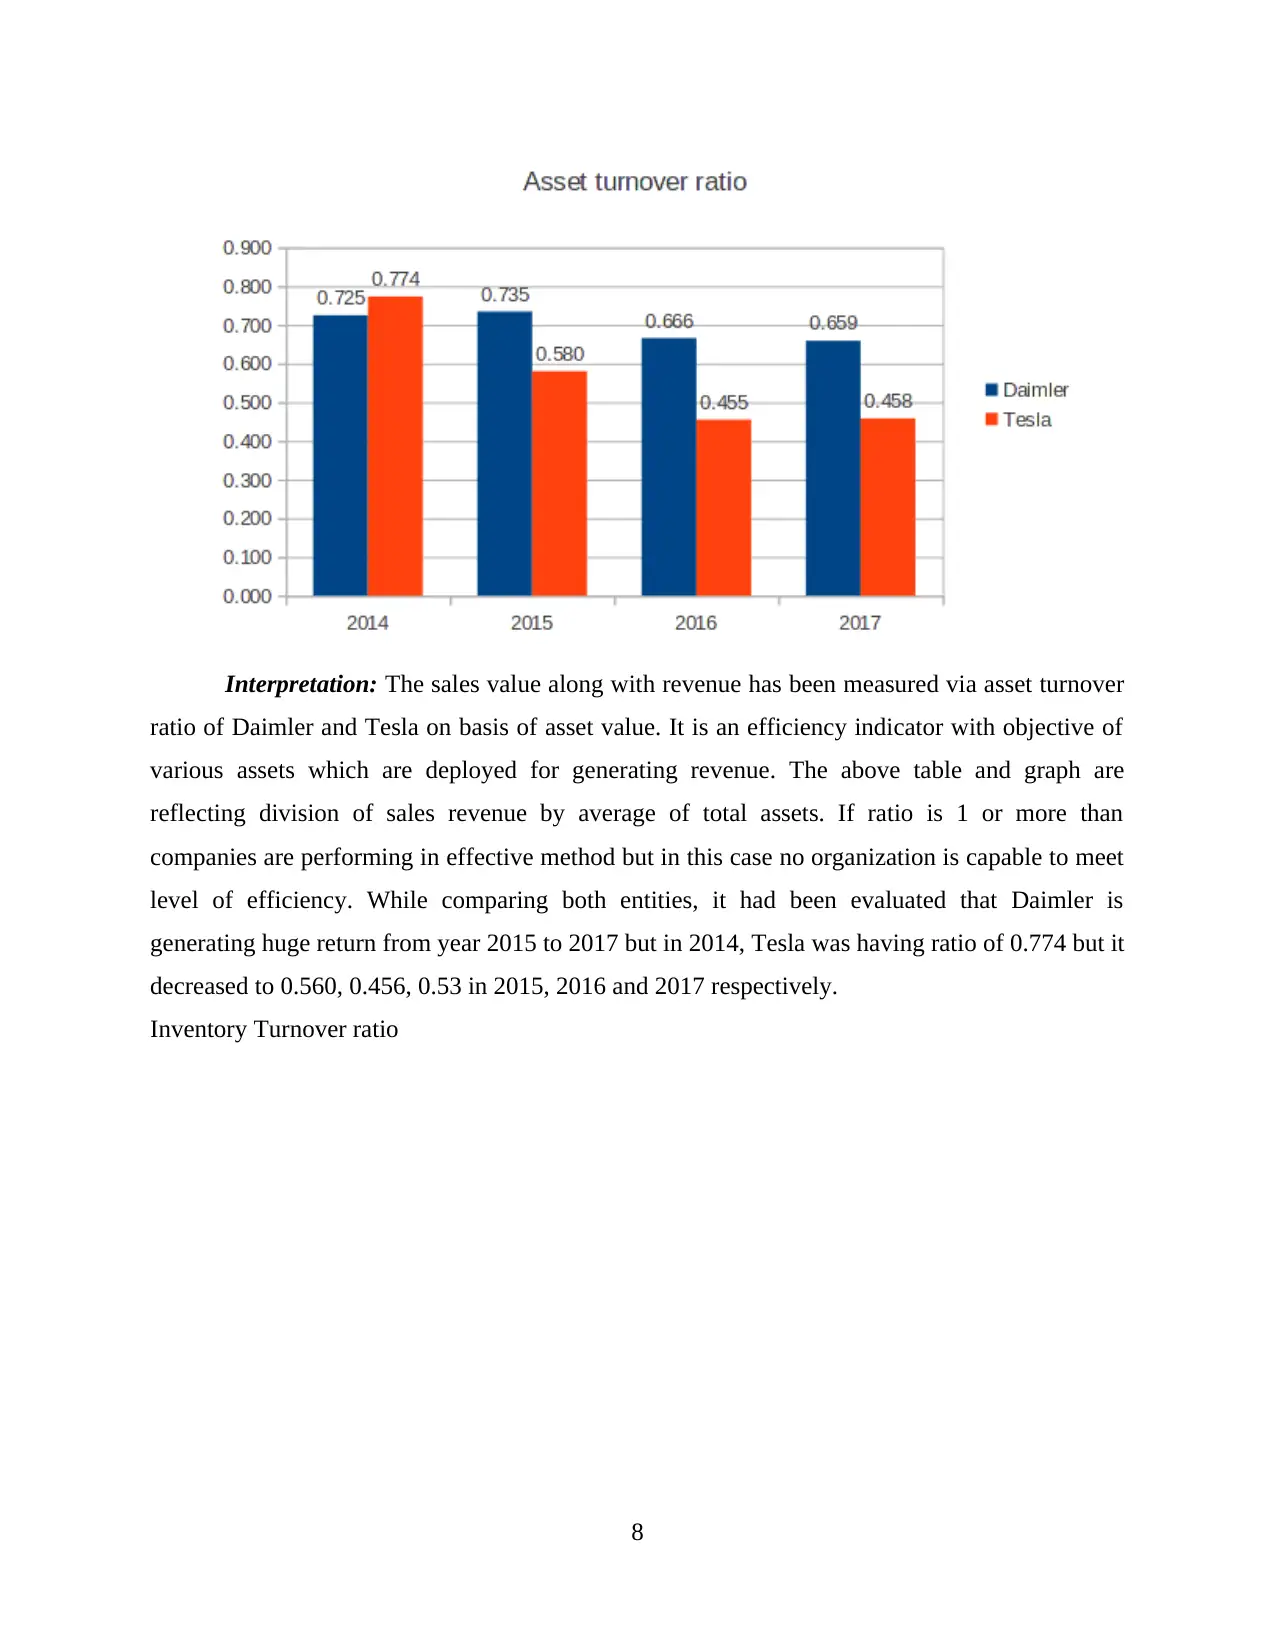
Interpretation: The sales value along with revenue has been measured via asset turnover
ratio of Daimler and Tesla on basis of asset value. It is an efficiency indicator with objective of
various assets which are deployed for generating revenue. The above table and graph are
reflecting division of sales revenue by average of total assets. If ratio is 1 or more than
companies are performing in effective method but in this case no organization is capable to meet
level of efficiency. While comparing both entities, it had been evaluated that Daimler is
generating huge return from year 2015 to 2017 but in 2014, Tesla was having ratio of 0.774 but it
decreased to 0.560, 0.456, 0.53 in 2015, 2016 and 2017 respectively.
Inventory Turnover ratio
8
Paraphrase This Document
Need a fresh take? Get an instant paraphrase of this document with our AI Paraphraser
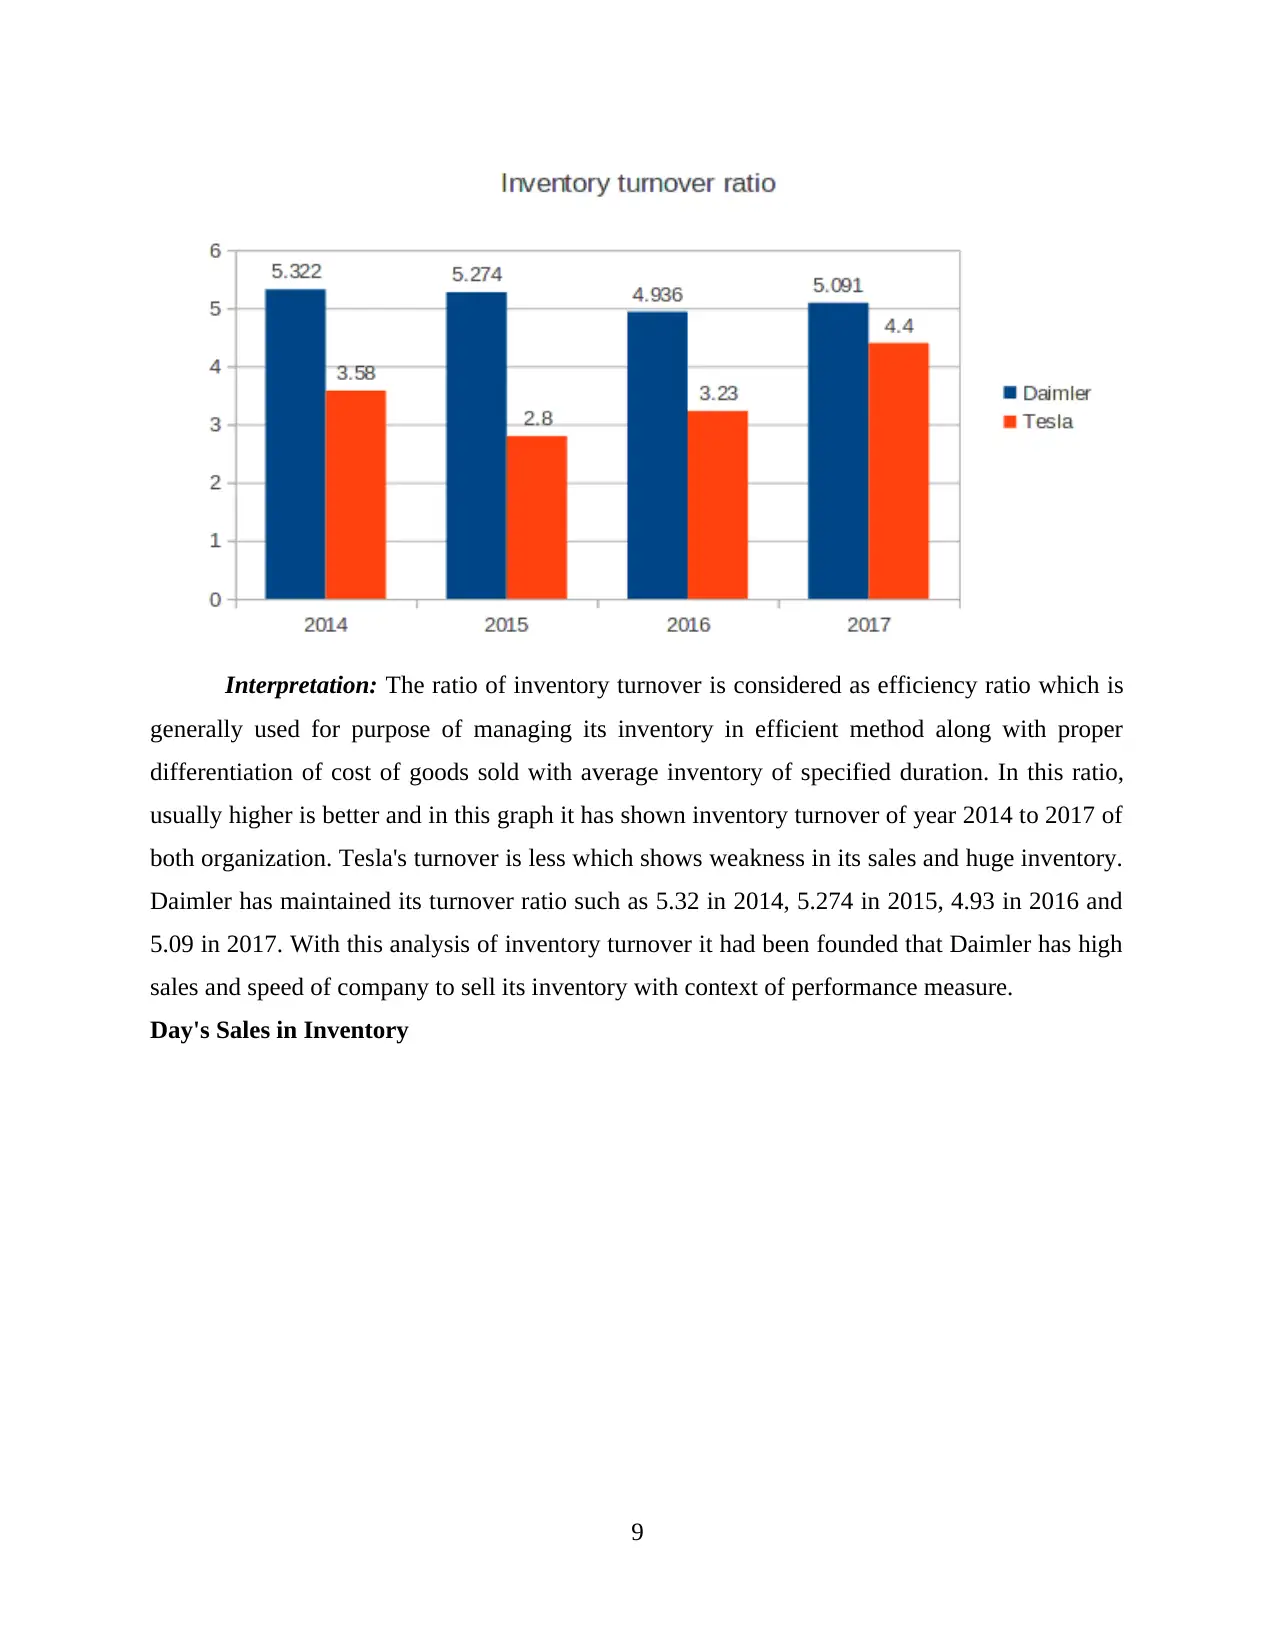
Interpretation: The ratio of inventory turnover is considered as efficiency ratio which is
generally used for purpose of managing its inventory in efficient method along with proper
differentiation of cost of goods sold with average inventory of specified duration. In this ratio,
usually higher is better and in this graph it has shown inventory turnover of year 2014 to 2017 of
both organization. Tesla's turnover is less which shows weakness in its sales and huge inventory.
Daimler has maintained its turnover ratio such as 5.32 in 2014, 5.274 in 2015, 4.93 in 2016 and
5.09 in 2017. With this analysis of inventory turnover it had been founded that Daimler has high
sales and speed of company to sell its inventory with context of performance measure.
Day's Sales in Inventory
9
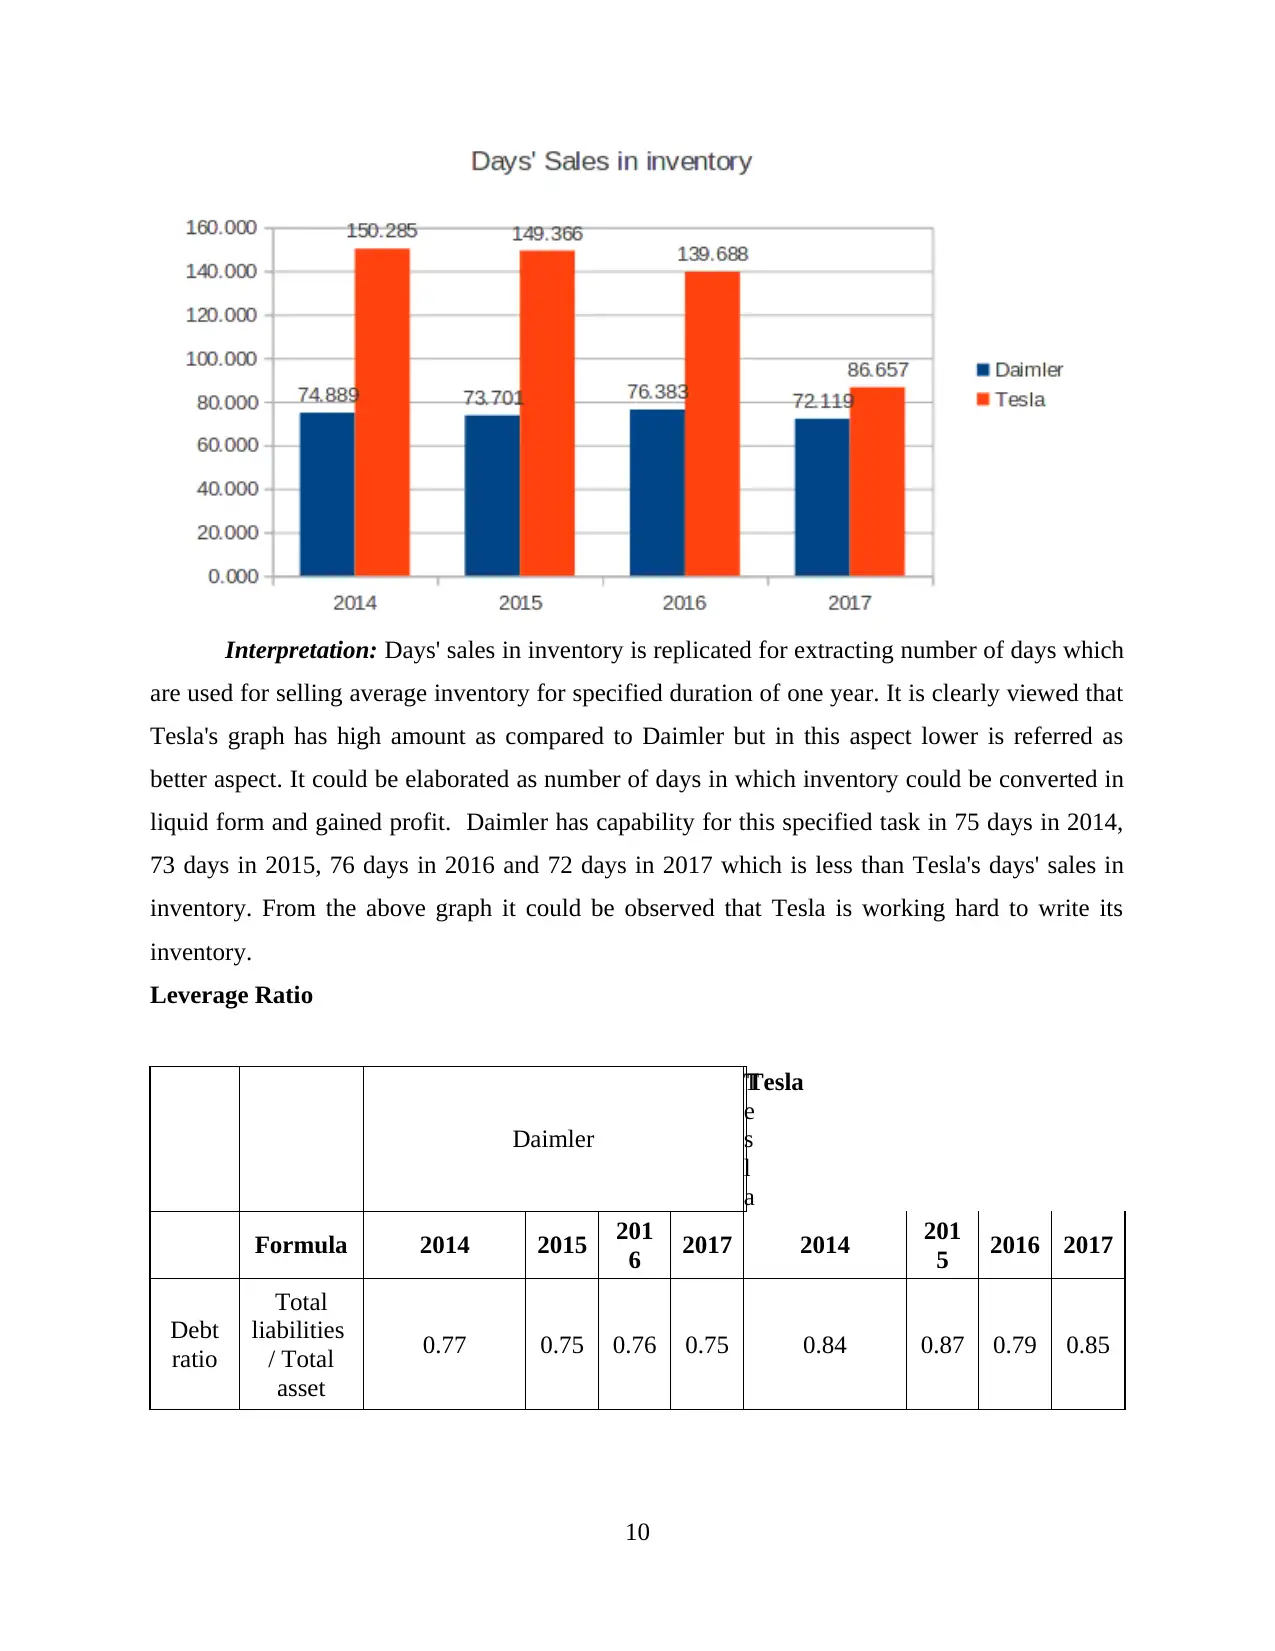
Interpretation: Days' sales in inventory is replicated for extracting number of days which
are used for selling average inventory for specified duration of one year. It is clearly viewed that
Tesla's graph has high amount as compared to Daimler but in this aspect lower is referred as
better aspect. It could be elaborated as number of days in which inventory could be converted in
liquid form and gained profit. Daimler has capability for this specified task in 75 days in 2014,
73 days in 2015, 76 days in 2016 and 72 days in 2017 which is less than Tesla's days' sales in
inventory. From the above graph it could be observed that Tesla is working hard to write its
inventory.
Leverage Ratio
Daimler
T
e
s
l
a
Tesla
Formula 2014 2015 201
6 2017 2014 201
5 2016 2017
Debt
ratio
Total
liabilities
/ Total
asset
0.77 0.75 0.76 0.75 0.84 0.87 0.79 0.85
10
⊘ This is a preview!⊘
Do you want full access?
Subscribe today to unlock all pages.
Trusted by 1+ million students worldwide
1 out of 33
Related Documents


Your All-in-One AI-Powered Toolkit for Academic Success.
+13062052269
info@desklib.com
Available 24*7 on WhatsApp / Email
![[object Object]](/_next/static/media/star-bottom.7253800d.svg)
Unlock your academic potential
Copyright © 2020–2026 A2Z Services. All Rights Reserved. Developed and managed by ZUCOL.