Strategic Financial Management Report and Analysis of Tesla Inc.
VerifiedAdded on 2020/04/13
|21
|2997
|101
Report
AI Summary
This report provides a comprehensive analysis of Tesla Inc.'s strategic financial management. It begins with an introduction addressing recent issues such as increasing competition and market challenges, followed by an overview of the company's SBU and geographical locations, and financial performance. The financial analysis section delves into profitability, efficiency, liquidity, and finance ratios, along with cash analysis, investors, and key performance indicators. The report then explores segmentation, competitor analysis, and marketing strategies, including product, price, place, promotions, and people. Further sections cover HRM and operational aspects, including the value chain and primary activities. Finally, the report summarizes the strengths and weaknesses of Tesla, providing a holistic view of the company's financial health and strategic positioning in the market.
Running head: STRATEGIC FINANCIAL MANAGEMENT REPORT
Strategic Financial Management Report of Tesla Inc
Name of the University:
Name of the Student:
Authors Note:
Strategic Financial Management Report of Tesla Inc
Name of the University:
Name of the Student:
Authors Note:
Paraphrase This Document
Need a fresh take? Get an instant paraphrase of this document with our AI Paraphraser
STRATEGIC FINANCIAL MANAGEMENT REPORT
1
Table of Contents
1. Introduction......................................................................................................................3
1.1. Recent Issue..............................................................................................................3
1.2. SBU and Geographical Locations............................................................................3
1.3. Income......................................................................................................................5
2. Financial analysis.............................................................................................................5
2.1. Profitability Ratios....................................................................................................5
2.2. Efficiency Ratios......................................................................................................6
2.3. Liquidity Ratios........................................................................................................6
2.4. Finance Ratios..........................................................................................................6
2.5. Cash Analysis...........................................................................................................7
2.6. Investors....................................................................................................................7
2.7. Key Performance Indicators.....................................................................................8
3. Segmentation analysis.....................................................................................................8
4. Competitor analysis.........................................................................................................9
5. Marketing.......................................................................................................................11
5.1. Product....................................................................................................................11
5.2. Price........................................................................................................................11
5.3. Place........................................................................................................................11
STRATEGIC FINANCIAL MANAGEMENT REPORT
2
5.4. Promotions..............................................................................................................12
5.5. People.....................................................................................................................12
6. HRM analysis................................................................................................................13
7. Operations......................................................................................................................15
7.1. Value Chain............................................................................................................15
7.2. Primary Activities...................................................................................................16
8. Strengths and weaknesses..............................................................................................17
References..........................................................................................................................19
⊘ This is a preview!⊘
Do you want full access?
Subscribe today to unlock all pages.
Trusted by 1+ million students worldwide
STRATEGIC FINANCIAL MANAGEMENT REPORT
3
1. Introduction
1.1. Recent Issue
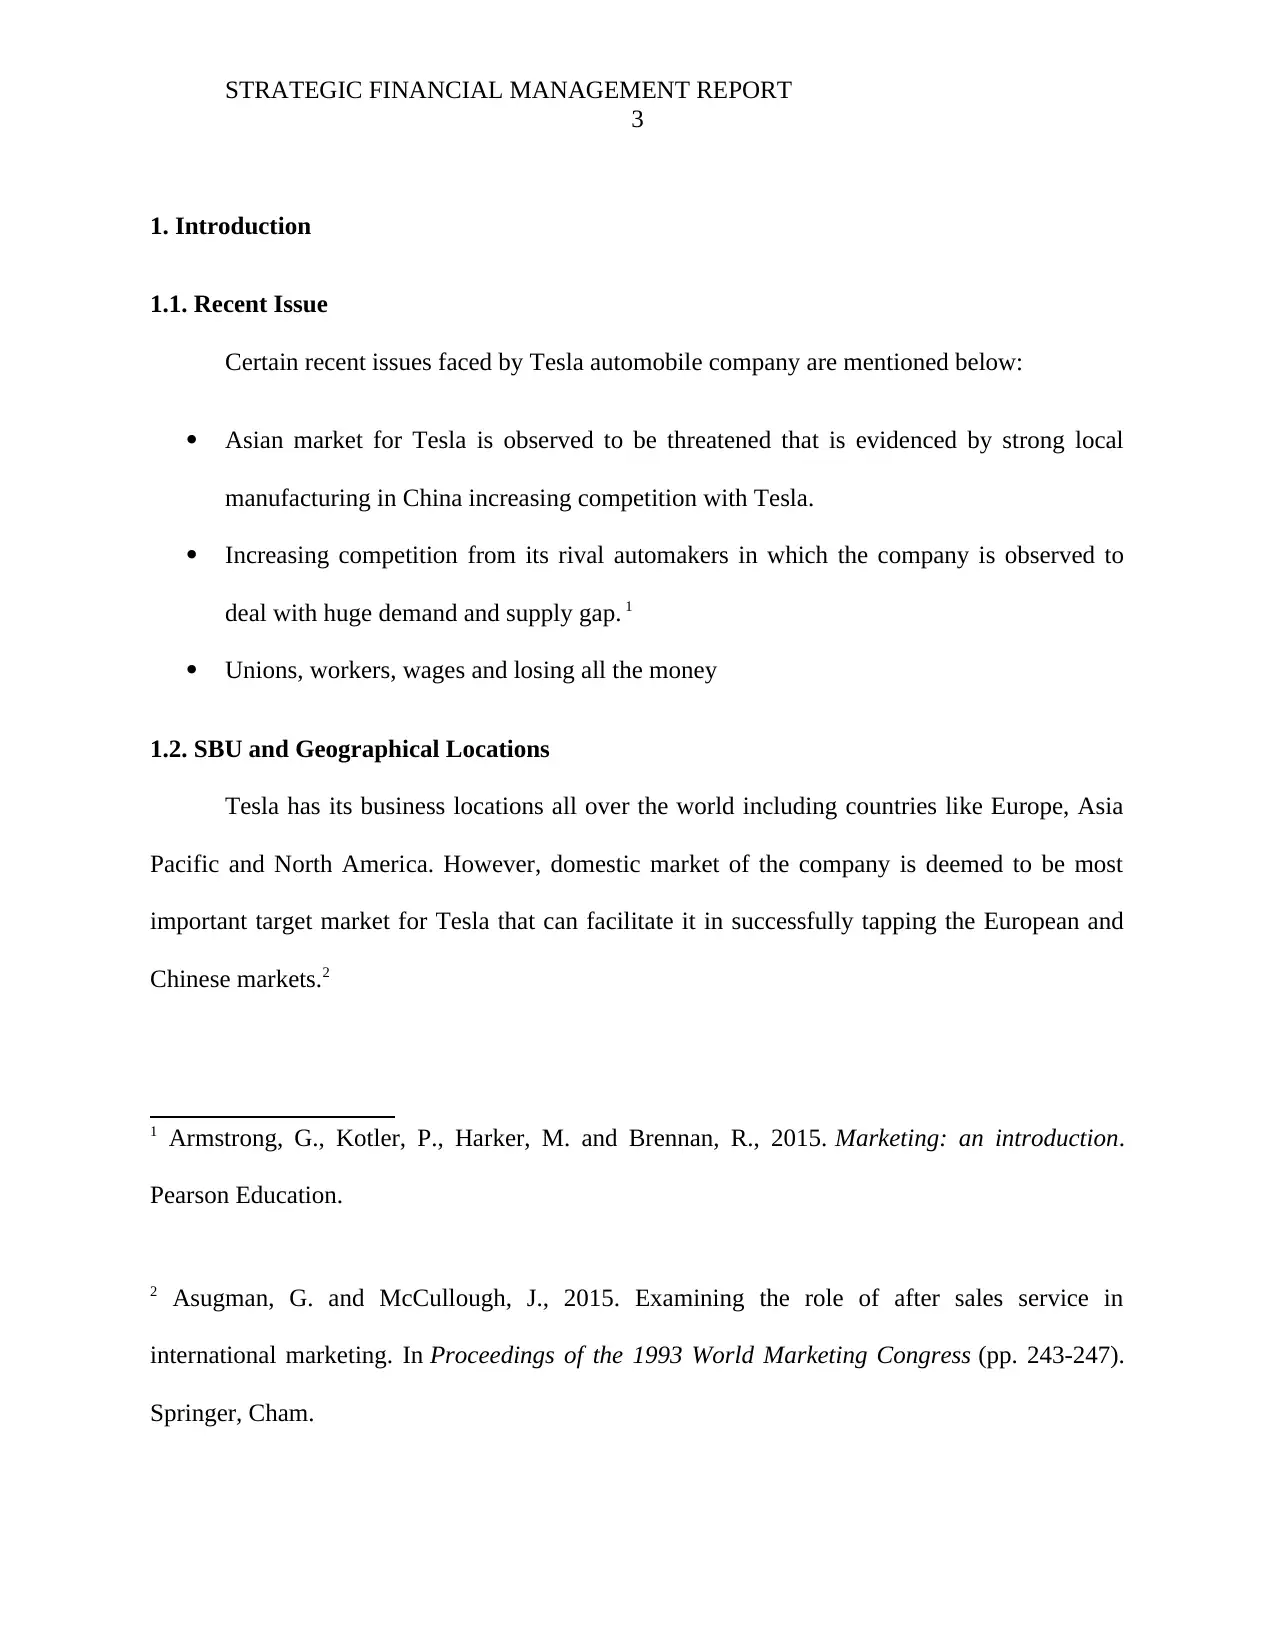
Certain recent issues faced by Tesla automobile company are mentioned below:
Asian market for Tesla is observed to be threatened that is evidenced by strong local
manufacturing in China increasing competition with Tesla.
Increasing competition from its rival automakers in which the company is observed to
deal with huge demand and supply gap. 1
Unions, workers, wages and losing all the money
1.2. SBU and Geographical Locations
Tesla has its business locations all over the world including countries like Europe, Asia
Pacific and North America. However, domestic market of the company is deemed to be most
important target market for Tesla that can facilitate it in successfully tapping the European and
Chinese markets.2
1 Armstrong, G., Kotler, P., Harker, M. and Brennan, R., 2015. Marketing: an introduction.
Pearson Education.
2 Asugman, G. and McCullough, J., 2015. Examining the role of after sales service in
international marketing. In Proceedings of the 1993 World Marketing Congress (pp. 243-247).
Springer, Cham.
3
1. Introduction
1.1. Recent Issue
Certain recent issues faced by Tesla automobile company are mentioned below:
Asian market for Tesla is observed to be threatened that is evidenced by strong local
manufacturing in China increasing competition with Tesla.
Increasing competition from its rival automakers in which the company is observed to
deal with huge demand and supply gap. 1
Unions, workers, wages and losing all the money
1.2. SBU and Geographical Locations
Tesla has its business locations all over the world including countries like Europe, Asia
Pacific and North America. However, domestic market of the company is deemed to be most
important target market for Tesla that can facilitate it in successfully tapping the European and
Chinese markets.2
1 Armstrong, G., Kotler, P., Harker, M. and Brennan, R., 2015. Marketing: an introduction.
Pearson Education.
2 Asugman, G. and McCullough, J., 2015. Examining the role of after sales service in
international marketing. In Proceedings of the 1993 World Marketing Congress (pp. 243-247).
Springer, Cham.
Paraphrase This Document
Need a fresh take? Get an instant paraphrase of this document with our AI Paraphraser

STRATEGIC FINANCIAL MANAGEMENT REPORT
4
US are responsible for half of Tesla’s sales and China has bypassed Norway to be second
largest country served by Tesla. Europe is positioned as second largest region with increased
purchase rate of Model S cars. Moreover, neither land is the second largest in Europe with 365
purchased Model S cars.
STRATEGIC FINANCIAL MANAGEMENT REPORT
5
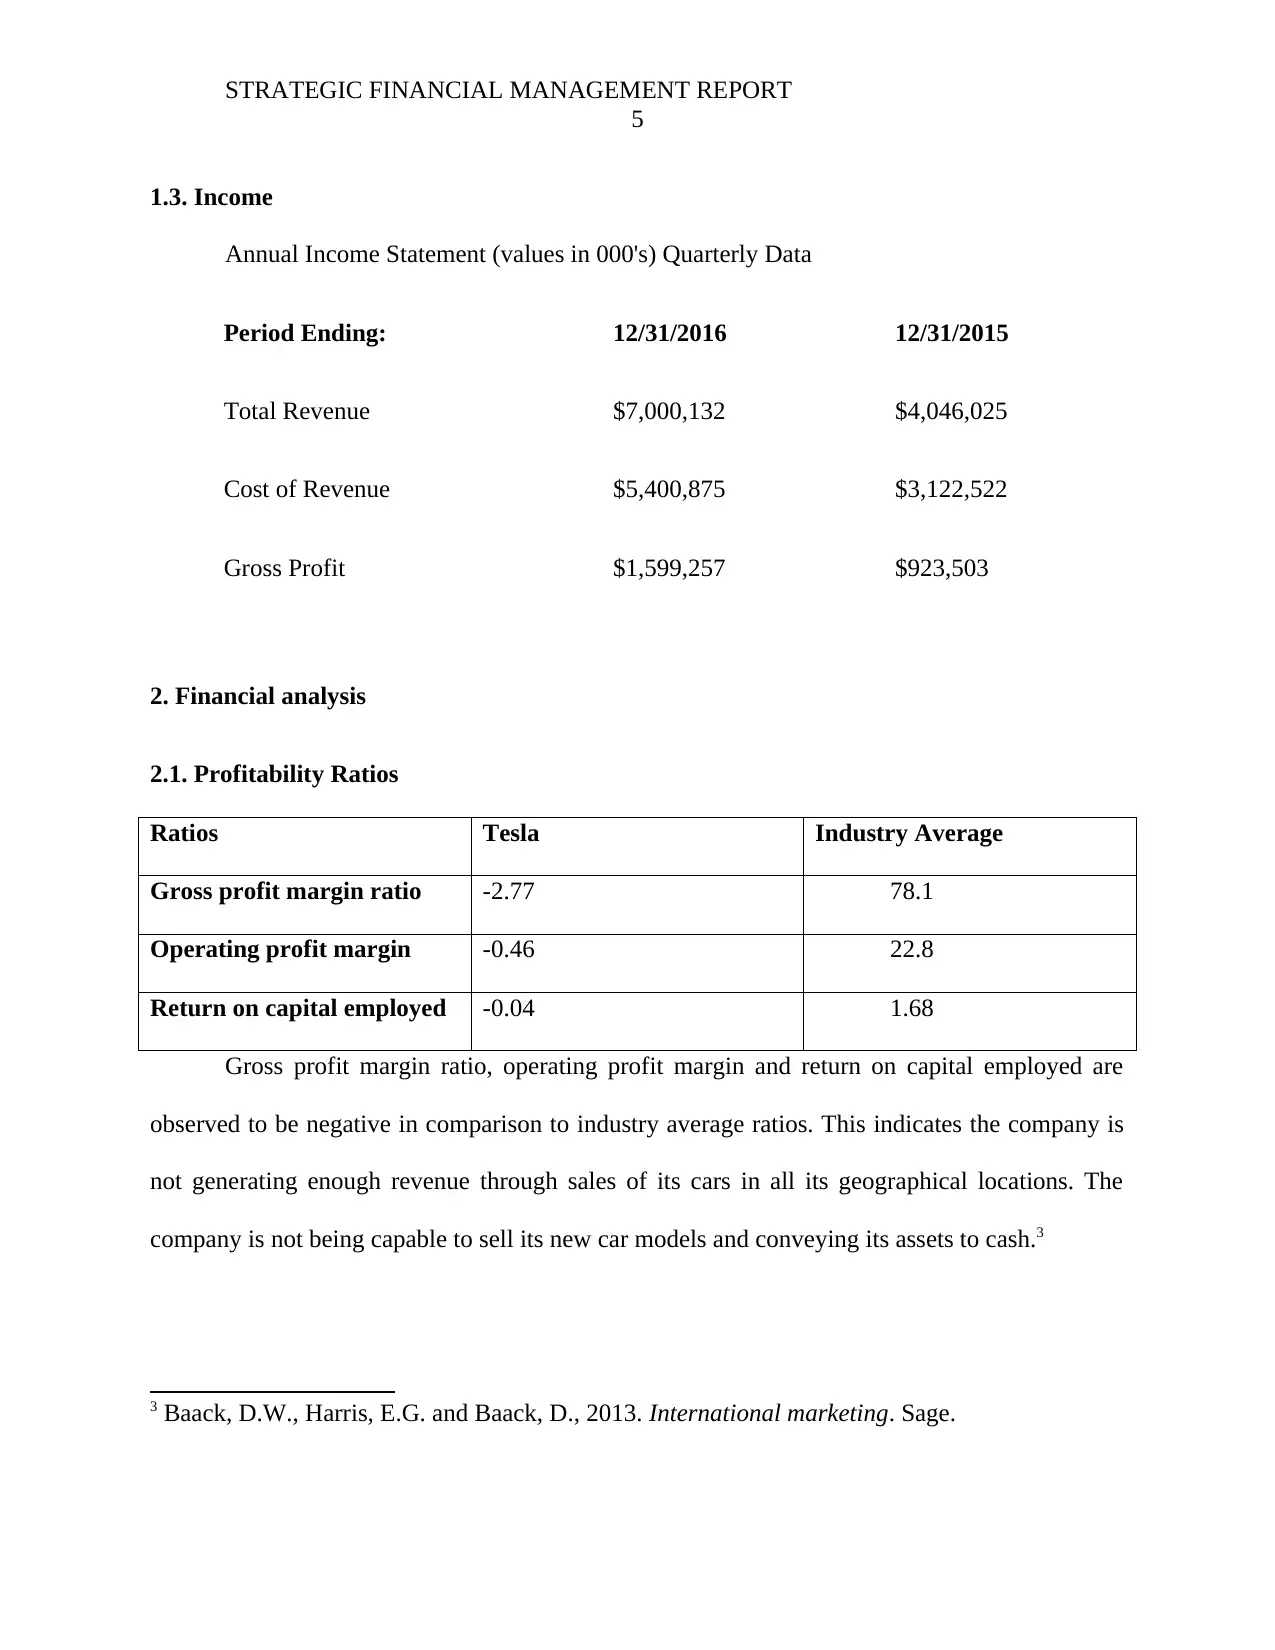
1.3. Income
Annual Income Statement (values in 000's) Quarterly Data
Period Ending: 12/31/2016 12/31/2015
Total Revenue $7,000,132 $4,046,025
Cost of Revenue $5,400,875 $3,122,522
Gross Profit $1,599,257 $923,503
2. Financial analysis
2.1. Profitability Ratios
Ratios Tesla Industry Average
Gross profit margin ratio -2.77 78.1
Operating profit margin -0.46 22.8
Return on capital employed -0.04 1.68
Gross profit margin ratio, operating profit margin and return on capital employed are
observed to be negative in comparison to industry average ratios. This indicates the company is
not generating enough revenue through sales of its cars in all its geographical locations. The
company is not being capable to sell its new car models and conveying its assets to cash.3
3 Baack, D.W., Harris, E.G. and Baack, D., 2013. International marketing. Sage.
5
1.3. Income
Annual Income Statement (values in 000's) Quarterly Data
Period Ending: 12/31/2016 12/31/2015
Total Revenue $7,000,132 $4,046,025
Cost of Revenue $5,400,875 $3,122,522
Gross Profit $1,599,257 $923,503
2. Financial analysis
2.1. Profitability Ratios
Ratios Tesla Industry Average
Gross profit margin ratio -2.77 78.1
Operating profit margin -0.46 22.8
Return on capital employed -0.04 1.68
Gross profit margin ratio, operating profit margin and return on capital employed are
observed to be negative in comparison to industry average ratios. This indicates the company is
not generating enough revenue through sales of its cars in all its geographical locations. The
company is not being capable to sell its new car models and conveying its assets to cash.3
3 Baack, D.W., Harris, E.G. and Baack, D., 2013. International marketing. Sage.
⊘ This is a preview!⊘
Do you want full access?
Subscribe today to unlock all pages.
Trusted by 1+ million students worldwide
STRATEGIC FINANCIAL MANAGEMENT REPORT
6
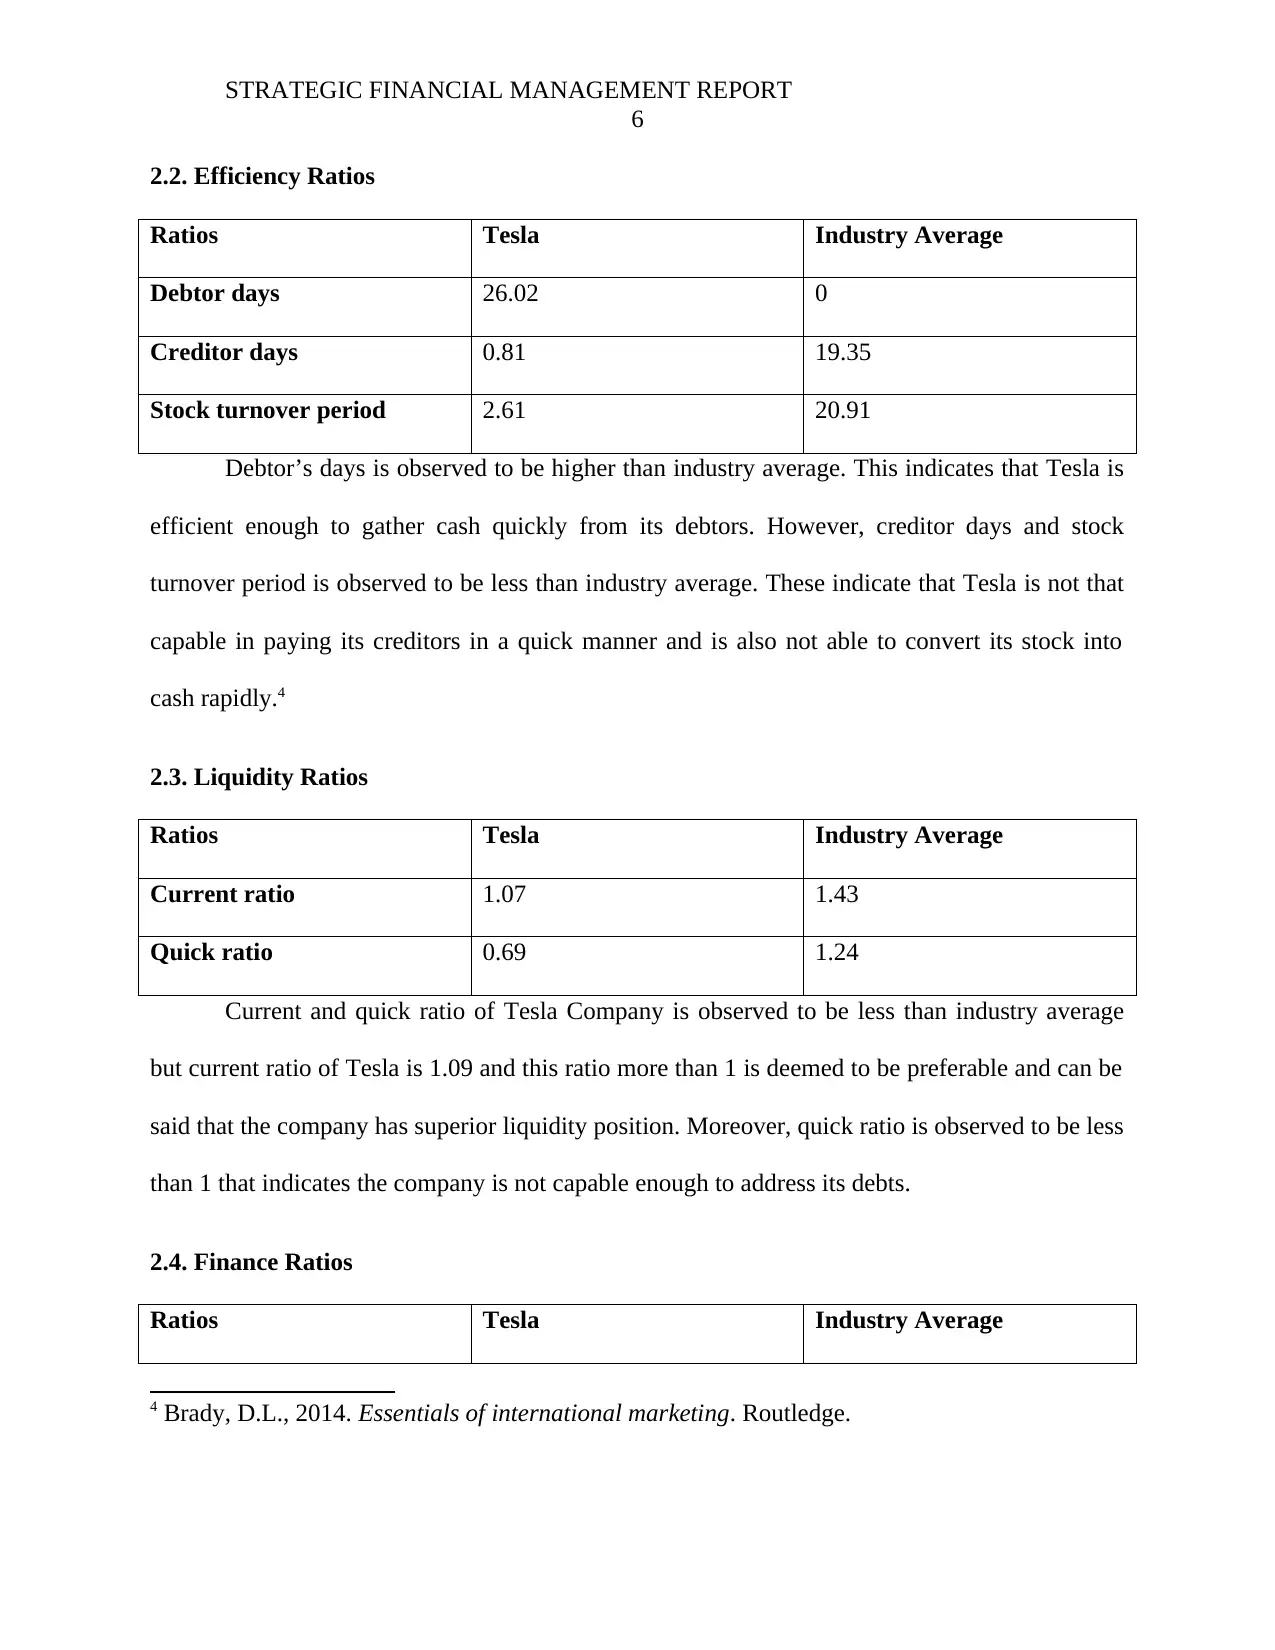
2.2. Efficiency Ratios
Ratios Tesla Industry Average
Debtor days 26.02 0
Creditor days 0.81 19.35
Stock turnover period 2.61 20.91
Debtor’s days is observed to be higher than industry average. This indicates that Tesla is
efficient enough to gather cash quickly from its debtors. However, creditor days and stock
turnover period is observed to be less than industry average. These indicate that Tesla is not that
capable in paying its creditors in a quick manner and is also not able to convert its stock into
cash rapidly.4
2.3. Liquidity Ratios
Ratios Tesla Industry Average
Current ratio 1.07 1.43
Quick ratio 0.69 1.24
Current and quick ratio of Tesla Company is observed to be less than industry average
but current ratio of Tesla is 1.09 and this ratio more than 1 is deemed to be preferable and can be
said that the company has superior liquidity position. Moreover, quick ratio is observed to be less
than 1 that indicates the company is not capable enough to address its debts.
2.4. Finance Ratios
Ratios Tesla Industry Average
4 Brady, D.L., 2014. Essentials of international marketing. Routledge.
6
2.2. Efficiency Ratios
Ratios Tesla Industry Average
Debtor days 26.02 0
Creditor days 0.81 19.35
Stock turnover period 2.61 20.91
Debtor’s days is observed to be higher than industry average. This indicates that Tesla is
efficient enough to gather cash quickly from its debtors. However, creditor days and stock
turnover period is observed to be less than industry average. These indicate that Tesla is not that
capable in paying its creditors in a quick manner and is also not able to convert its stock into
cash rapidly.4
2.3. Liquidity Ratios
Ratios Tesla Industry Average
Current ratio 1.07 1.43
Quick ratio 0.69 1.24
Current and quick ratio of Tesla Company is observed to be less than industry average
but current ratio of Tesla is 1.09 and this ratio more than 1 is deemed to be preferable and can be
said that the company has superior liquidity position. Moreover, quick ratio is observed to be less
than 1 that indicates the company is not capable enough to address its debts.
2.4. Finance Ratios
Ratios Tesla Industry Average
4 Brady, D.L., 2014. Essentials of international marketing. Routledge.
Paraphrase This Document
Need a fresh take? Get an instant paraphrase of this document with our AI Paraphraser
STRATEGIC FINANCIAL MANAGEMENT REPORT
7
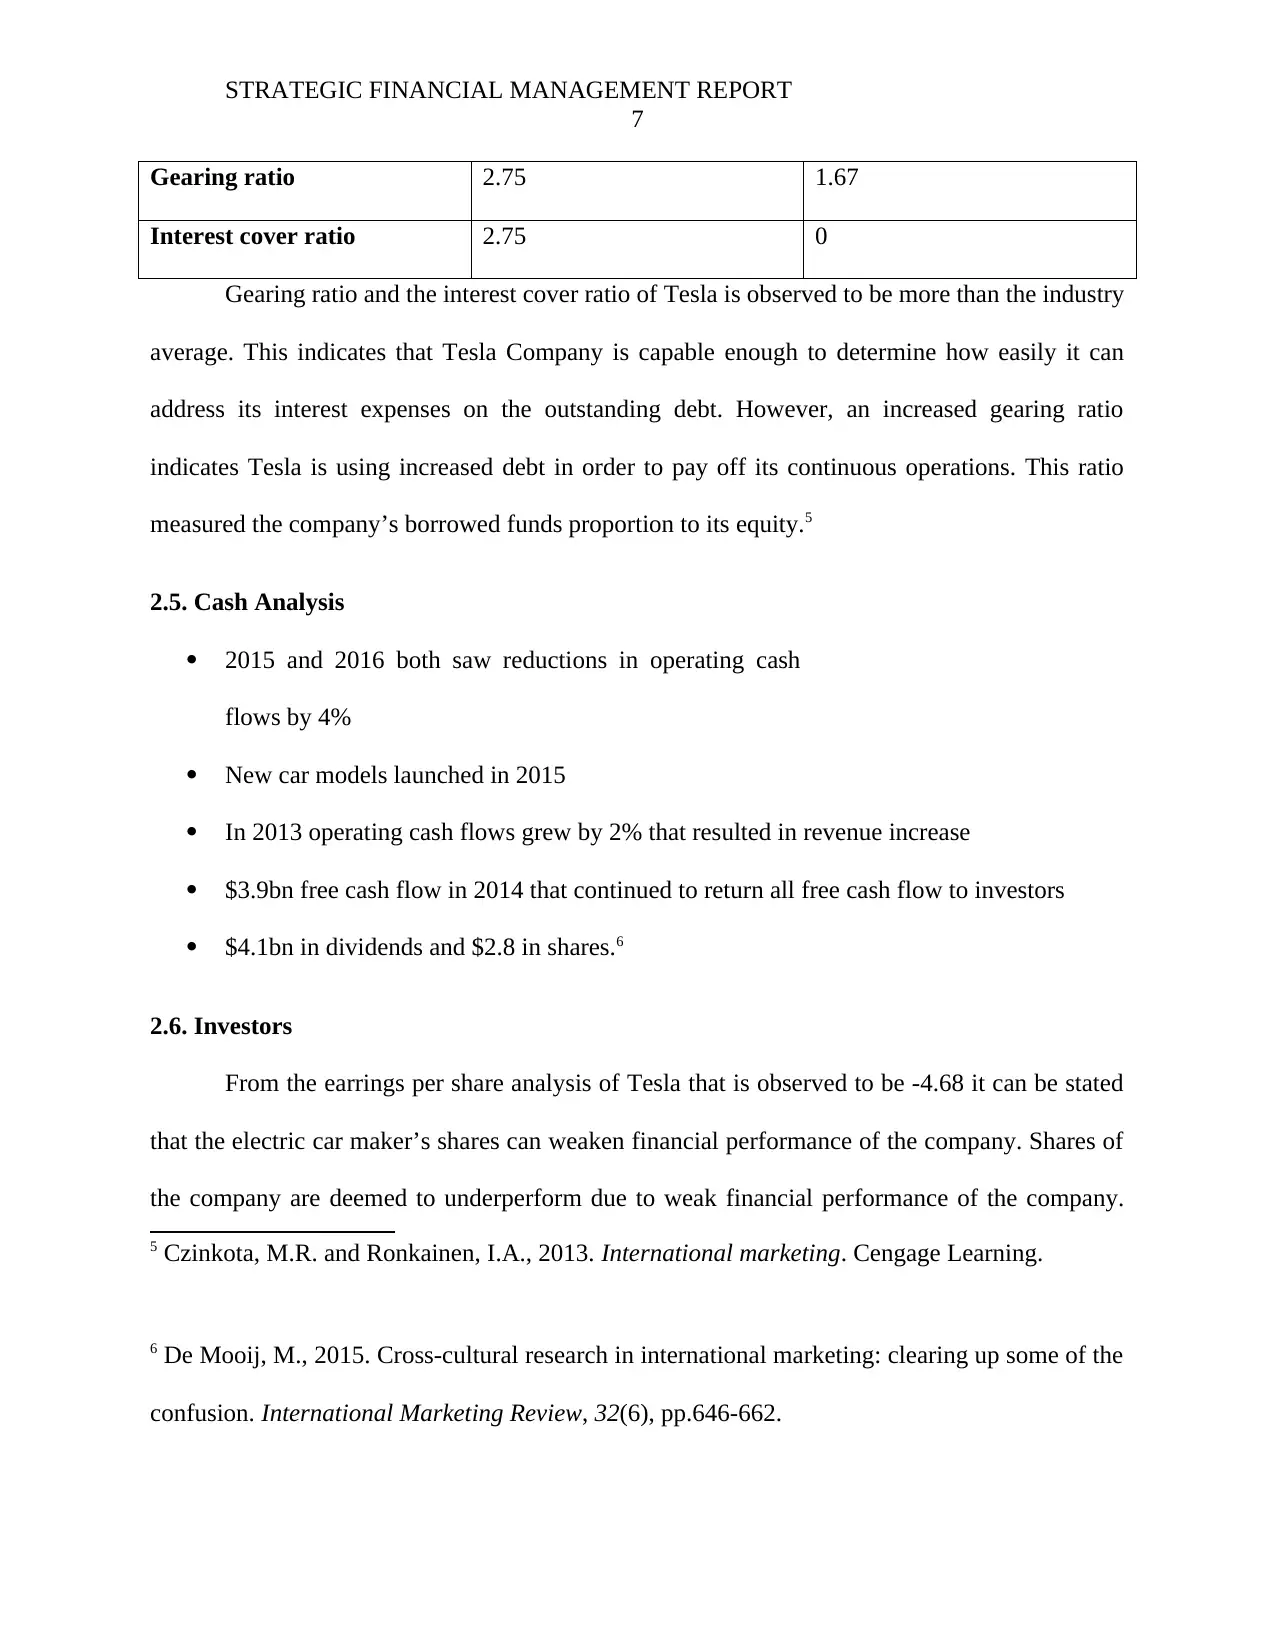
Gearing ratio 2.75 1.67
Interest cover ratio 2.75 0
Gearing ratio and the interest cover ratio of Tesla is observed to be more than the industry
average. This indicates that Tesla Company is capable enough to determine how easily it can
address its interest expenses on the outstanding debt. However, an increased gearing ratio
indicates Tesla is using increased debt in order to pay off its continuous operations. This ratio
measured the company’s borrowed funds proportion to its equity.5
2.5. Cash Analysis
2015 and 2016 both saw reductions in operating cash
flows by 4%
New car models launched in 2015
In 2013 operating cash flows grew by 2% that resulted in revenue increase
$3.9bn free cash flow in 2014 that continued to return all free cash flow to investors
$4.1bn in dividends and $2.8 in shares.6
2.6. Investors
From the earrings per share analysis of Tesla that is observed to be -4.68 it can be stated
that the electric car maker’s shares can weaken financial performance of the company. Shares of
the company are deemed to underperform due to weak financial performance of the company.
5 Czinkota, M.R. and Ronkainen, I.A., 2013. International marketing. Cengage Learning.
6 De Mooij, M., 2015. Cross-cultural research in international marketing: clearing up some of the
confusion. International Marketing Review, 32(6), pp.646-662.
7
Gearing ratio 2.75 1.67
Interest cover ratio 2.75 0
Gearing ratio and the interest cover ratio of Tesla is observed to be more than the industry
average. This indicates that Tesla Company is capable enough to determine how easily it can
address its interest expenses on the outstanding debt. However, an increased gearing ratio
indicates Tesla is using increased debt in order to pay off its continuous operations. This ratio
measured the company’s borrowed funds proportion to its equity.5
2.5. Cash Analysis
2015 and 2016 both saw reductions in operating cash
flows by 4%
New car models launched in 2015
In 2013 operating cash flows grew by 2% that resulted in revenue increase
$3.9bn free cash flow in 2014 that continued to return all free cash flow to investors
$4.1bn in dividends and $2.8 in shares.6
2.6. Investors
From the earrings per share analysis of Tesla that is observed to be -4.68 it can be stated
that the electric car maker’s shares can weaken financial performance of the company. Shares of
the company are deemed to underperform due to weak financial performance of the company.
5 Czinkota, M.R. and Ronkainen, I.A., 2013. International marketing. Cengage Learning.
6 De Mooij, M., 2015. Cross-cultural research in international marketing: clearing up some of the
confusion. International Marketing Review, 32(6), pp.646-662.
STRATEGIC FINANCIAL MANAGEMENT REPORT
8
Such underperformance indicates that Tesla motors will continue to pay enough dividends than
the company’s growth.
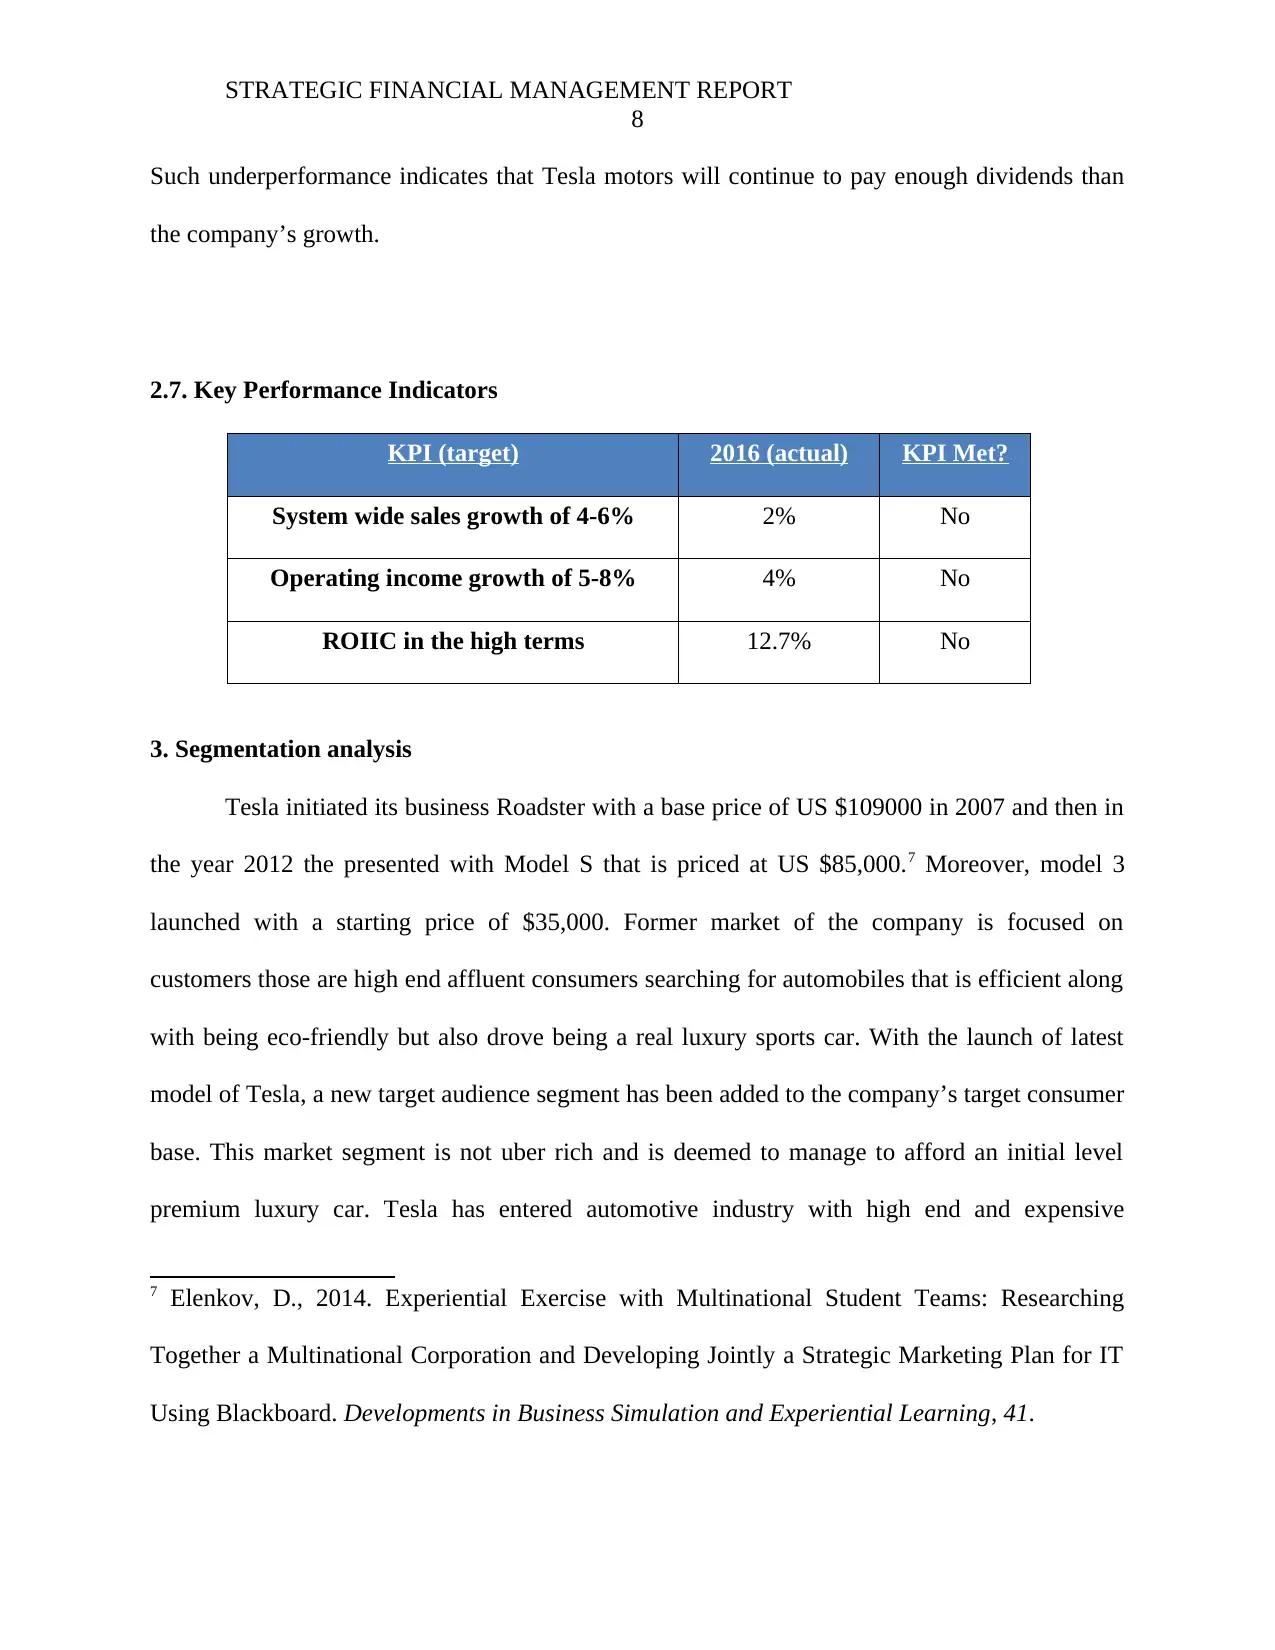
2.7. Key Performance Indicators
KPI (target) 2016 (actual) KPI Met?
System wide sales growth of 4-6% 2% No
Operating income growth of 5-8% 4% No
ROIIC in the high terms 12.7% No
3. Segmentation analysis
Tesla initiated its business Roadster with a base price of US $109000 in 2007 and then in
the year 2012 the presented with Model S that is priced at US $85,000.7 Moreover, model 3
launched with a starting price of $35,000. Former market of the company is focused on
customers those are high end affluent consumers searching for automobiles that is efficient along
with being eco-friendly but also drove being a real luxury sports car. With the launch of latest
model of Tesla, a new target audience segment has been added to the company’s target consumer
base. This market segment is not uber rich and is deemed to manage to afford an initial level
premium luxury car. Tesla has entered automotive industry with high end and expensive
7 Elenkov, D., 2014. Experiential Exercise with Multinational Student Teams: Researching
Together a Multinational Corporation and Developing Jointly a Strategic Marketing Plan for IT
Using Blackboard. Developments in Business Simulation and Experiential Learning, 41.
8
Such underperformance indicates that Tesla motors will continue to pay enough dividends than
the company’s growth.
2.7. Key Performance Indicators
KPI (target) 2016 (actual) KPI Met?
System wide sales growth of 4-6% 2% No
Operating income growth of 5-8% 4% No
ROIIC in the high terms 12.7% No
3. Segmentation analysis
Tesla initiated its business Roadster with a base price of US $109000 in 2007 and then in
the year 2012 the presented with Model S that is priced at US $85,000.7 Moreover, model 3
launched with a starting price of $35,000. Former market of the company is focused on
customers those are high end affluent consumers searching for automobiles that is efficient along
with being eco-friendly but also drove being a real luxury sports car. With the launch of latest
model of Tesla, a new target audience segment has been added to the company’s target consumer
base. This market segment is not uber rich and is deemed to manage to afford an initial level
premium luxury car. Tesla has entered automotive industry with high end and expensive
7 Elenkov, D., 2014. Experiential Exercise with Multinational Student Teams: Researching
Together a Multinational Corporation and Developing Jointly a Strategic Marketing Plan for IT
Using Blackboard. Developments in Business Simulation and Experiential Learning, 41.
⊘ This is a preview!⊘
Do you want full access?
Subscribe today to unlock all pages.
Trusted by 1+ million students worldwide
STRATEGIC FINANCIAL MANAGEMENT REPORT
9
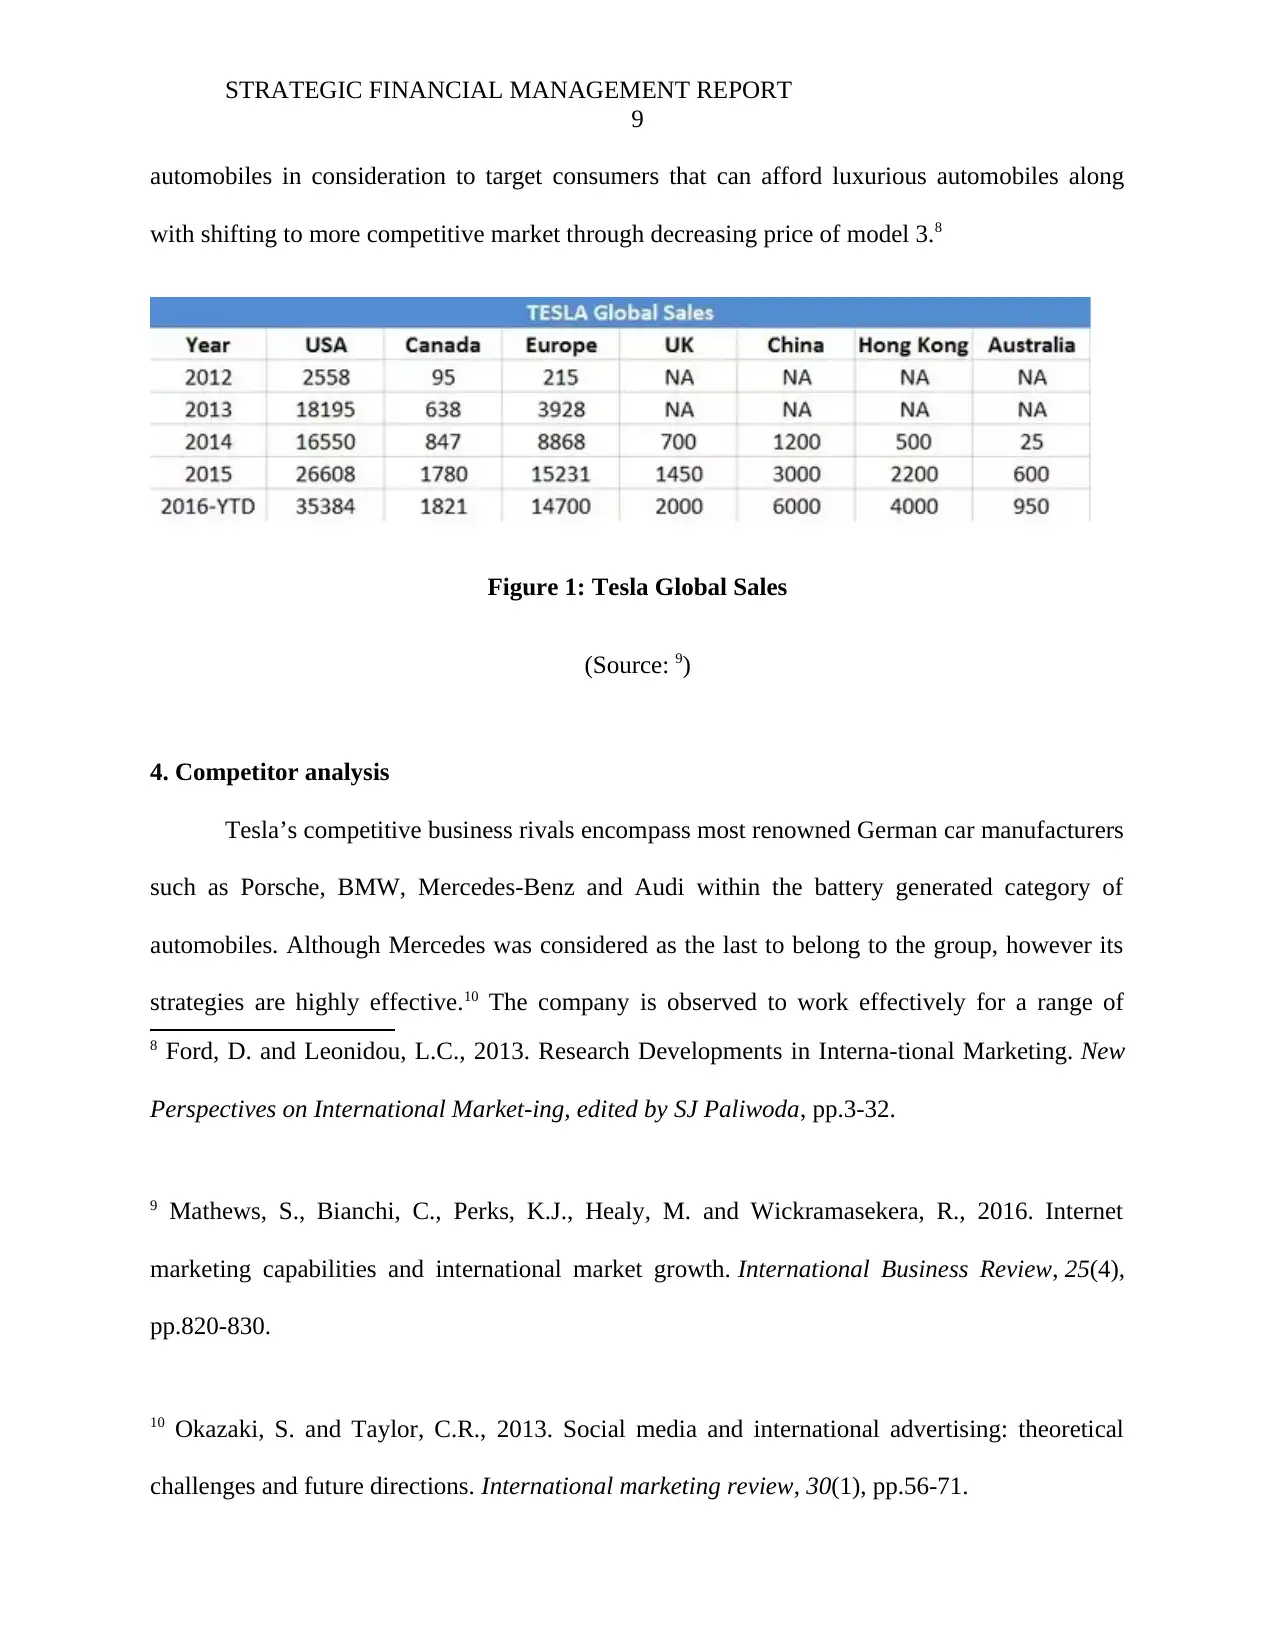
automobiles in consideration to target consumers that can afford luxurious automobiles along
with shifting to more competitive market through decreasing price of model 3.8
Figure 1: Tesla Global Sales
(Source: 9)
4. Competitor analysis
Tesla’s competitive business rivals encompass most renowned German car manufacturers
such as Porsche, BMW, Mercedes-Benz and Audi within the battery generated category of
automobiles. Although Mercedes was considered as the last to belong to the group, however its
strategies are highly effective.10 The company is observed to work effectively for a range of
8 Ford, D. and Leonidou, L.C., 2013. Research Developments in Interna-tional Marketing. New
Perspectives on International Market-ing, edited by SJ Paliwoda, pp.3-32.
9 Mathews, S., Bianchi, C., Perks, K.J., Healy, M. and Wickramasekera, R., 2016. Internet
marketing capabilities and international market growth. International Business Review, 25(4),
pp.820-830.
10 Okazaki, S. and Taylor, C.R., 2013. Social media and international advertising: theoretical
challenges and future directions. International marketing review, 30(1), pp.56-71.
9
automobiles in consideration to target consumers that can afford luxurious automobiles along
with shifting to more competitive market through decreasing price of model 3.8
Figure 1: Tesla Global Sales
(Source: 9)
4. Competitor analysis
Tesla’s competitive business rivals encompass most renowned German car manufacturers
such as Porsche, BMW, Mercedes-Benz and Audi within the battery generated category of
automobiles. Although Mercedes was considered as the last to belong to the group, however its
strategies are highly effective.10 The company is observed to work effectively for a range of
8 Ford, D. and Leonidou, L.C., 2013. Research Developments in Interna-tional Marketing. New
Perspectives on International Market-ing, edited by SJ Paliwoda, pp.3-32.
9 Mathews, S., Bianchi, C., Perks, K.J., Healy, M. and Wickramasekera, R., 2016. Internet
marketing capabilities and international market growth. International Business Review, 25(4),
pp.820-830.
10 Okazaki, S. and Taylor, C.R., 2013. Social media and international advertising: theoretical
challenges and future directions. International marketing review, 30(1), pp.56-71.
Paraphrase This Document
Need a fresh take? Get an instant paraphrase of this document with our AI Paraphraser
STRATEGIC FINANCIAL MANAGEMENT REPORT
10
innovative electrical car models.11 Based on the marketing reports, Mercedes is deemed to spend
more than three billion dollars in order to design and develop its innovative car models. BMW
and Audi also provides a tough competition through investing increased capital in development
of electrical car models that are considered as direct competitors of Tesla automobile. Porchse is
also providing high competition in designing superior quality automobile models that has
technology of high voltage battery storing along with certain electric motors that are quite
innovative and are focused on providing Tesla Company with strong competition.12 The
automobile company has explained its plans for developing a model version of its mission E
impression. However, such competition level is not deemed to be a bigger concern for the
company. The owner of the Company Elon Musk holds the opinion that a concept of battery
operated car’s responsibility is focused on inspecting the previously established manufacturers.
Major goal of Tesla is to promote advancement of a sustainable transport system.
5. Marketing
5.1. Product
Product mix strategy of Tesla Inc considers identifying products sold by the company to
its target consumers. The company offers profitable products that offer value that is paid by
11 Gnizy, I. and Shoham, A., 2014. Uncovering the influence of the international marketing
function in international firms. International Marketing Review, 31(1), pp.51-78.
12 Morschett, D., Schramm-Klein, H. and Zentes, J., 2015. Strategic international management.
Springer.
STRATEGIC FINANCIAL MANAGEMENT REPORT
11
consumers. Tesla’ automotive business offers products such as automobiles, batteries and
electric vehicle power train aspects.13
5.2. Price
Price levels along with associated strategies are explained within marketing mix. Tesla
Motors Inc employs premium pricing strategy that considers employing high price aspects relied
on basis of uniqueness along with high value based on the company’s offerings. Consumers are
observed to pay considerably increased prices for Tesla automobiles that are considered
advanced in consideration to ecology and technology.
5.3. Place
The locations that are used by Tesla in reaching consumers are considered as a marketing
mix element. The company provides or sells its products through these locations that include
official company websites, company-owned galleries and stores along with company-owned
service centres. Additionally, Tesla offers its cars through their own stores or online medium and
there are several stores that display the company’s luxurious cars.14
13 Papadopoulos, N. and Heslop, L.A., 2014. Product-country images: Impact and role in
international marketing. Routledge.
14 Papadopoulos, N. and Heslop, L.A., 2014. Product-country images: Impact and role in
international marketing. Routledge.
⊘ This is a preview!⊘
Do you want full access?
Subscribe today to unlock all pages.
Trusted by 1+ million students worldwide
1 out of 21
Related Documents


Your All-in-One AI-Powered Toolkit for Academic Success.
+13062052269
info@desklib.com
Available 24*7 on WhatsApp / Email
![[object Object]](/_next/static/media/star-bottom.7253800d.svg)
Unlock your academic potential
Copyright © 2020–2026 A2Z Services. All Rights Reserved. Developed and managed by ZUCOL.