Tesla Inc. Financial Statement Analysis Report - Investments (72-372)
VerifiedAdded on 2023/06/15
|15
|2181
|475
Report
AI Summary
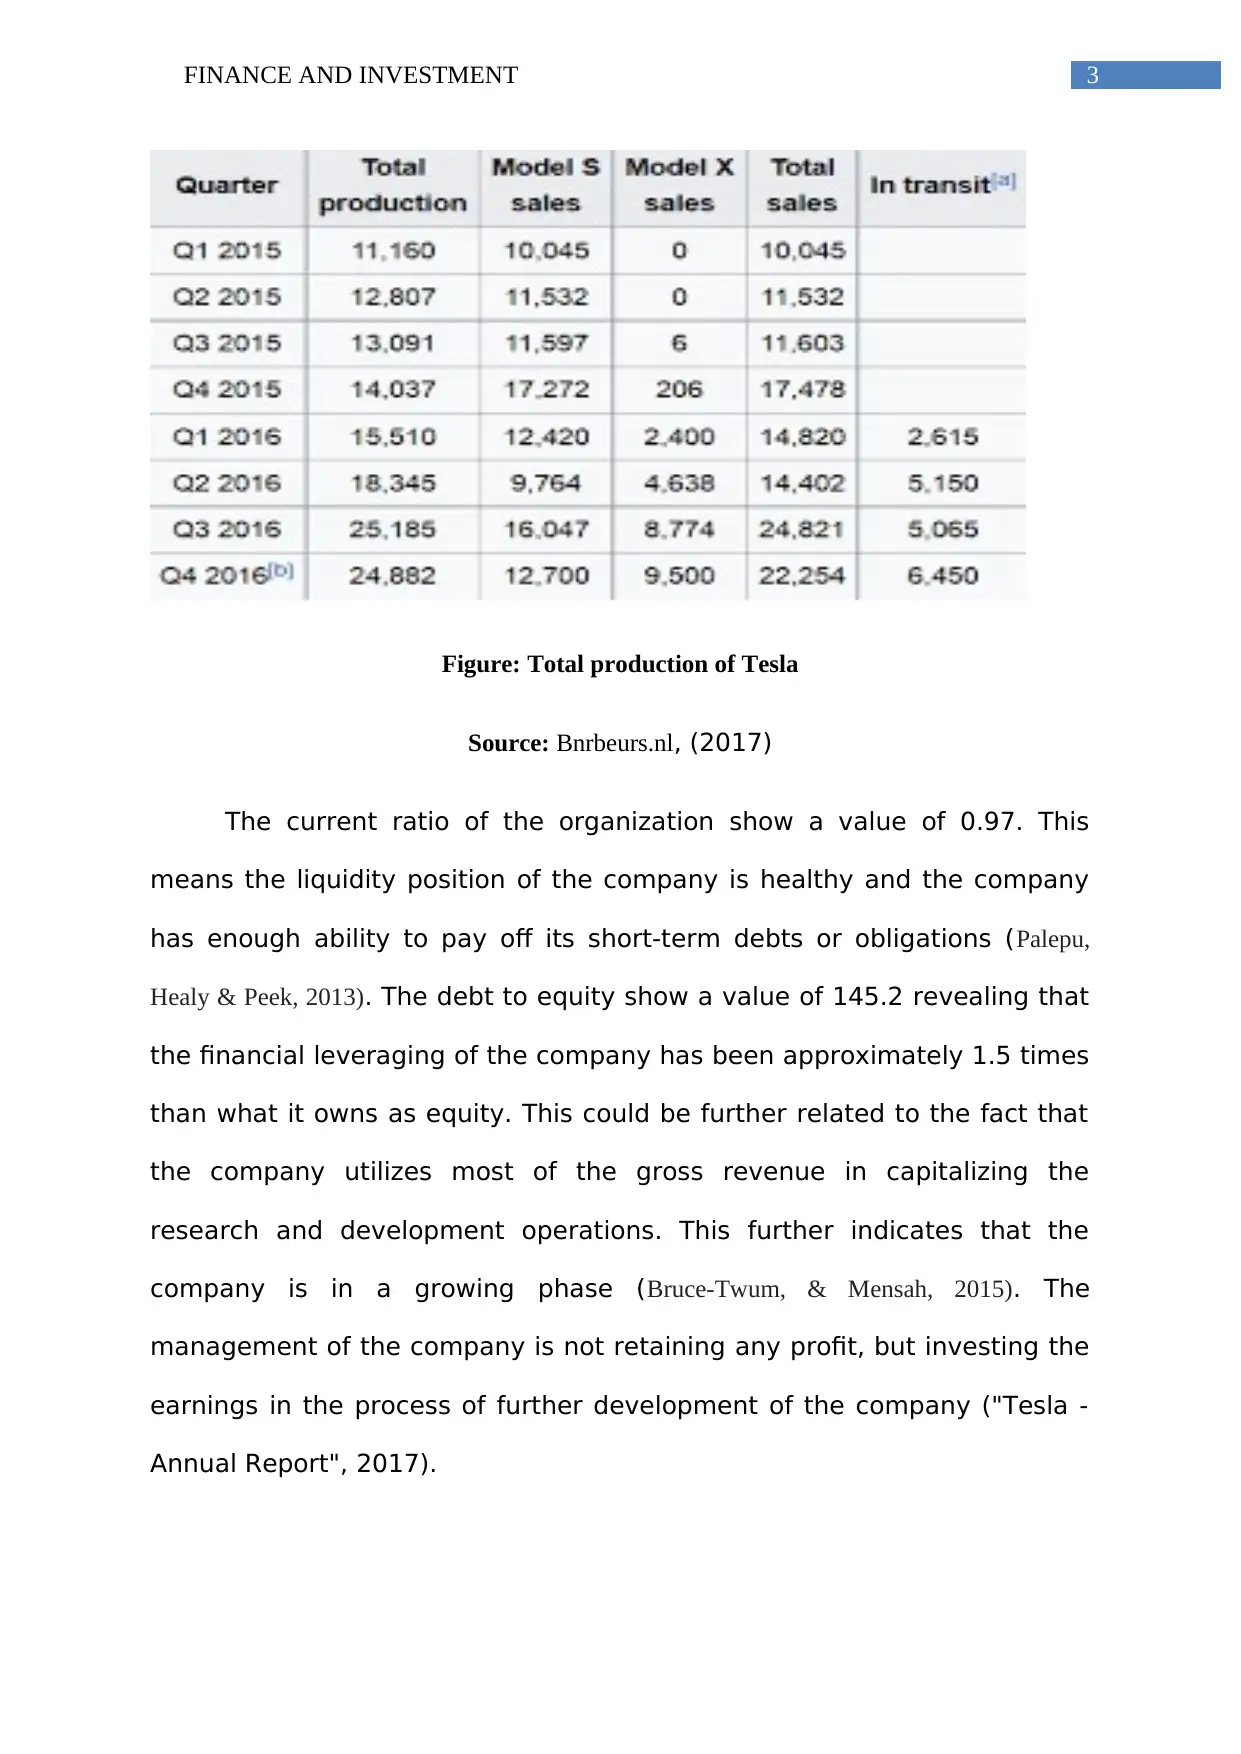
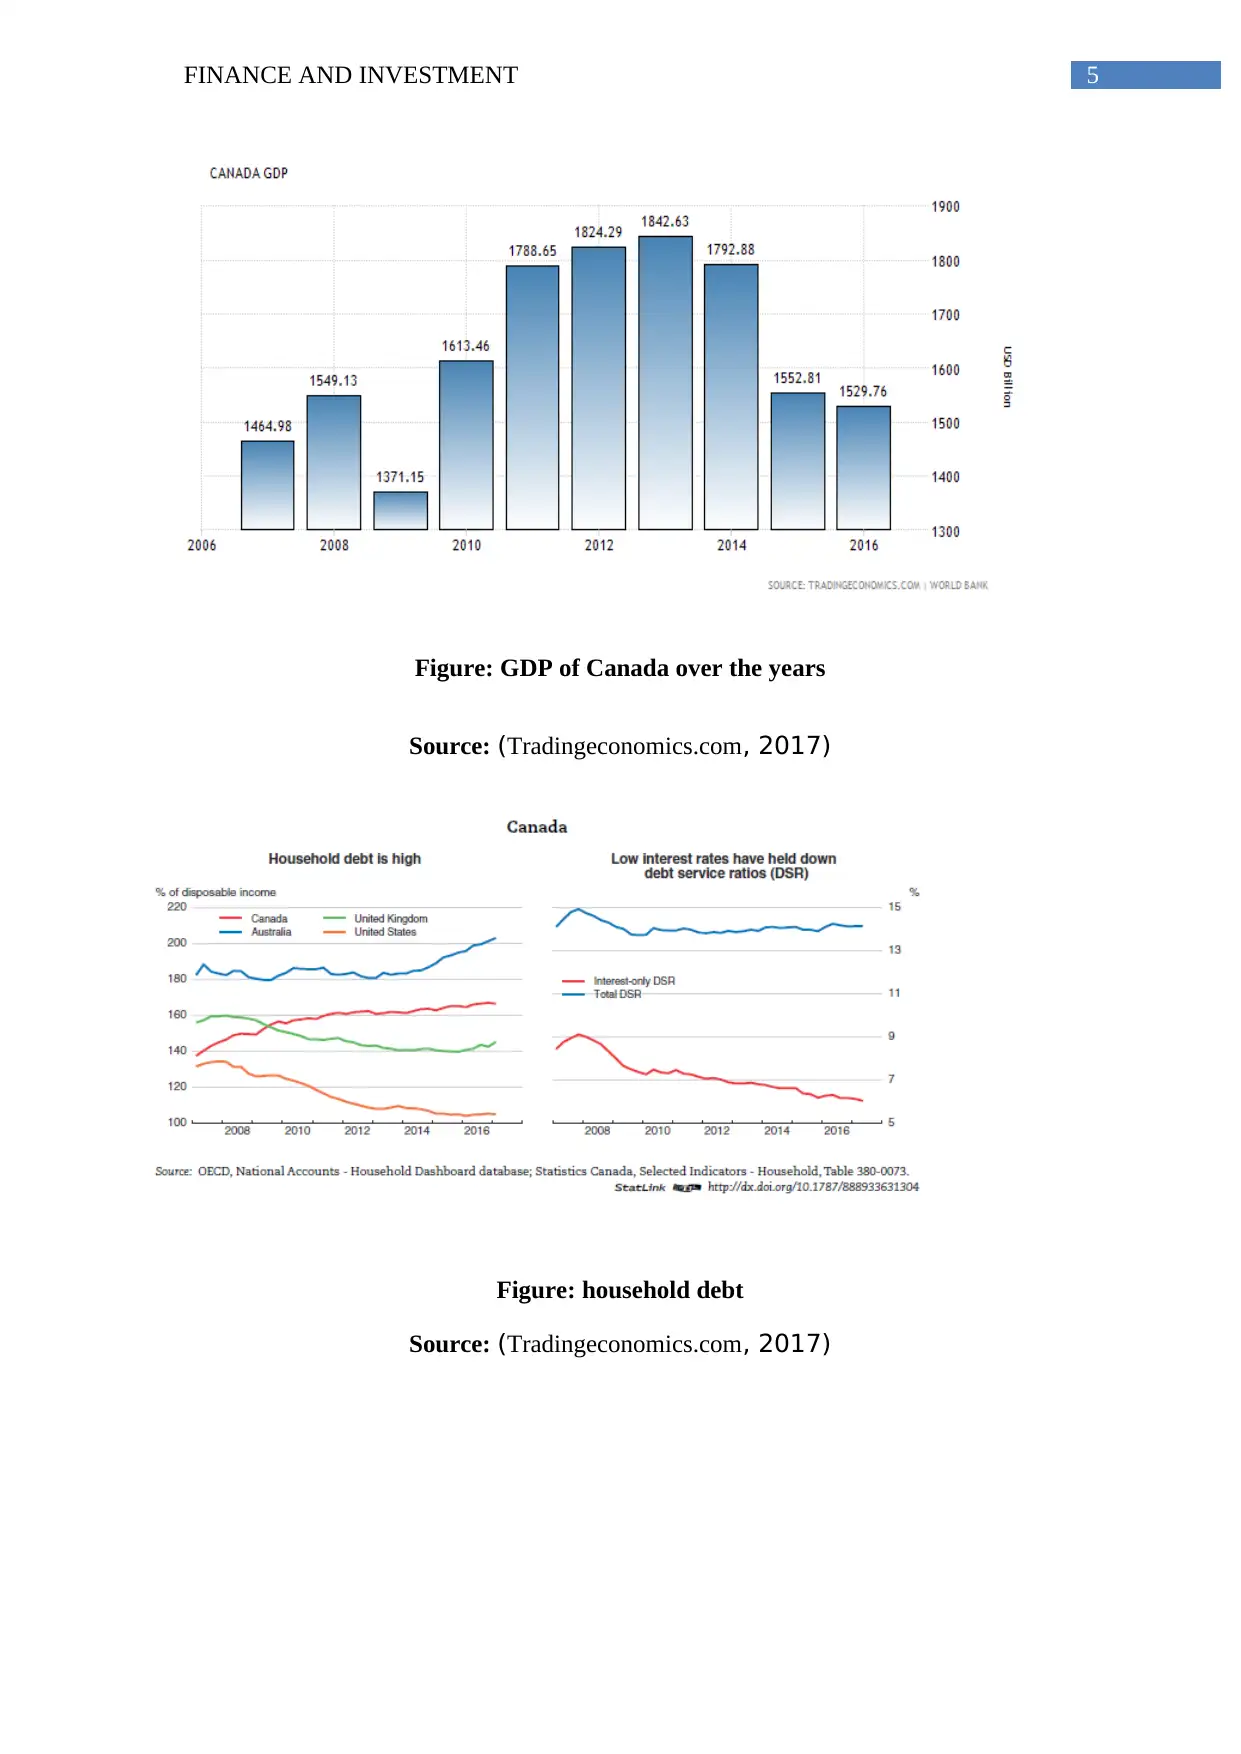
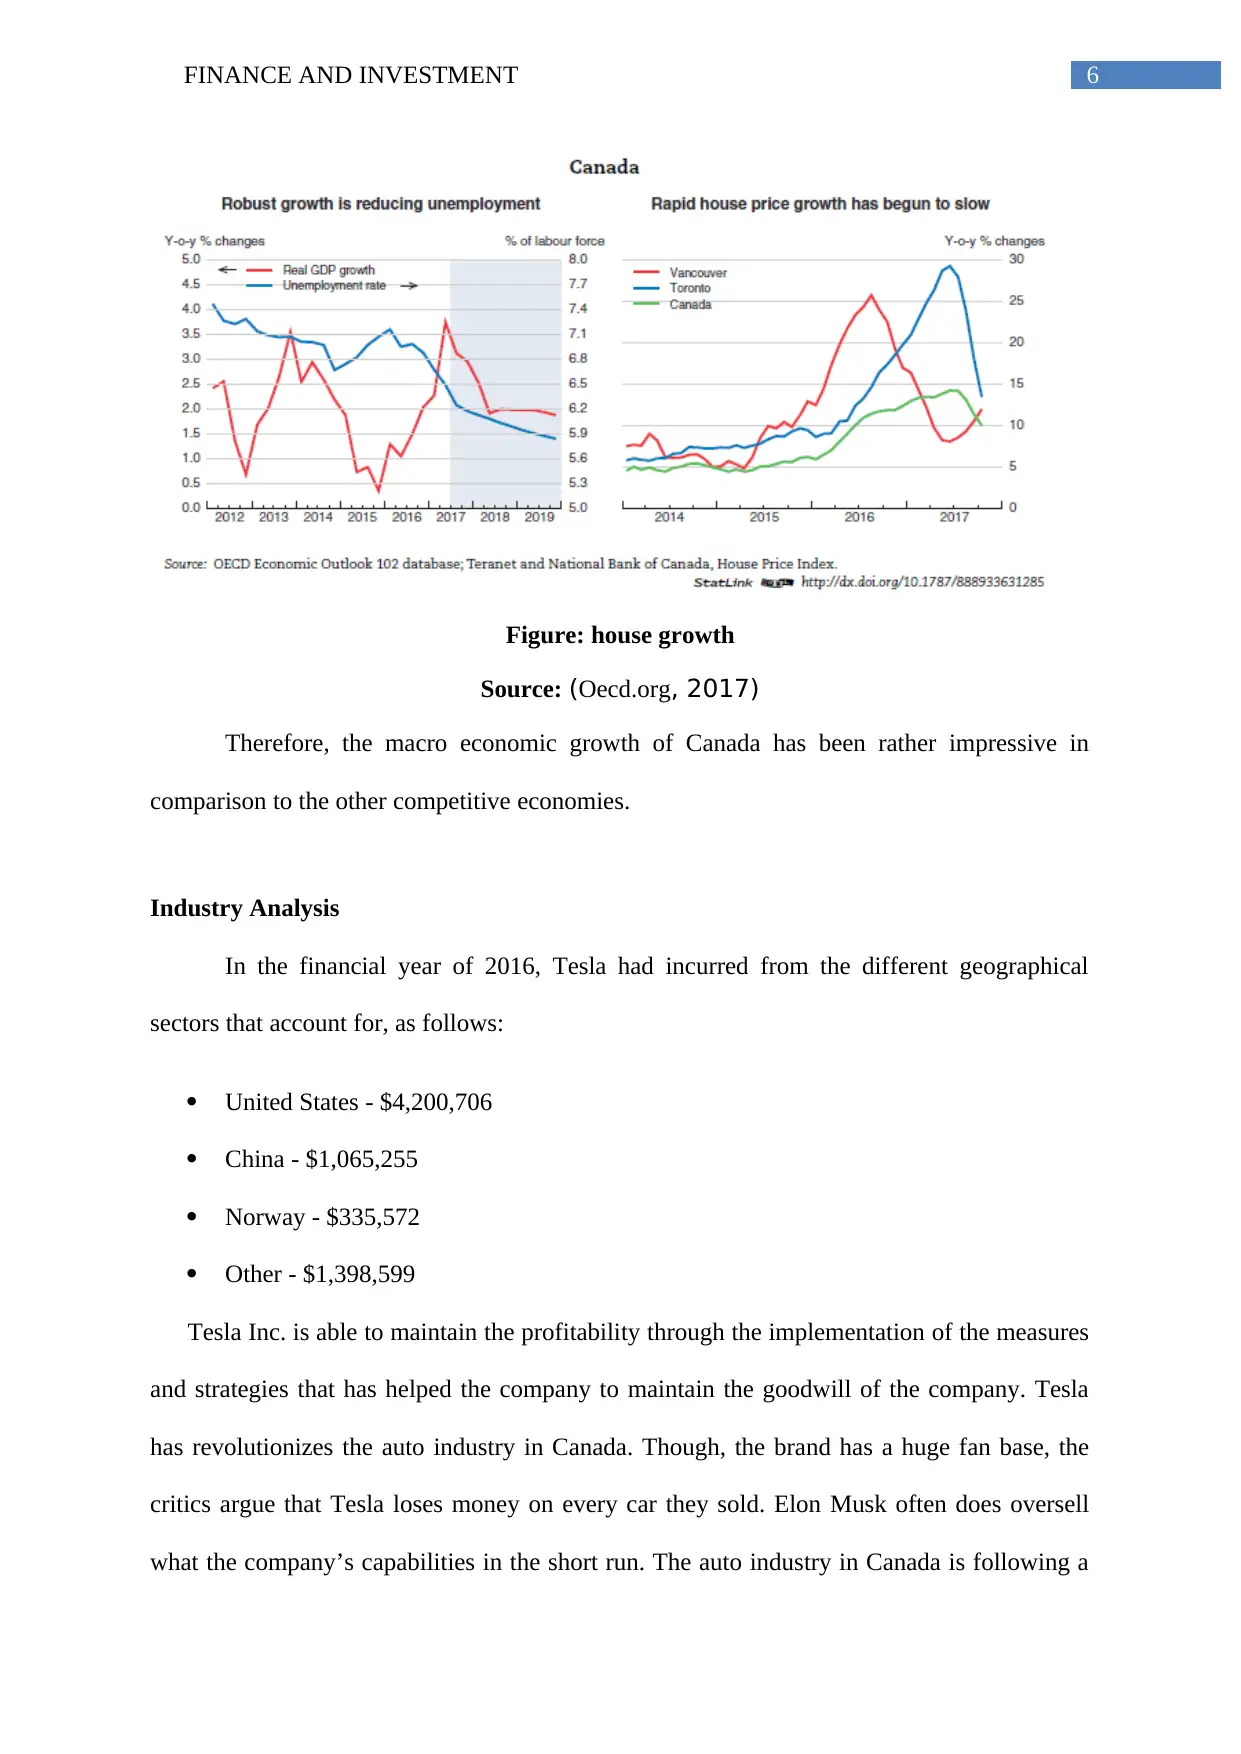
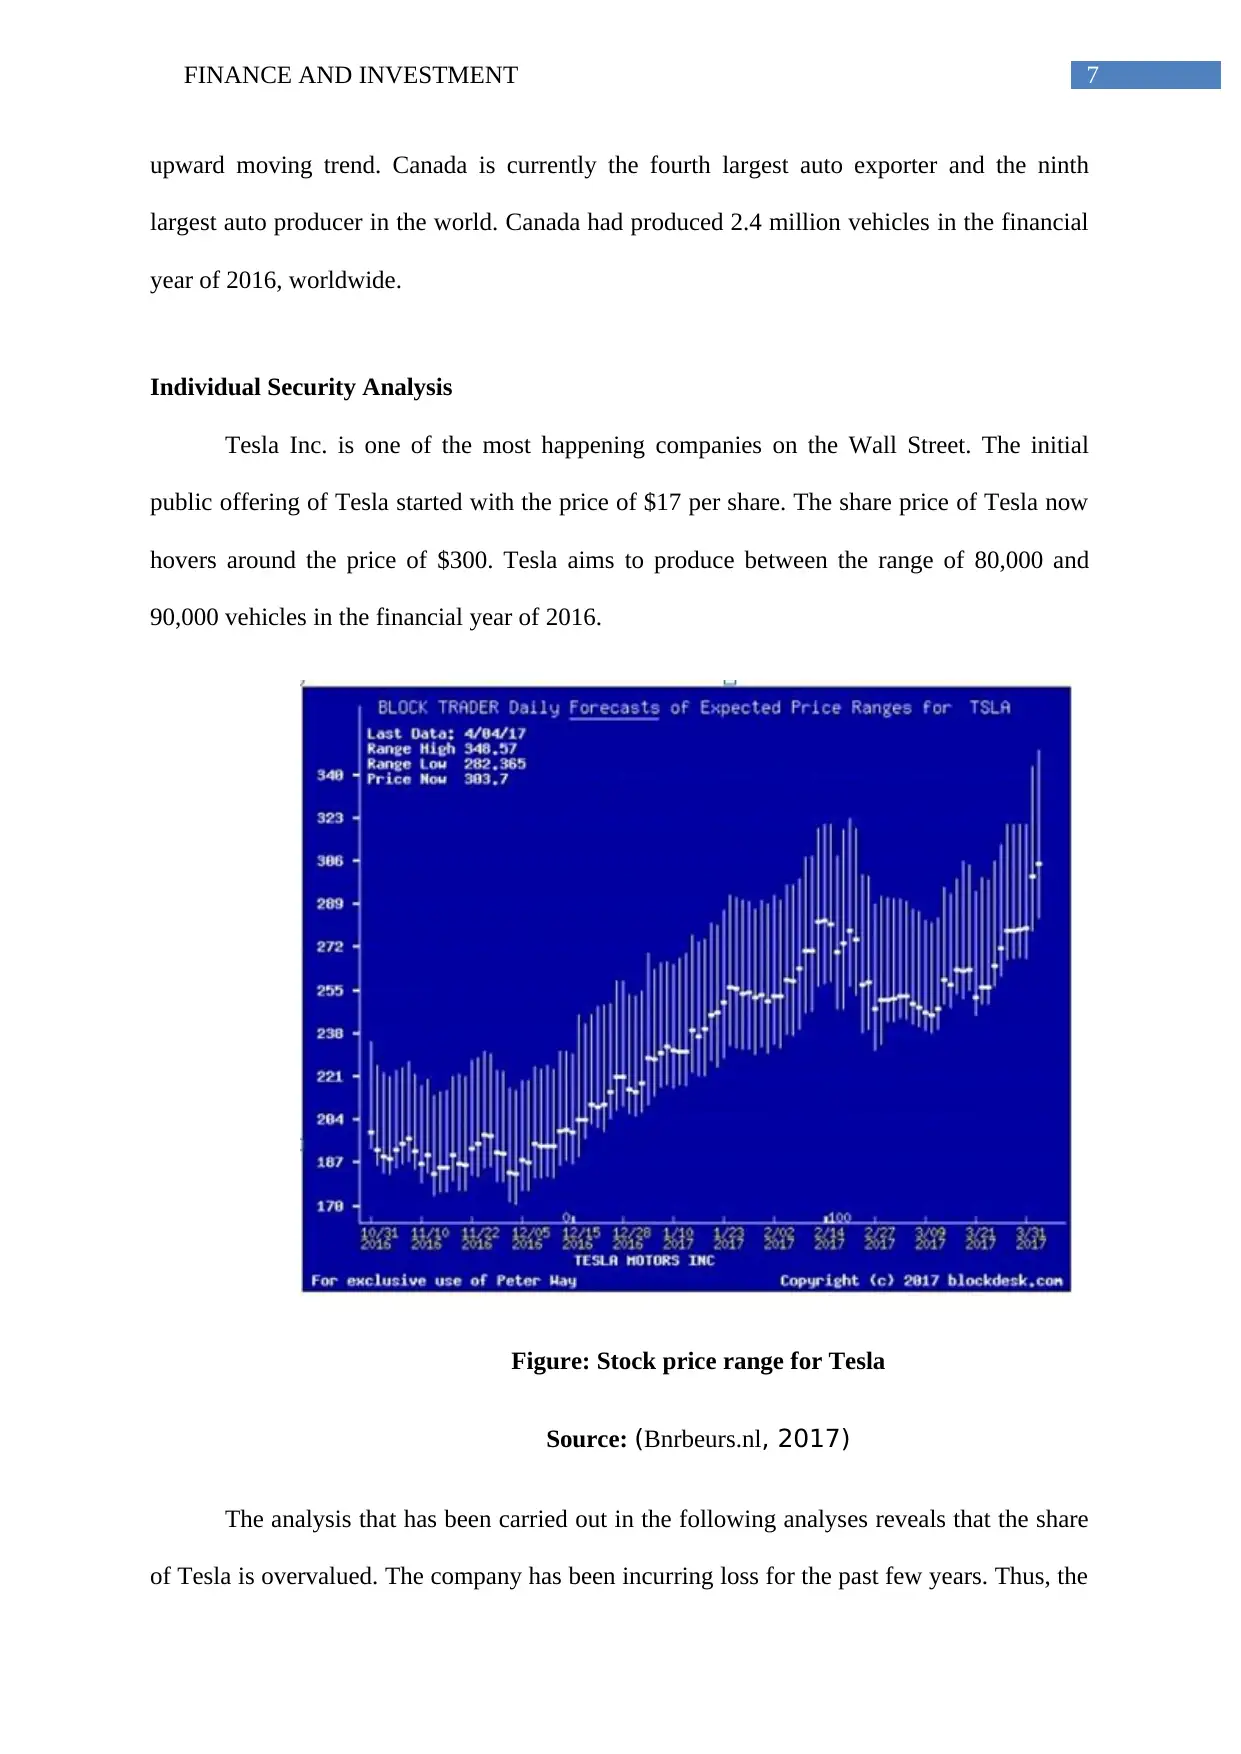
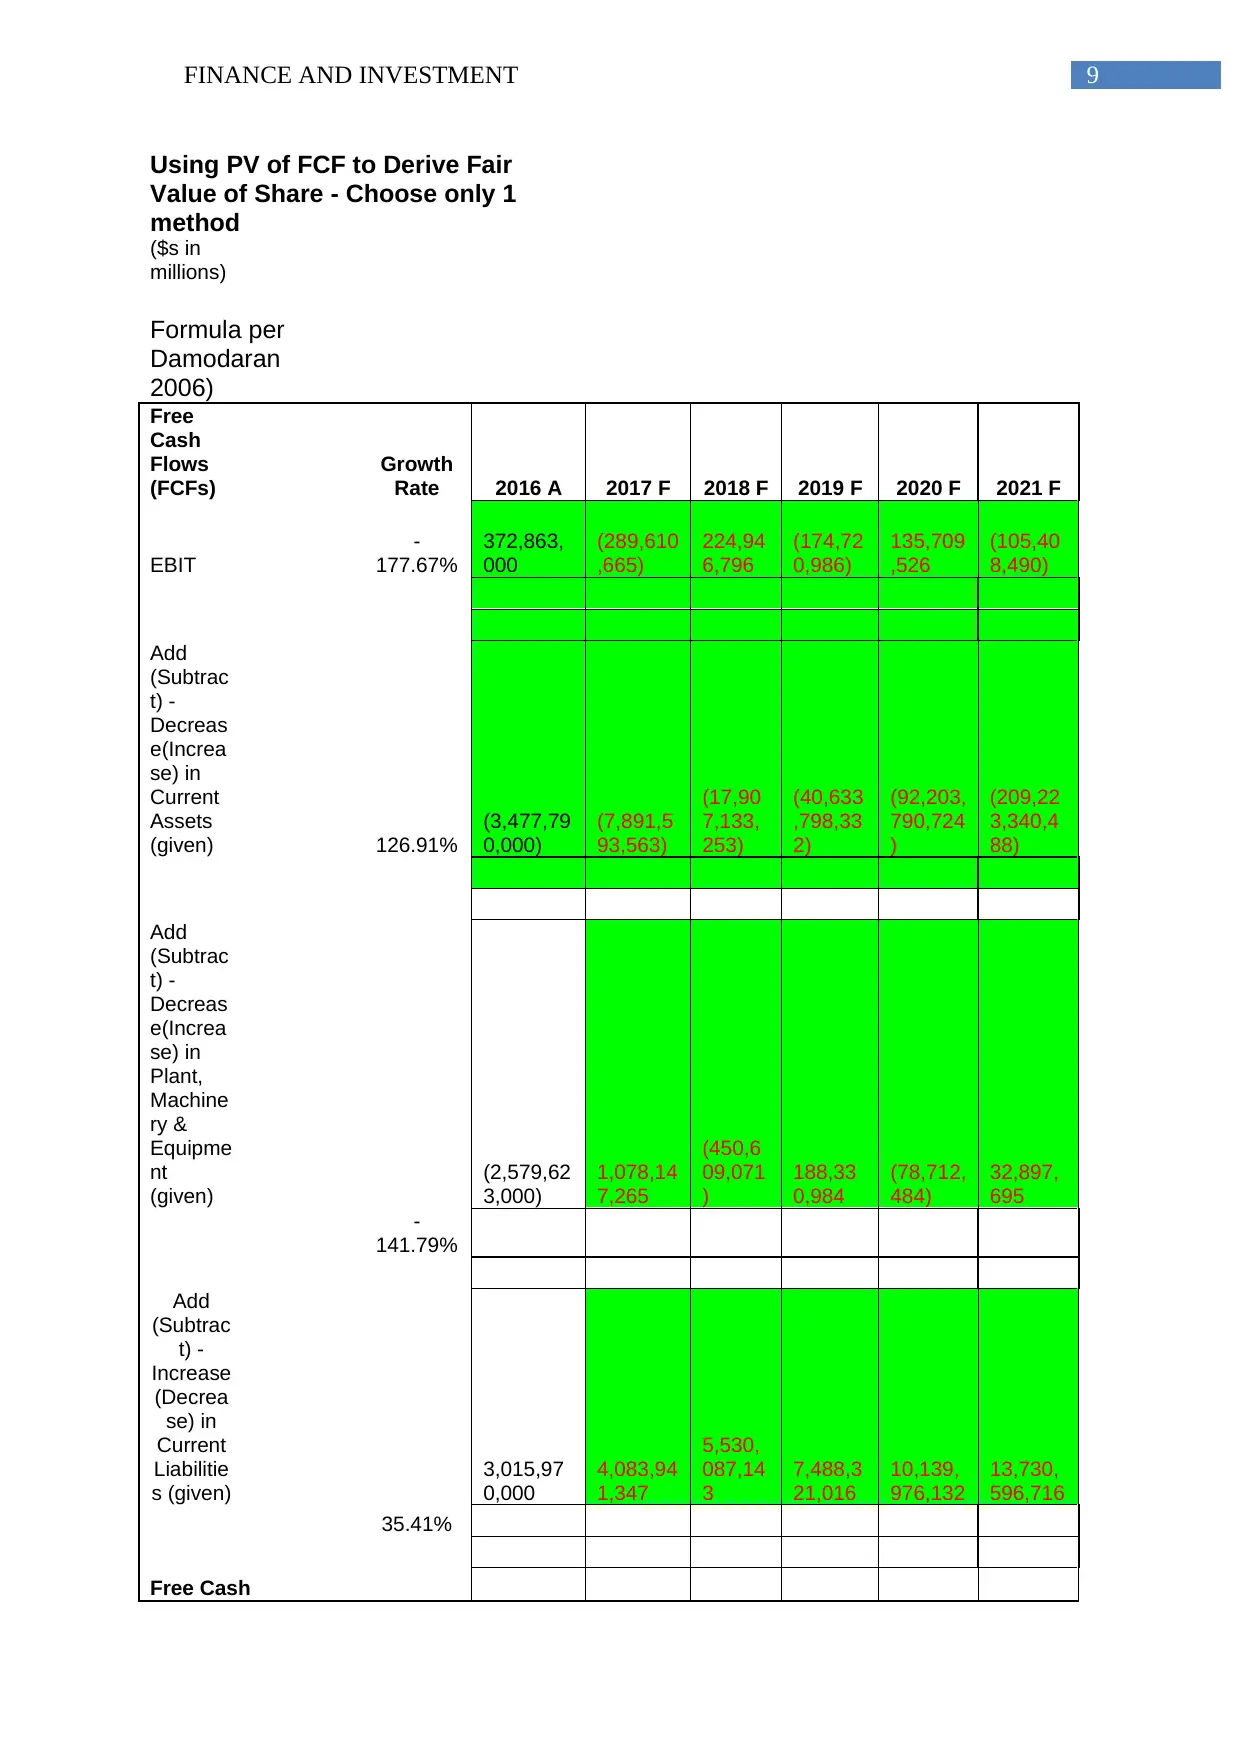
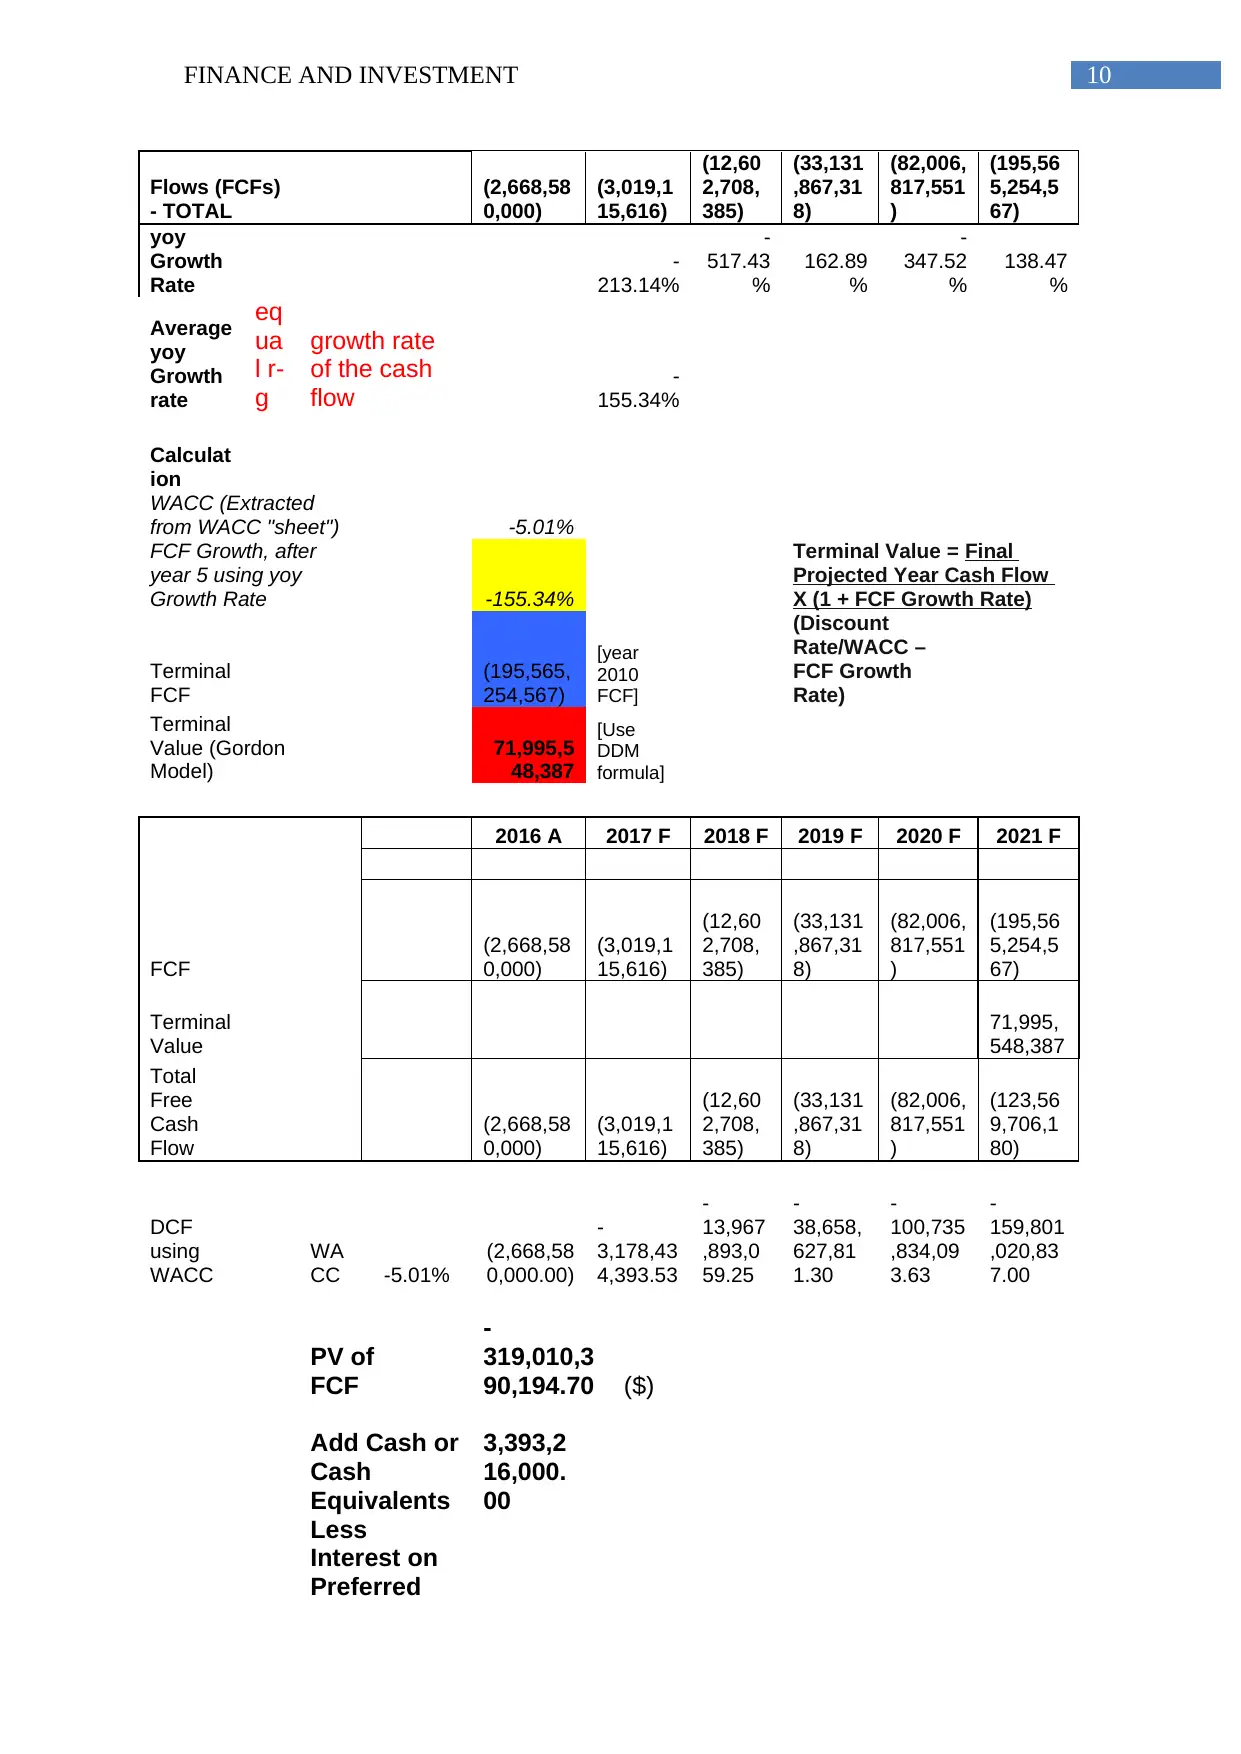
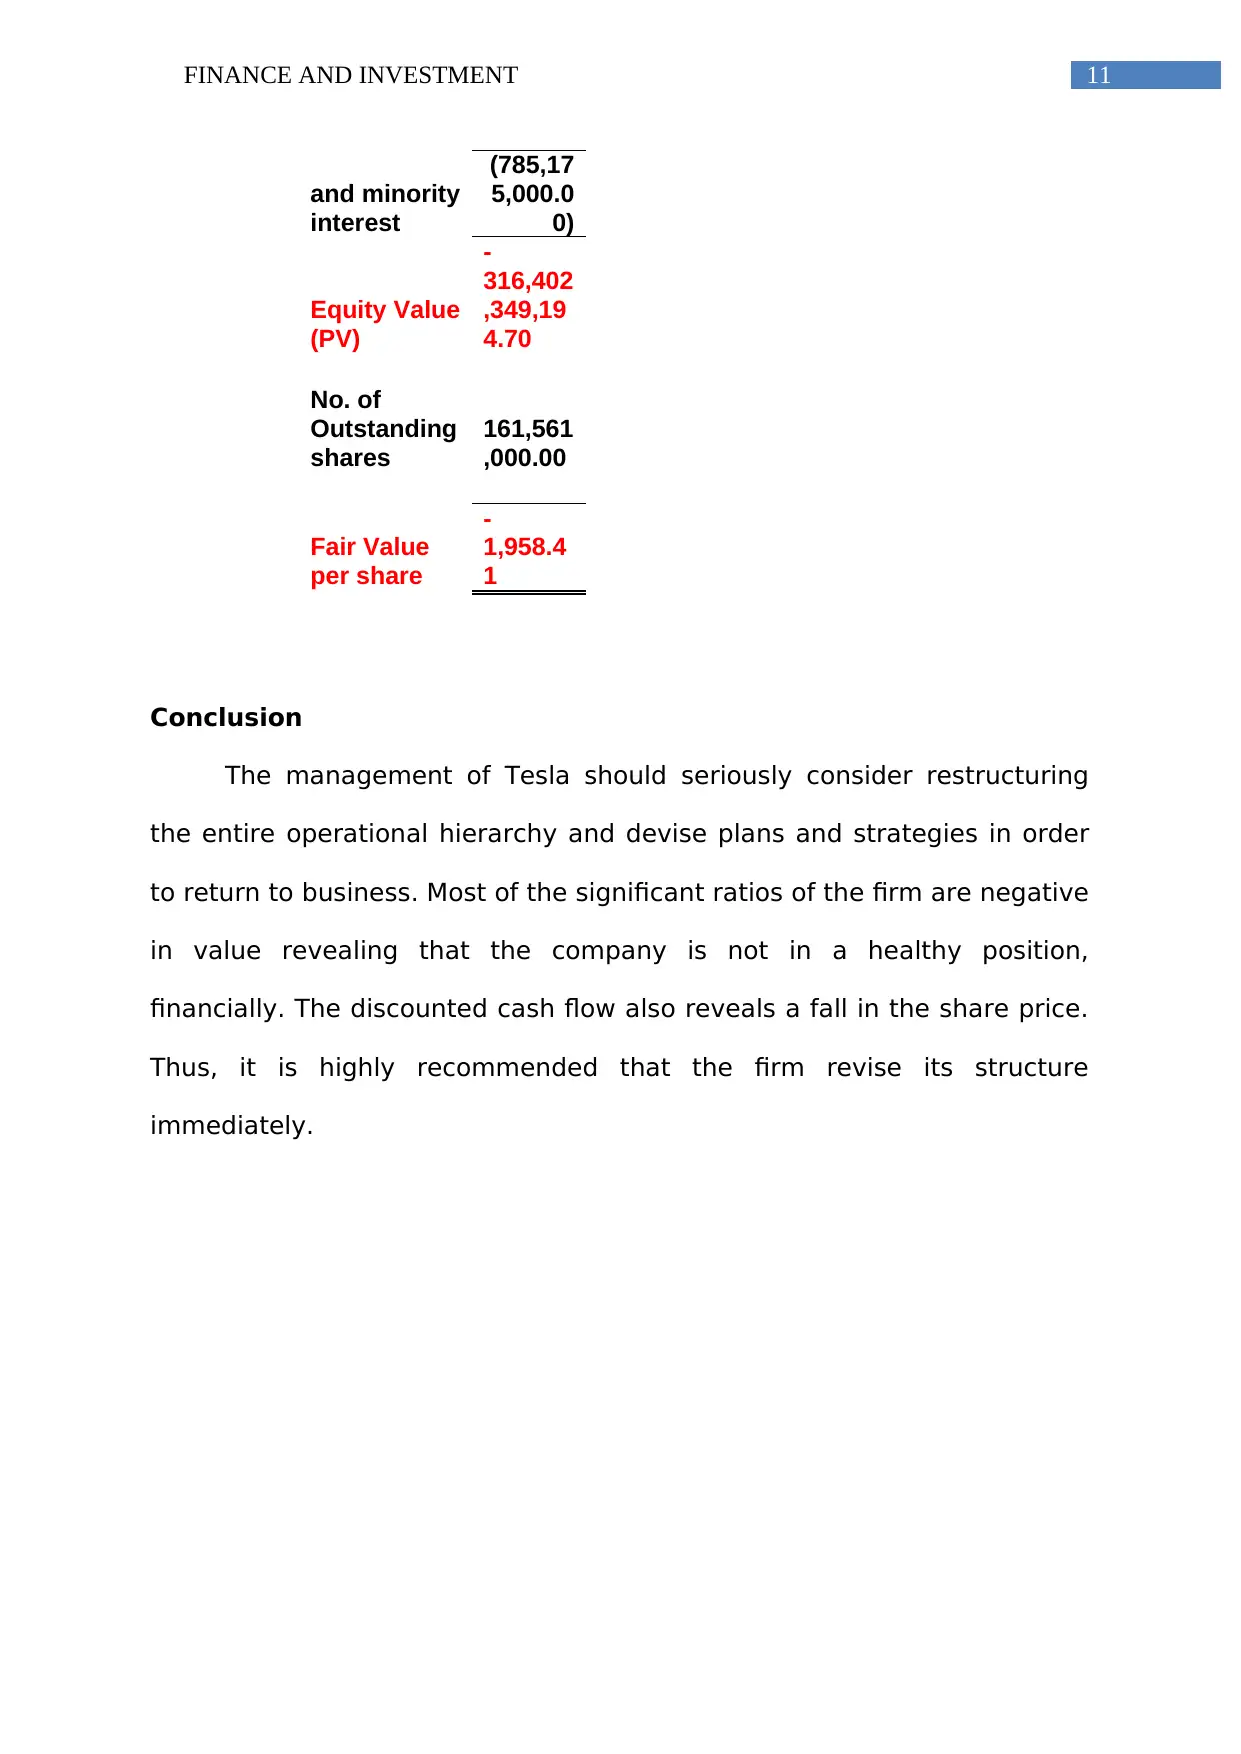
This report provides a financial analysis of Tesla Inc., including an examination of its gross profit, net income, and Earnings Before Interest and Taxes (EBIT) across the financial years 2014-2016. It assesses Tesla's production volumes, current ratio, debt-to-equity ratio, profit margin, return on assets, and return on equity. The analysis incorporates a macroeconomic overview of Canada, industry analysis focusing on Tesla's geographical revenue sectors, and an individual security analysis, including a discounted cash flow (DCF) valuation to determine the fair value of Tesla's shares. The report concludes with a recommendation for Tesla to restructure its operations to improve financial health, as key financial ratios indicate potential instability and the DCF analysis suggests an overvalued stock price.

Running head: FINANCE AND INVESTMENT
Finance and Investment
Name of the Student:
Name of the University:
Author Note
Finance and Investment
Name of the Student:
Name of the University:
Author Note
Paraphrase This Document
Need a fresh take? Get an instant paraphrase of this document with our AI Paraphraser

1FINANCE AND INVESTMENT
Table of Contents
Introduction................................................................................................................................2
Financial Analysis of Tesla........................................................................................................2
Macro economic Analysis..........................................................................................................4
Industry Analysis.......................................................................................................................6
Individual Security Analysis......................................................................................................6
Conclusion............................................................................................................................10
References................................................................................................................................11
Appendix...............................................................................................................................12

2FINANCE AND INVESTMENT
Introduction
The financial evaluation and performance of an industry can be essentially measured
with the help of certain methods and accounting techniques like financial ratio analysis and
other economic indicators that are essential in finding out the financial condition as well as
performance of the concerned company (Lin et al., 2015).
The company that has been taken up for the purpose of analysis in this particular
study is Tesla Inc. Tesla Inc. manufactures, designs and deals in electric vehicles and electric
vehicle power-train components.
Financial Analysis of Tesla
The gross profit obtained by Tesla for the financial year of 2014, 2015 and 2016 has
been in the range of $881,671, $923,503 and $1,599,257. This means that the company has
been following an increasing trend. However, the net income has been a negative figure. This
means that the expenses pertaining to research and development and selling, general and
administrative expenses have been greater than the gross profit. This has essentially resulted
in a negative Earnings before Interest and Taxes (EBIT) that has been -$547,538, -$756,773
and -$183,750. After deduction of the net expenses, the resultant net income for Tesla has
been displaying negative figures. The net income for the financial year of 2016 has been -
$674,914. The different products that the company manufactures ranges within the
technology sector that is designed in order to support batteries. Model S, Model X, Model 3.
The detailed production of Tesla in the financial year of 2016 and the quarters of 2017 have
been cited in the following table:
⊘ This is a preview!⊘
Do you want full access?
Subscribe today to unlock all pages.

Trusted by 1+ million students worldwide

3FINANCE AND INVESTMENT
Figure: Total production of Tesla
Source: Bnrbeurs.nl, (2017)
The current ratio of the organization show a value of 0.97. This
means the liquidity position of the company is healthy and the company
has enough ability to pay off its short-term debts or obligations (Palepu,
Healy & Peek, 2013). The debt to equity show a value of 145.2 revealing that
the financial leveraging of the company has been approximately 1.5 times
than what it owns as equity. This could be further related to the fact that
the company utilizes most of the gross revenue in capitalizing the
research and development operations. This further indicates that the
company is in a growing phase (Bruce-Twum, & Mensah, 2015). The
management of the company is not retaining any profit, but investing the
earnings in the process of further development of the company ("Tesla -
Annual Report", 2017).
Paraphrase This Document
Need a fresh take? Get an instant paraphrase of this document with our AI Paraphraser

4FINANCE AND INVESTMENT
The profit margin, though, reveals a negative figure indicating that
the company is in need of a turnaround plan or a rigorous marketing
strategy in order to lift the profitability of business. The return on assets
also is of negative amount that is -2.10%. This indicates that the firm is
not able to utilize its assets optimally in the generation of revenue (Yahoo
Finance, 2017).
The return on equity also reveals the fact that the returns, that the
company gains from utilizing its own capital is not optimum (Alin-Eliodor,
2014).
However, the only sign of relief is that Tesla is in a better position in
respect of its fellow competitor companies with a share price of $305.2
Macro economic Analysis
The macro-economic environment in Canada has been displaying strong economic
growth in the first quarter of the financial year of 2017. The growth has been majorly led by
household consumption. The interest rates have increased in the financial year of 2017, which
have led to monetary stimulus. High house prices and associated debt levels remain a
substantial financial vulnerability. The Gross Domestic product generated over the years have
been as revealed by the following graph.

5FINANCE AND INVESTMENT
Figure: GDP of Canada over the years
Source: (Tradingeconomics.com, 2017)
Figure: household debt
Source: (Tradingeconomics.com, 2017)
Figure: GDP of Canada over the years
Source: (Tradingeconomics.com, 2017)
Figure: household debt
Source: (Tradingeconomics.com, 2017)
⊘ This is a preview!⊘
Do you want full access?
Subscribe today to unlock all pages.

Trusted by 1+ million students worldwide

6FINANCE AND INVESTMENT
Figure: house growth
Source: (Oecd.org, 2017)
Therefore, the macro economic growth of Canada has been rather impressive in
comparison to the other competitive economies.
Industry Analysis
In the financial year of 2016, Tesla had incurred from the different geographical
sectors that account for, as follows:
United States - $4,200,706
China - $1,065,255
Norway - $335,572
Other - $1,398,599
Tesla Inc. is able to maintain the profitability through the implementation of the measures
and strategies that has helped the company to maintain the goodwill of the company. Tesla
has revolutionizes the auto industry in Canada. Though, the brand has a huge fan base, the
critics argue that Tesla loses money on every car they sold. Elon Musk often does oversell
what the company’s capabilities in the short run. The auto industry in Canada is following a
Paraphrase This Document
Need a fresh take? Get an instant paraphrase of this document with our AI Paraphraser

7FINANCE AND INVESTMENT
upward moving trend. Canada is currently the fourth largest auto exporter and the ninth
largest auto producer in the world. Canada had produced 2.4 million vehicles in the financial
year of 2016, worldwide.
Individual Security Analysis
Tesla Inc. is one of the most happening companies on the Wall Street. The initial
public offering of Tesla started with the price of $17 per share. The share price of Tesla now
hovers around the price of $300. Tesla aims to produce between the range of 80,000 and
90,000 vehicles in the financial year of 2016.
Figure: Stock price range for Tesla
Source: (Bnrbeurs.nl, 2017)
The analysis that has been carried out in the following analyses reveals that the share
of Tesla is overvalued. The company has been incurring loss for the past few years. Thus, the

8FINANCE AND INVESTMENT
fair value per share has been a negative figure indicating that the profitability of the company
has deteriorated and has come down to a negative figure (-1,958.41). The management should
seriously consider strategizing a turnaround plan that will improve the profitability of the
company, thus retrieving the intrinsic value to a positive figure.
⊘ This is a preview!⊘
Do you want full access?
Subscribe today to unlock all pages.

Trusted by 1+ million students worldwide

9FINANCE AND INVESTMENT
Using PV of FCF to Derive Fair
Value of Share - Choose only 1
method
($s in
millions)
Formula per
Damodaran
2006)
Free
Cash
Flows
(FCFs)
Growth
Rate 2016 A 2017 F 2018 F 2019 F 2020 F 2021 F
EBIT
-
177.67%
372,863,
000
(289,610
,665)
224,94
6,796
(174,72
0,986)
135,709
,526
(105,40
8,490)
Add
(Subtrac
t) -
Decreas
e(Increa
se) in
Current
Assets
(given) 126.91%
(3,477,79
0,000)
(7,891,5
93,563)
(17,90
7,133,
253)
(40,633
,798,33
2)
(92,203,
790,724
)
(209,22
3,340,4
88)
Add
(Subtrac
t) -
Decreas
e(Increa
se) in
Plant,
Machine
ry &
Equipme
nt
(given)
(2,579,62
3,000)
1,078,14
7,265
(450,6
09,071
)
188,33
0,984
(78,712,
484)
32,897,
695
-
141.79%
Add
(Subtrac
t) -
Increase
(Decrea
se) in
Current
Liabilitie
s (given)
3,015,97
0,000
4,083,94
1,347
5,530,
087,14
3
7,488,3
21,016
10,139,
976,132
13,730,
596,716
35.41%
Free Cash
Paraphrase This Document
Need a fresh take? Get an instant paraphrase of this document with our AI Paraphraser

10FINANCE AND INVESTMENT
Flows (FCFs)
- TOTAL
(2,668,58
0,000)
(3,019,1
15,616)
(12,60
2,708,
385)
(33,131
,867,31
8)
(82,006,
817,551
)
(195,56
5,254,5
67)
yoy
Growth
Rate
-
213.14%
-
517.43
%
162.89
%
-
347.52
%
138.47
%
Average
yoy
Growth
rate
eq
ua
l r-
g
growth rate
of the cash
flow -
155.34%
Calculat
ion
WACC (Extracted
from WACC "sheet") -5.01%
FCF Growth, after
year 5 using yoy
Growth Rate -155.34%
Terminal Value = Final
Projected Year Cash Flow
X (1 + FCF Growth Rate)
Terminal
FCF
(195,565,
254,567)
[year
2010
FCF]
(Discount
Rate/WACC –
FCF Growth
Rate)
Terminal
Value (Gordon
Model)
71,995,5
48,387
[Use
DDM
formula]
2016 A 2017 F 2018 F 2019 F 2020 F 2021 F
FCF
(2,668,58
0,000)
(3,019,1
15,616)
(12,60
2,708,
385)
(33,131
,867,31
8)
(82,006,
817,551
)
(195,56
5,254,5
67)
Terminal
Value
71,995,
548,387
Total
Free
Cash
Flow
(2,668,58
0,000)
(3,019,1
15,616)
(12,60
2,708,
385)
(33,131
,867,31
8)
(82,006,
817,551
)
(123,56
9,706,1
80)
DCF
using
WACC
WA
CC -5.01%
(2,668,58
0,000.00)
-
3,178,43
4,393.53
-
13,967
,893,0
59.25
-
38,658,
627,81
1.30
-
100,735
,834,09
3.63
-
159,801
,020,83
7.00
PV of
FCF
-
319,010,3
90,194.70 ($)
Add Cash or
Cash
Equivalents
3,393,2
16,000.
00
Less
Interest on
Preferred

11FINANCE AND INVESTMENT
and minority
interest
(785,17
5,000.0
0)
Equity Value
(PV)
-
316,402
,349,19
4.70
No. of
Outstanding
shares
161,561
,000.00
Fair Value
per share
-
1,958.4
1
Conclusion
The management of Tesla should seriously consider restructuring
the entire operational hierarchy and devise plans and strategies in order
to return to business. Most of the significant ratios of the firm are negative
in value revealing that the company is not in a healthy position,
financially. The discounted cash flow also reveals a fall in the share price.
Thus, it is highly recommended that the firm revise its structure
immediately.
⊘ This is a preview!⊘
Do you want full access?
Subscribe today to unlock all pages.

Trusted by 1+ million students worldwide
1 out of 15
Related Documents

Your All-in-One AI-Powered Toolkit for Academic Success.
+13062052269
info@desklib.com
Available 24*7 on WhatsApp / Email
Unlock your academic potential
Copyright © 2020–2025 A2Z Services. All Rights Reserved. Developed and managed by ZUCOL.