Business and Financial Performance: A Critical Look at Tesla & Ford
VerifiedAdded on 2023/06/14
|25
|7861
|480
Report
AI Summary
This report provides a comparative analysis of Tesla and Ford's business and financial performance between 2019 and 2021. It begins with an introduction to both companies, outlining their core businesses and market positions. The research objectives focus on assessing the macro environment using PESTLE, evaluating Tesla's market position via SWOT, analyzing marketing strategies with the 4Ps, exploring strategic options with the Ansoff Matrix, and comparing financial performance through ratio analysis. The report reviews current strategies, including Tesla's market penetration and Ford's cost leadership. The literature review incorporates established models to analyze the macro environment, market position, marketing strategies, and strategic options. The analysis section includes SWOT, PESTLE, 4Ps marketing mix, Ansoff Matrix, and ratio analysis to compare the two companies' financial performance. The conclusion summarizes the key findings and offers insights into the strategic and financial implications for both Tesla and Ford.
A Critical Analysis of
Teslas Business and
Financial Performance
with Ford Motors 2019
to 2021
Teslas Business and
Financial Performance
with Ford Motors 2019
to 2021
Paraphrase This Document
Need a fresh take? Get an instant paraphrase of this document with our AI Paraphraser

Contents
INTRODUCTION...........................................................................................................................3
RESEARCH OBJECTIVES............................................................................................................4
CURRENT STRATEGIES FOLLOWED BY THE ORGANISATION........................................4
LITERATURE REVIEW USING ESTABLISHED MODELS......................................................5
RESEARCH METHODOLOGY.....................................................................................................9
ANALYSIS....................................................................................................................................10
SWOT..................................................................................................................................10
PESTLE...............................................................................................................................11
FOUR Ps MARKETING MIX..........................................................................................13
ANSOFF MATRIX............................................................................................................14
RATIO ANALYSIS............................................................................................................15
CONCLUSION..............................................................................................................................17
REFERENCES..............................................................................................................................18
⊘ This is a preview!⊘
Do you want full access?
Subscribe today to unlock all pages.
Trusted by 1+ million students worldwide
INTRODUCTION
The business and the monetary performance of any organisation can be determined by the
help of the financial statement that are prepared by every listed and non – listed company. It
helps in measuring the quantifiable information and the standing of the firm in the industry.
Tesla is an American multinational company with headquarters in Austin Texas. It is an electric
vehicle and clean energy organisation. The company mainly creates and produces electric cars,
solar panels, battery energy storage from home to grid-scale, solar roof tiles and many other
products related to it. The company regards as the most valuable company throughout the world
and remains the most valuable automaker in the entire world. The company founded in July,
2003 as Tesla Motors (About Tesla, 2022).
Ford Motor Company is commonly names as Ford. It is also an American brand in car
manufacturing industry. It has its headquarter in Dearborn, Michigan, United States. The founder
Henry Ford announced the company in the year 1903. This automobile company specialises in
selling automobile and commercial goods under the name of Ford. The company owns several
other brands such as Brazilian SUV and Jangling Motors. It has created joint ventures in various
countries such as Chine, Turkey, Thailand and Russia. Ford is known as the second-largest US
based automobile company and fifth in the entire world, behind Volkswagen, Toyota, Hyundai
and more (Ford History, 2020).
The comparative analysis of the two companies is done to identify the monetary
performance and the operating results of in the financial year. It can be judged by evaluating the
annual report and the data information of the company which is utilised for making the
significant differences. The several choices are to be made by the company to ensure that the
decision making process in effectively completed.
The report prepared from collected information gives an idea about the research
objectives and questions which are useful for company’s long life cycle. It helps to have an
explanatory research and design which would be helpful to understand working of company with
a better view. It also serves as a guide to understand analysis and describe the reason behind
events taking place in carrying out operations related to company. It gives a better understanding
to people who are connected with company both internal as well as external users which
contribute to growth and expansion of business. It helps to evaluate that the data provided by the
company is accurate, reliable, reasonable or not. The report is helpful for choosing from best
Paraphrase This Document
Need a fresh take? Get an instant paraphrase of this document with our AI Paraphraser
alternatives available in case of methods applicable I.e. which must be helpful and will serve best
results. It helps to evaluate best hypothesis which would be helpful for the company to be
applied. These are of two types Null and alternate which helps to choose which would be more
effective and efficient policy which can be implemented. This reports helps to build a
competitive advantage in market against other companies as well (Conlon and Ford, 2022). It
helps to find out what could be done, when could be done and which would be the best path for
reaching goals and fulfilling aims wished for. This report gives an idea where the company is
lacking and where it lagging behind which would not only increase its speed towards success but
help to utilise its resources in other areas which would result more beneficial. It can also be
considered as a guide providing solutions for unnecessary issues and problems which can be
easily dealt with in no time.
RESEARCH OBJECTIVES
The main of the research is to gives the summative information and the gap which can be
addressed for fulfilling the performance of Tesla. It will involve the strategic analysis and
evaluation that will involve the skills that need to be displayed by the relevant models and
theory’s in the paper (Gautam, Verma, and Srivastava, 2019). For this the comparative analysis
of the performance of the firm is done.
The objectives of the paper are:
1. To assess the macro environment by undertaking a Pestle analysis.
2. To assess the current position of Tesla in the market by undertaking the SWOT.
3. To analyse the strategy and the models of marketing that are used by Tesla in the
comparison of Ford Motors.
4. To analyse the strategic options followed by Tesla by undertaking a Ansoff Matrix
analysis of Tesla.
5. The evaluate the monetary performance of the Tesla against Ford Motors from the 2
years from 2019 to 2021 analysis on the basis of the fiscal ratios.
CURRENT STRATEGIES FOLLOWED BY THE ORGANISATION
The research about the company suggests that the large emphasis of the organisation is
on the market penetration strategy by developing the aim of gaining sustainability in the market
for increasing the customer satisfaction. Its main aim is to apply the strategy of intensive growth
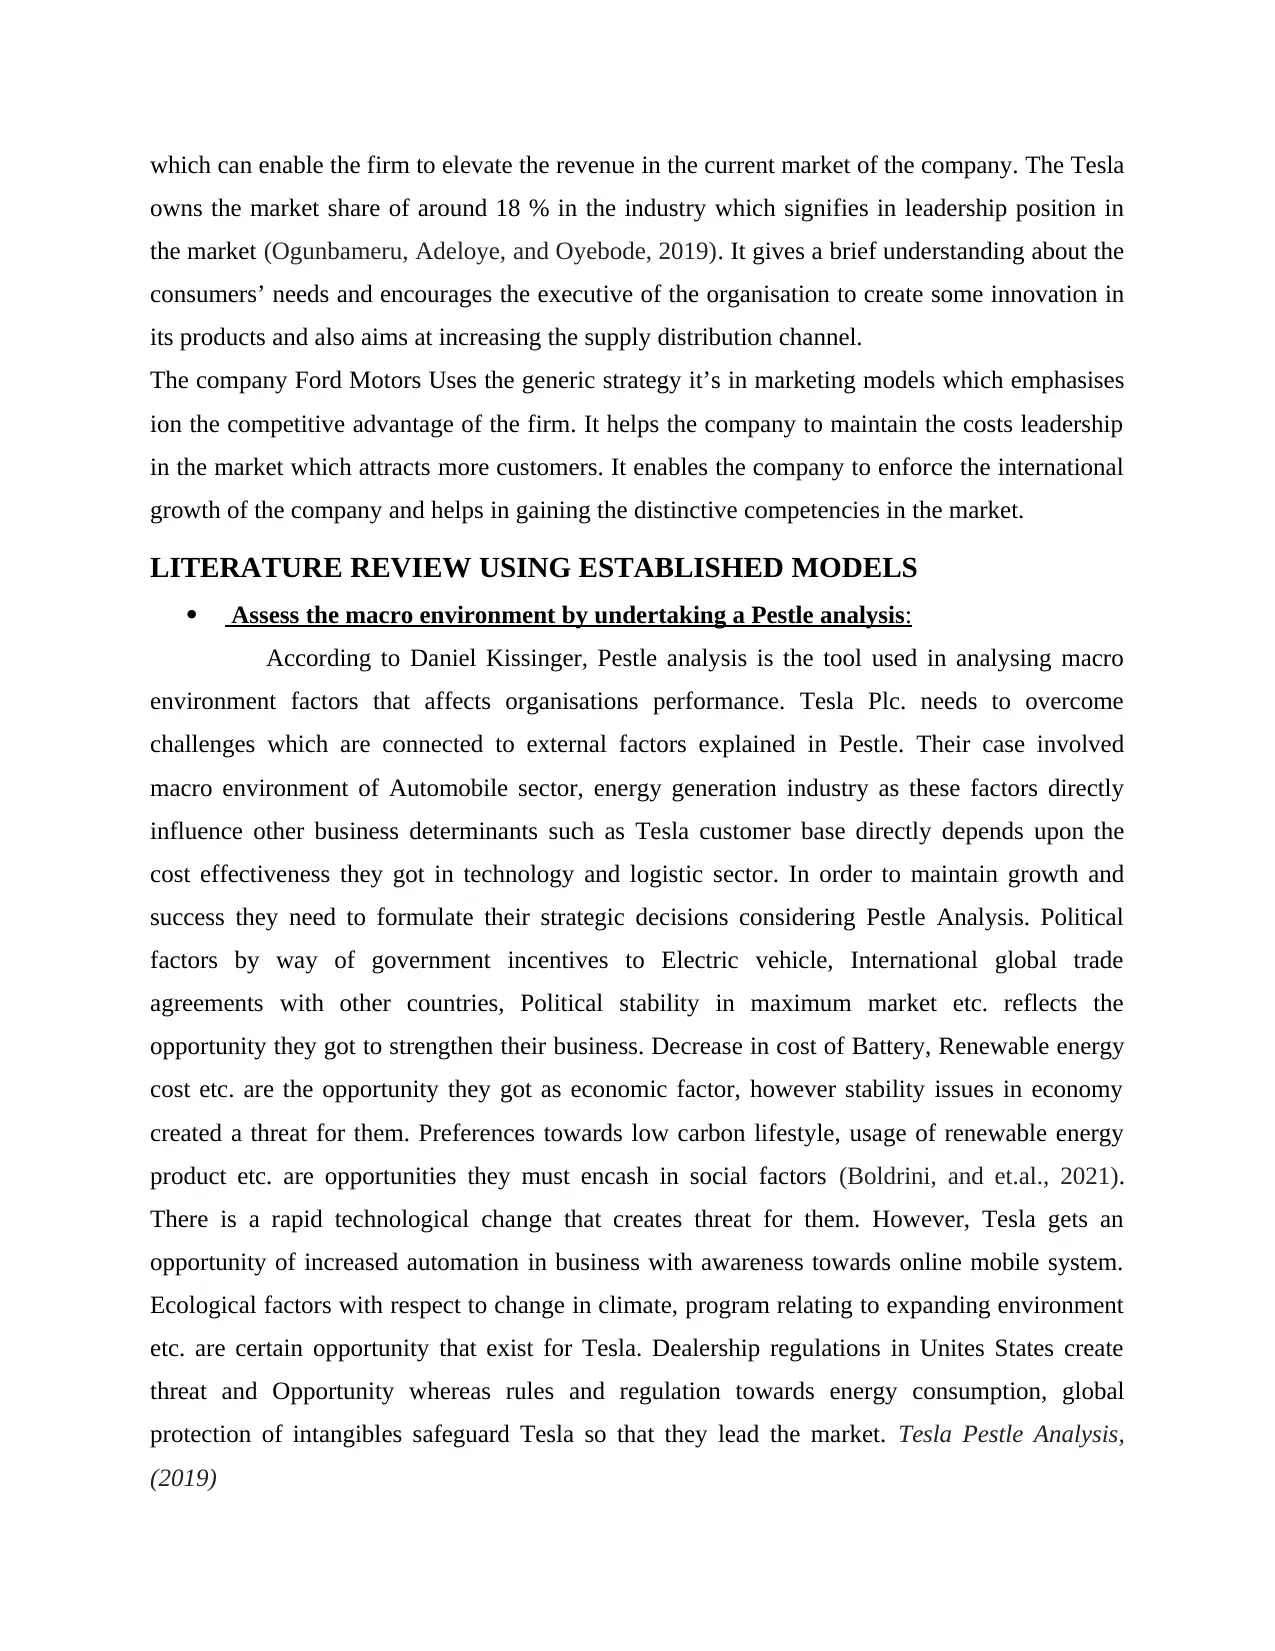
which can enable the firm to elevate the revenue in the current market of the company. The Tesla
owns the market share of around 18 % in the industry which signifies in leadership position in
the market (Ogunbameru, Adeloye, and Oyebode, 2019). It gives a brief understanding about the
consumers’ needs and encourages the executive of the organisation to create some innovation in
its products and also aims at increasing the supply distribution channel.
The company Ford Motors Uses the generic strategy it’s in marketing models which emphasises
ion the competitive advantage of the firm. It helps the company to maintain the costs leadership
in the market which attracts more customers. It enables the company to enforce the international
growth of the company and helps in gaining the distinctive competencies in the market.
LITERATURE REVIEW USING ESTABLISHED MODELS
Assess the macro environment by undertaking a Pestle analysis:
According to Daniel Kissinger, Pestle analysis is the tool used in analysing macro
environment factors that affects organisations performance. Tesla Plc. needs to overcome
challenges which are connected to external factors explained in Pestle. Their case involved
macro environment of Automobile sector, energy generation industry as these factors directly
influence other business determinants such as Tesla customer base directly depends upon the
cost effectiveness they got in technology and logistic sector. In order to maintain growth and
success they need to formulate their strategic decisions considering Pestle Analysis. Political
factors by way of government incentives to Electric vehicle, International global trade
agreements with other countries, Political stability in maximum market etc. reflects the
opportunity they got to strengthen their business. Decrease in cost of Battery, Renewable energy
cost etc. are the opportunity they got as economic factor, however stability issues in economy
created a threat for them. Preferences towards low carbon lifestyle, usage of renewable energy
product etc. are opportunities they must encash in social factors (Boldrini, and et.al., 2021).
There is a rapid technological change that creates threat for them. However, Tesla gets an
opportunity of increased automation in business with awareness towards online mobile system.
Ecological factors with respect to change in climate, program relating to expanding environment
etc. are certain opportunity that exist for Tesla. Dealership regulations in Unites States create
threat and Opportunity whereas rules and regulation towards energy consumption, global
protection of intangibles safeguard Tesla so that they lead the market. Tesla Pestle Analysis,
(2019)
⊘ This is a preview!⊘
Do you want full access?
Subscribe today to unlock all pages.
Trusted by 1+ million students worldwide
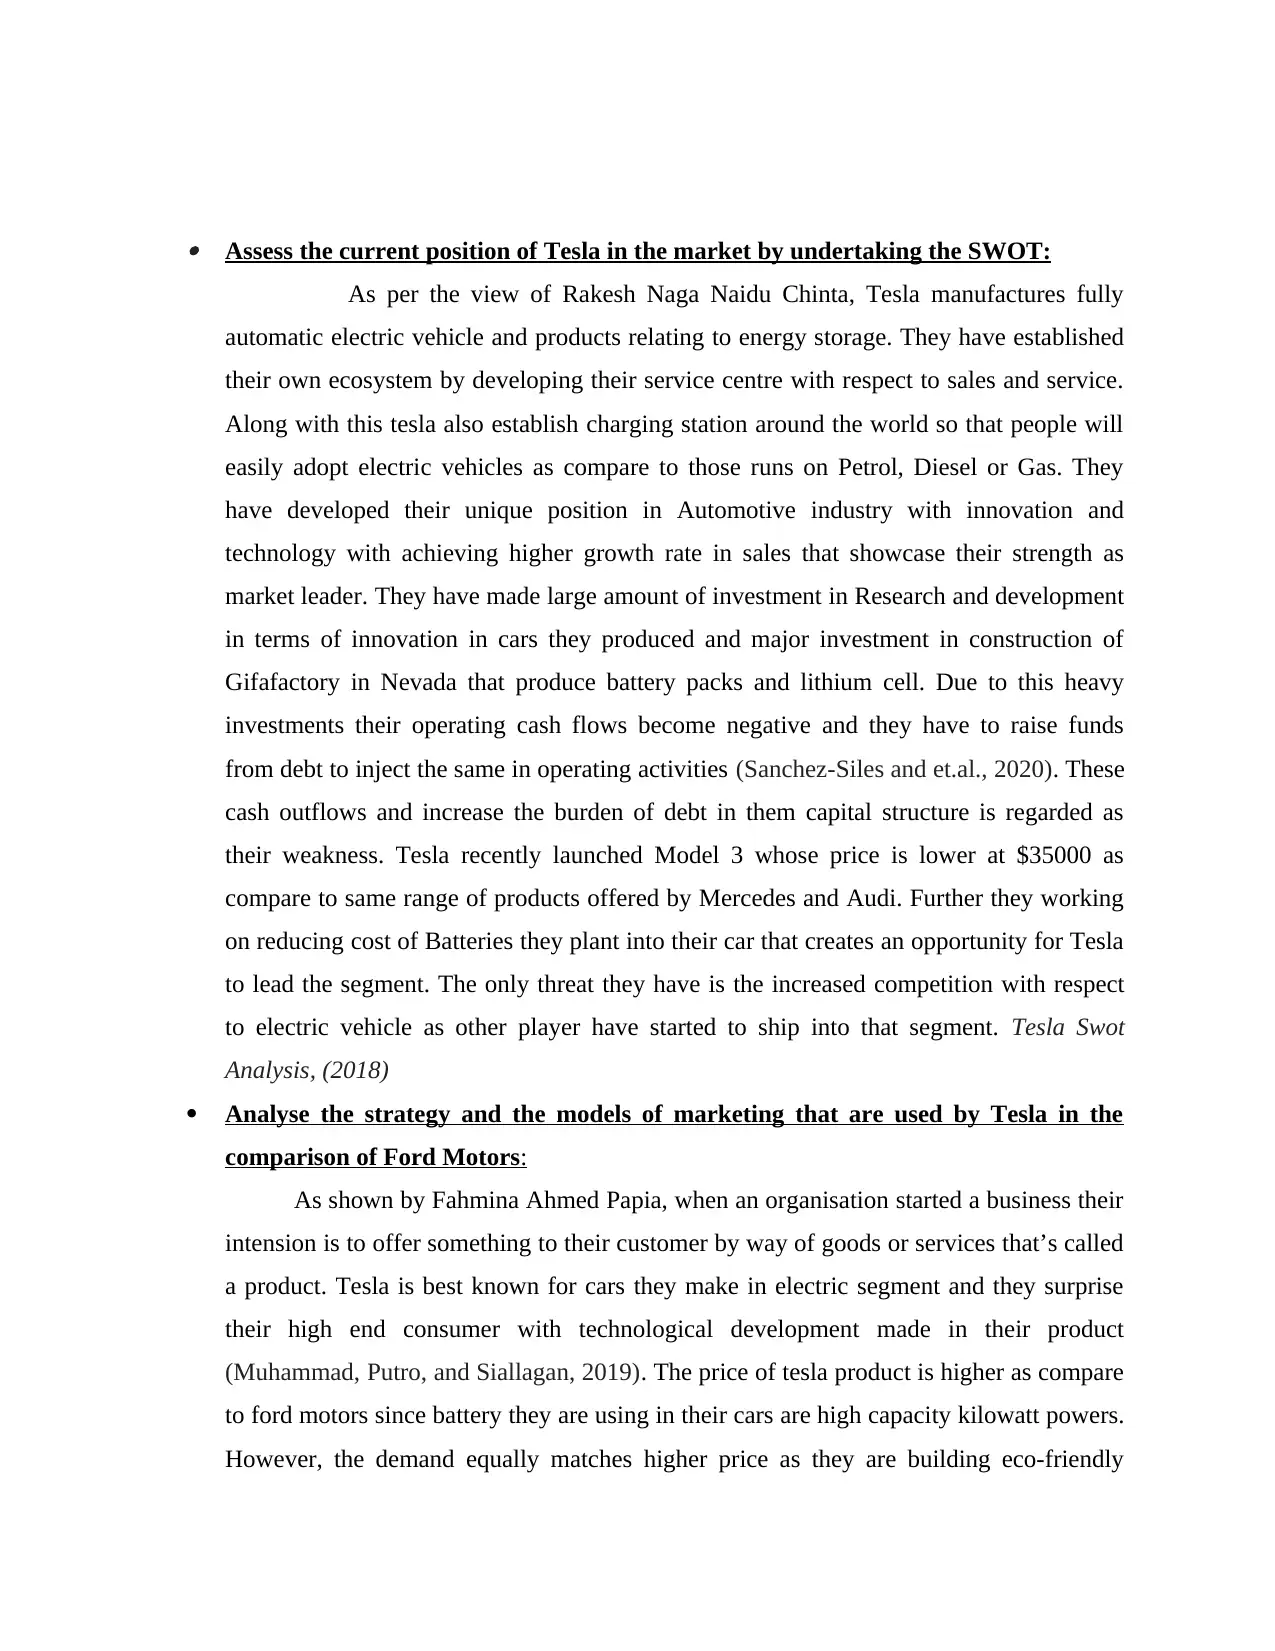
Assess the current position of Tesla in the market by undertaking the SWOT:
As per the view of Rakesh Naga Naidu Chinta, Tesla manufactures fully
automatic electric vehicle and products relating to energy storage. They have established
their own ecosystem by developing their service centre with respect to sales and service.
Along with this tesla also establish charging station around the world so that people will
easily adopt electric vehicles as compare to those runs on Petrol, Diesel or Gas. They
have developed their unique position in Automotive industry with innovation and
technology with achieving higher growth rate in sales that showcase their strength as
market leader. They have made large amount of investment in Research and development
in terms of innovation in cars they produced and major investment in construction of
Gifafactory in Nevada that produce battery packs and lithium cell. Due to this heavy
investments their operating cash flows become negative and they have to raise funds
from debt to inject the same in operating activities (Sanchez-Siles and et.al., 2020). These
cash outflows and increase the burden of debt in them capital structure is regarded as
their weakness. Tesla recently launched Model 3 whose price is lower at $35000 as
compare to same range of products offered by Mercedes and Audi. Further they working
on reducing cost of Batteries they plant into their car that creates an opportunity for Tesla
to lead the segment. The only threat they have is the increased competition with respect
to electric vehicle as other player have started to ship into that segment. Tesla Swot
Analysis, (2018)
Analyse the strategy and the models of marketing that are used by Tesla in the
comparison of Ford Motors:
As shown by Fahmina Ahmed Papia, when an organisation started a business their
intension is to offer something to their customer by way of goods or services that’s called
a product. Tesla is best known for cars they make in electric segment and they surprise
their high end consumer with technological development made in their product
(Muhammad, Putro, and Siallagan, 2019). The price of tesla product is higher as compare
to ford motors since battery they are using in their cars are high capacity kilowatt powers.
However, the demand equally matches higher price as they are building eco-friendly
Paraphrase This Document
Need a fresh take? Get an instant paraphrase of this document with our AI Paraphraser
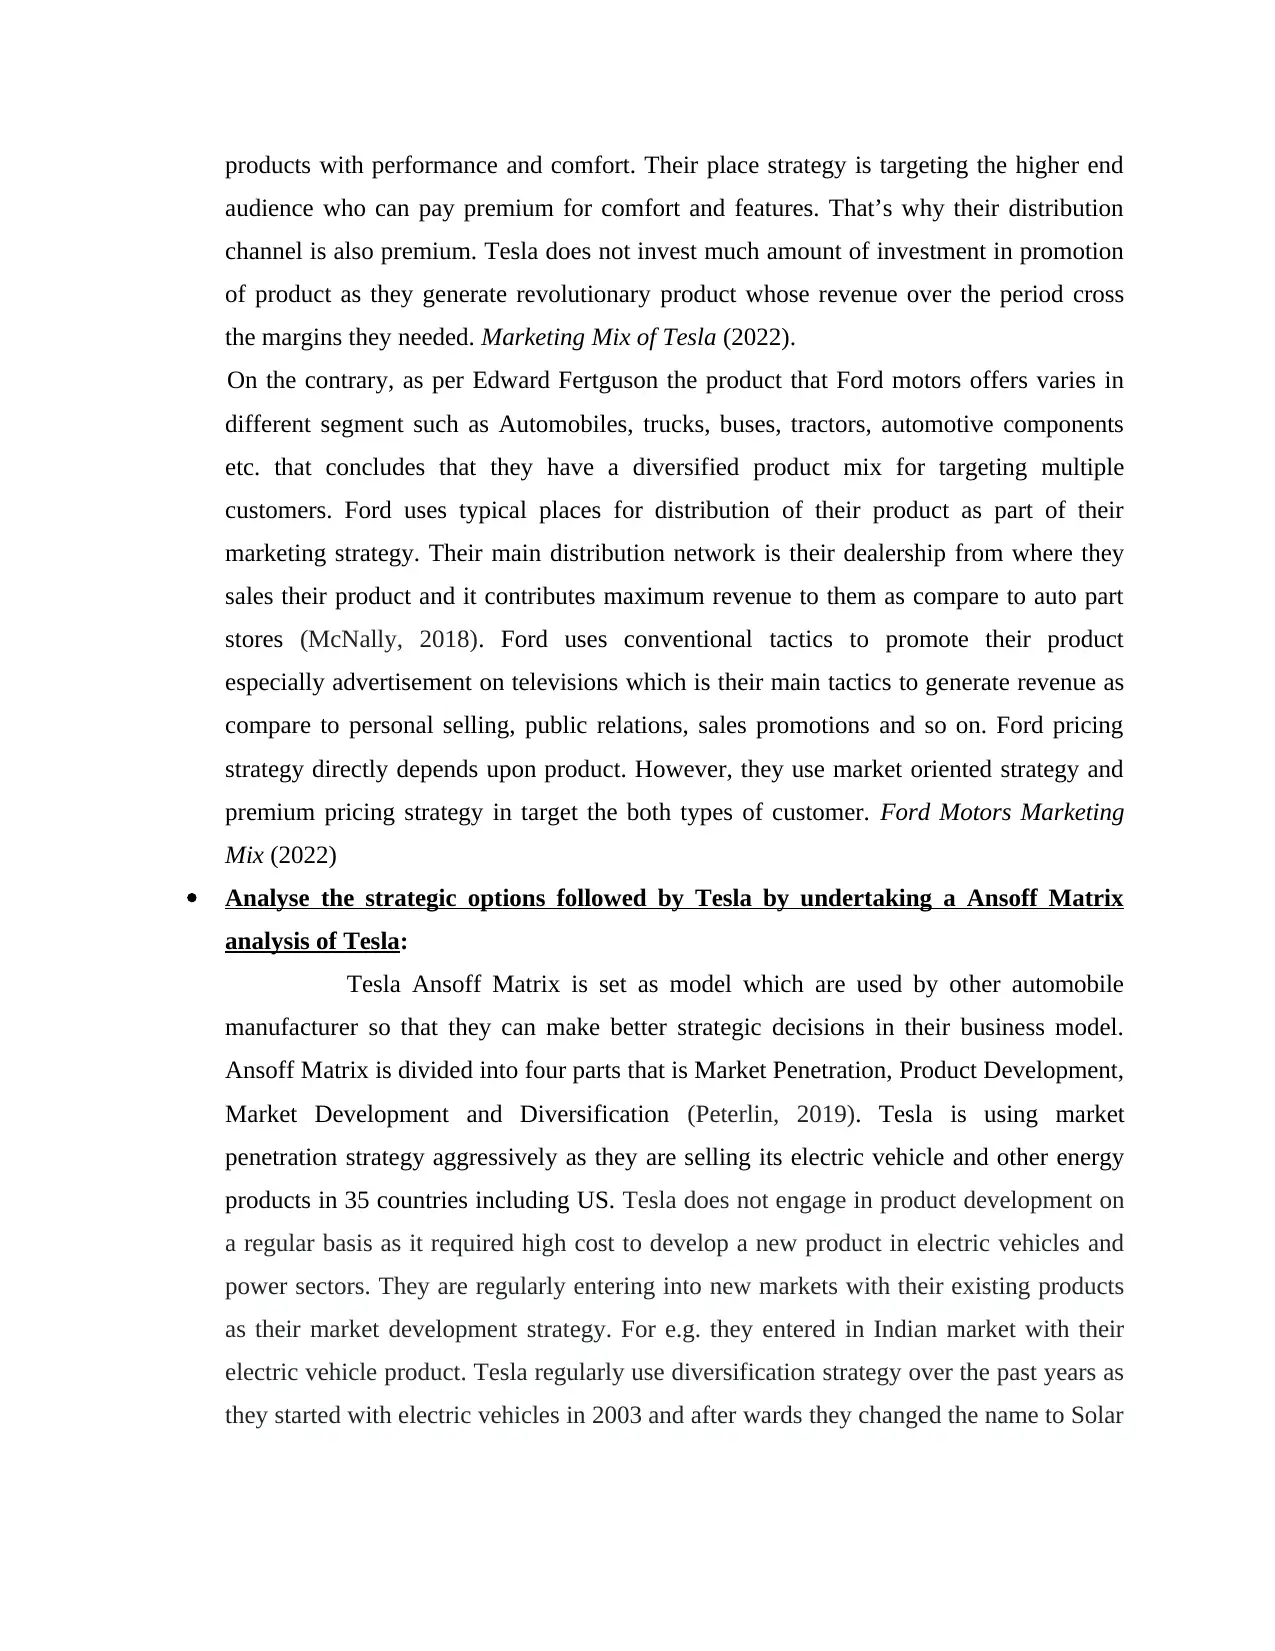
products with performance and comfort. Their place strategy is targeting the higher end
audience who can pay premium for comfort and features. That’s why their distribution
channel is also premium. Tesla does not invest much amount of investment in promotion
of product as they generate revolutionary product whose revenue over the period cross
the margins they needed. Marketing Mix of Tesla (2022).
On the contrary, as per Edward Fertguson the product that Ford motors offers varies in
different segment such as Automobiles, trucks, buses, tractors, automotive components
etc. that concludes that they have a diversified product mix for targeting multiple
customers. Ford uses typical places for distribution of their product as part of their
marketing strategy. Their main distribution network is their dealership from where they
sales their product and it contributes maximum revenue to them as compare to auto part
stores (McNally, 2018). Ford uses conventional tactics to promote their product
especially advertisement on televisions which is their main tactics to generate revenue as
compare to personal selling, public relations, sales promotions and so on. Ford pricing
strategy directly depends upon product. However, they use market oriented strategy and
premium pricing strategy in target the both types of customer. Ford Motors Marketing
Mix (2022)
Analyse the strategic options followed by Tesla by undertaking a Ansoff Matrix
analysis of Tesla:
Tesla Ansoff Matrix is set as model which are used by other automobile
manufacturer so that they can make better strategic decisions in their business model.
Ansoff Matrix is divided into four parts that is Market Penetration, Product Development,
Market Development and Diversification (Peterlin, 2019). Tesla is using market
penetration strategy aggressively as they are selling its electric vehicle and other energy
products in 35 countries including US. Tesla does not engage in product development on
a regular basis as it required high cost to develop a new product in electric vehicles and
power sectors. They are regularly entering into new markets with their existing products
as their market development strategy. For e.g. they entered in Indian market with their
electric vehicle product. Tesla regularly use diversification strategy over the past years as
they started with electric vehicles in 2003 and after wards they changed the name to Solar
city in place of Tesla motors so that they can inter into energy sector. Tesla Ansoff Matrix
(2021)
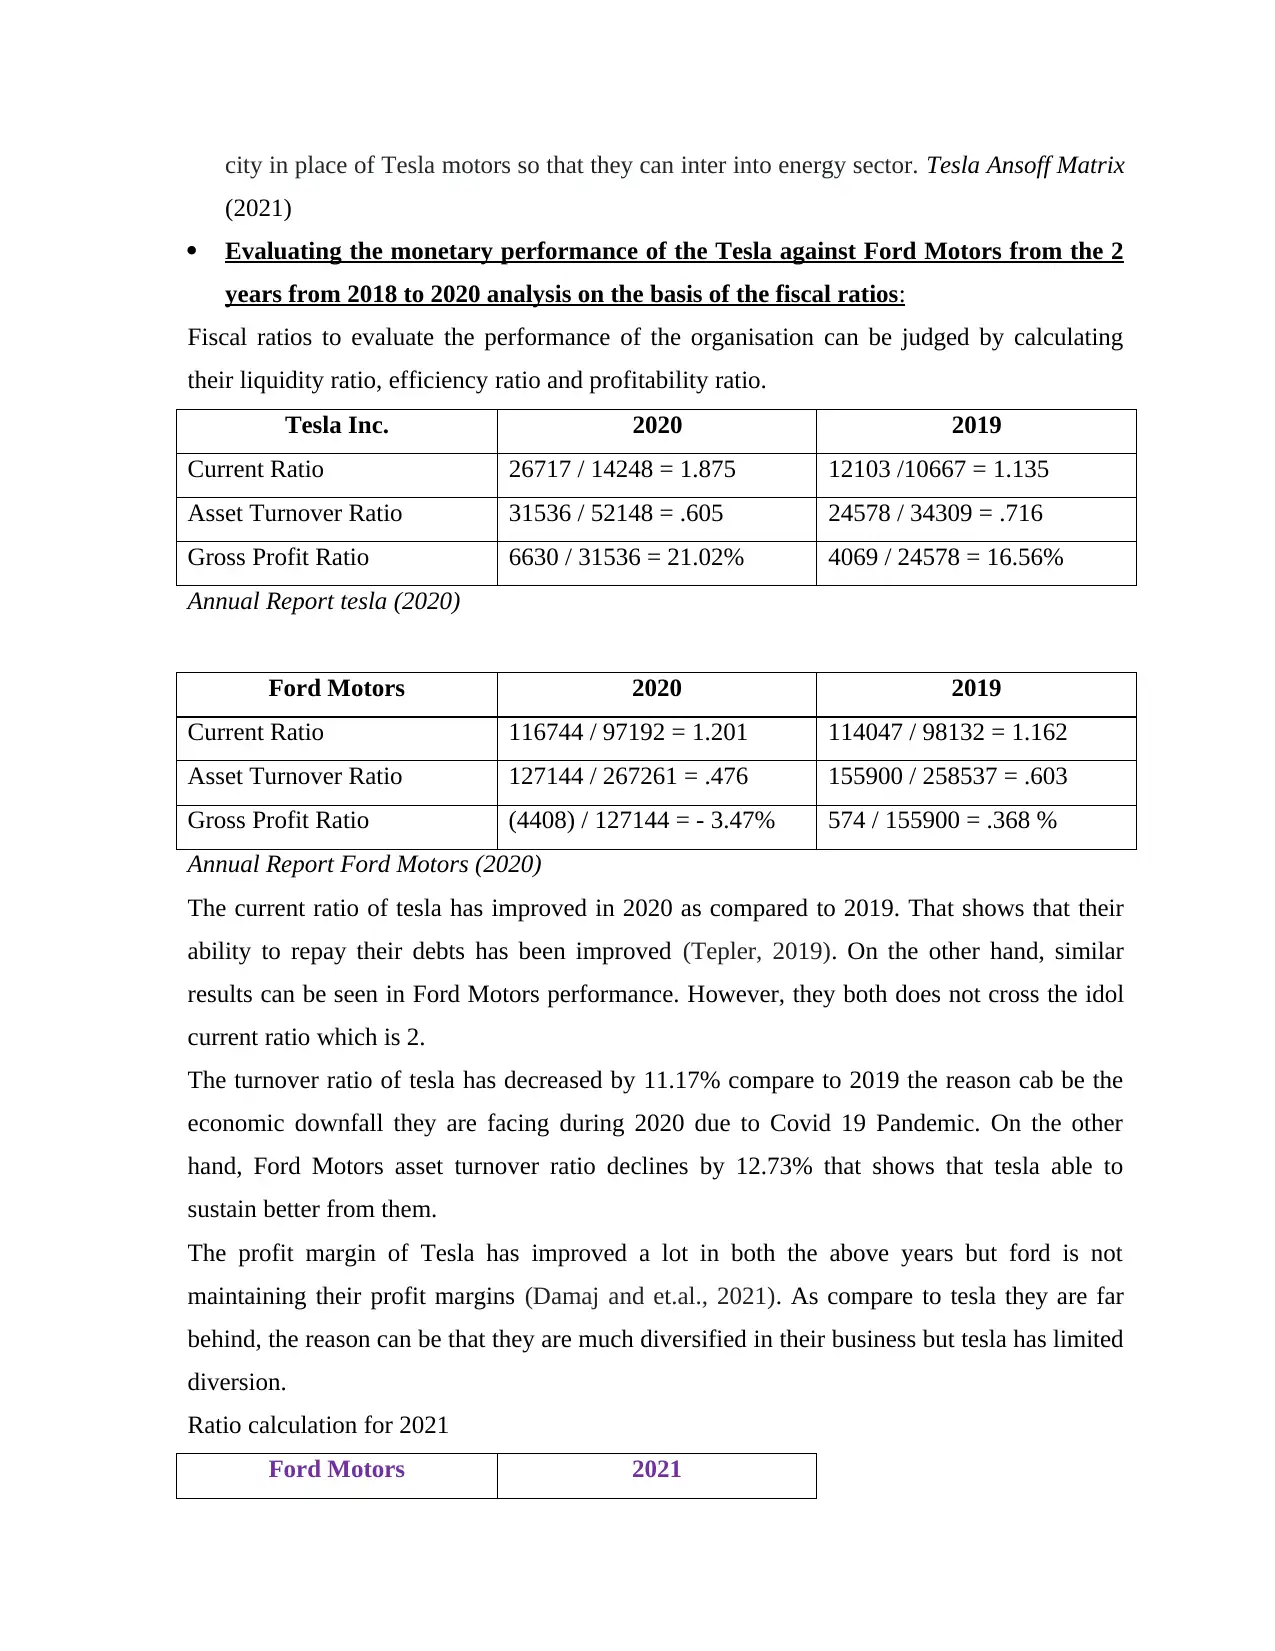
Evaluating the monetary performance of the Tesla against Ford Motors from the 2
years from 2018 to 2020 analysis on the basis of the fiscal ratios:
Fiscal ratios to evaluate the performance of the organisation can be judged by calculating
their liquidity ratio, efficiency ratio and profitability ratio.
Tesla Inc. 2020 2019
Current Ratio 26717 / 14248 = 1.875 12103 /10667 = 1.135
Asset Turnover Ratio 31536 / 52148 = .605 24578 / 34309 = .716
Gross Profit Ratio 6630 / 31536 = 21.02% 4069 / 24578 = 16.56%
Annual Report tesla (2020)
Ford Motors 2020 2019
Current Ratio 116744 / 97192 = 1.201 114047 / 98132 = 1.162
Asset Turnover Ratio 127144 / 267261 = .476 155900 / 258537 = .603
Gross Profit Ratio (4408) / 127144 = - 3.47% 574 / 155900 = .368 %
Annual Report Ford Motors (2020)
The current ratio of tesla has improved in 2020 as compared to 2019. That shows that their
ability to repay their debts has been improved (Tepler, 2019). On the other hand, similar
results can be seen in Ford Motors performance. However, they both does not cross the idol
current ratio which is 2.
The turnover ratio of tesla has decreased by 11.17% compare to 2019 the reason cab be the
economic downfall they are facing during 2020 due to Covid 19 Pandemic. On the other
hand, Ford Motors asset turnover ratio declines by 12.73% that shows that tesla able to
sustain better from them.
The profit margin of Tesla has improved a lot in both the above years but ford is not
maintaining their profit margins (Damaj and et.al., 2021). As compare to tesla they are far
behind, the reason can be that they are much diversified in their business but tesla has limited
diversion.
Ratio calculation for 2021
Ford Motors 2021
(2021)
Evaluating the monetary performance of the Tesla against Ford Motors from the 2
years from 2018 to 2020 analysis on the basis of the fiscal ratios:
Fiscal ratios to evaluate the performance of the organisation can be judged by calculating
their liquidity ratio, efficiency ratio and profitability ratio.
Tesla Inc. 2020 2019
Current Ratio 26717 / 14248 = 1.875 12103 /10667 = 1.135
Asset Turnover Ratio 31536 / 52148 = .605 24578 / 34309 = .716
Gross Profit Ratio 6630 / 31536 = 21.02% 4069 / 24578 = 16.56%
Annual Report tesla (2020)
Ford Motors 2020 2019
Current Ratio 116744 / 97192 = 1.201 114047 / 98132 = 1.162
Asset Turnover Ratio 127144 / 267261 = .476 155900 / 258537 = .603
Gross Profit Ratio (4408) / 127144 = - 3.47% 574 / 155900 = .368 %
Annual Report Ford Motors (2020)
The current ratio of tesla has improved in 2020 as compared to 2019. That shows that their
ability to repay their debts has been improved (Tepler, 2019). On the other hand, similar
results can be seen in Ford Motors performance. However, they both does not cross the idol
current ratio which is 2.
The turnover ratio of tesla has decreased by 11.17% compare to 2019 the reason cab be the
economic downfall they are facing during 2020 due to Covid 19 Pandemic. On the other
hand, Ford Motors asset turnover ratio declines by 12.73% that shows that tesla able to
sustain better from them.
The profit margin of Tesla has improved a lot in both the above years but ford is not
maintaining their profit margins (Damaj and et.al., 2021). As compare to tesla they are far
behind, the reason can be that they are much diversified in their business but tesla has limited
diversion.
Ratio calculation for 2021
Ford Motors 2021
⊘ This is a preview!⊘
Do you want full access?
Subscribe today to unlock all pages.
Trusted by 1+ million students worldwide
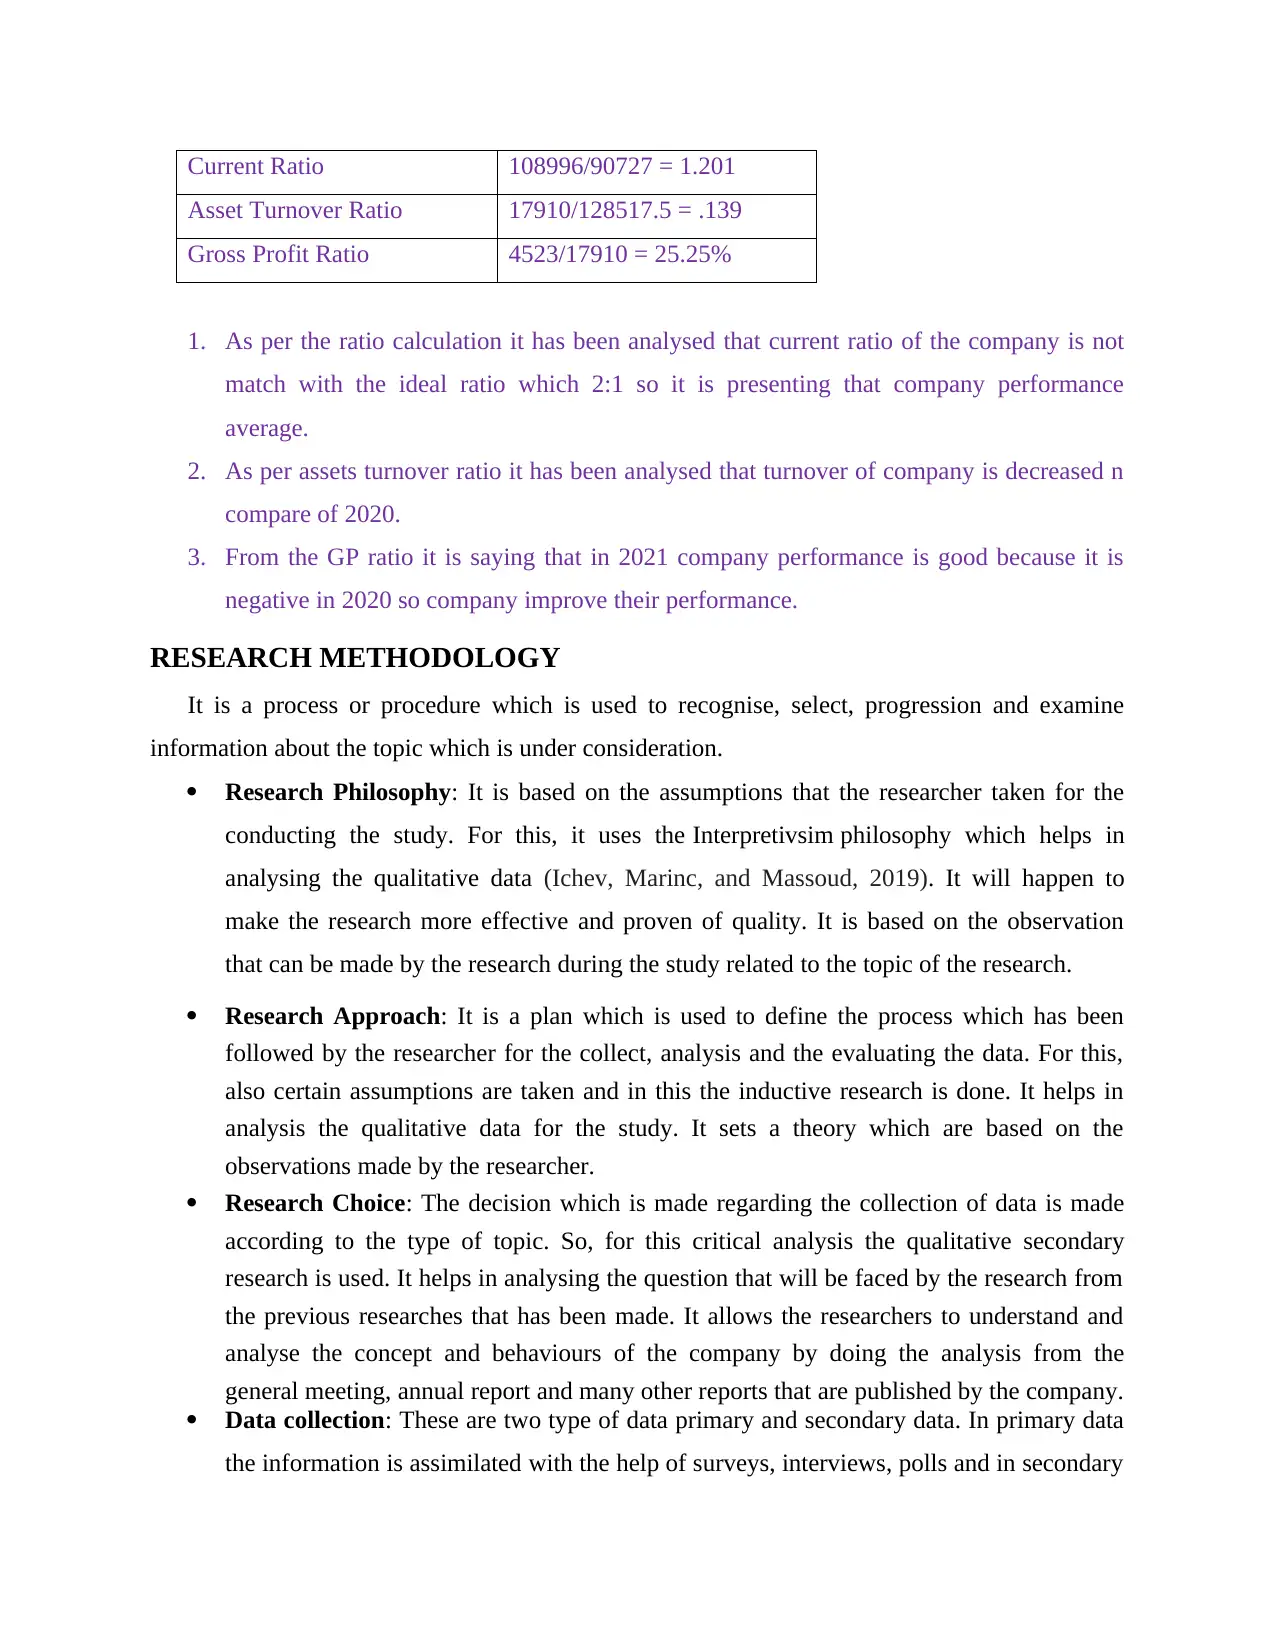
Current Ratio 108996/90727 = 1.201
Asset Turnover Ratio 17910/128517.5 = .139
Gross Profit Ratio 4523/17910 = 25.25%
1. As per the ratio calculation it has been analysed that current ratio of the company is not
match with the ideal ratio which 2:1 so it is presenting that company performance
average.
2. As per assets turnover ratio it has been analysed that turnover of company is decreased n
compare of 2020.
3. From the GP ratio it is saying that in 2021 company performance is good because it is
negative in 2020 so company improve their performance.
RESEARCH METHODOLOGY
It is a process or procedure which is used to recognise, select, progression and examine
information about the topic which is under consideration.
Research Philosophy: It is based on the assumptions that the researcher taken for the
conducting the study. For this, it uses the Interpretivsim philosophy which helps in
analysing the qualitative data (Ichev, Marinc, and Massoud, 2019). It will happen to
make the research more effective and proven of quality. It is based on the observation
that can be made by the research during the study related to the topic of the research.
Research Approach: It is a plan which is used to define the process which has been
followed by the researcher for the collect, analysis and the evaluating the data. For this,
also certain assumptions are taken and in this the inductive research is done. It helps in
analysis the qualitative data for the study. It sets a theory which are based on the
observations made by the researcher.
Research Choice: The decision which is made regarding the collection of data is made
according to the type of topic. So, for this critical analysis the qualitative secondary
research is used. It helps in analysing the question that will be faced by the research from
the previous researches that has been made. It allows the researchers to understand and
analyse the concept and behaviours of the company by doing the analysis from the
general meeting, annual report and many other reports that are published by the company.
Data collection: These are two type of data primary and secondary data. In primary data
the information is assimilated with the help of surveys, interviews, polls and in secondary
Paraphrase This Document
Need a fresh take? Get an instant paraphrase of this document with our AI Paraphraser
data it is done through the internet information based on the topic, sales reports and many
more (Loist, 2020). In this overall procedure that has been followed by the researchers is
included. As in this researcher, secondary research is used, so for this the qualitative data
will be collected. It will help in accumulating the data through the help of journal,
articles, documents published by the company and newspapers and many other aspects.
Research Instrument: For getting the data which is needed for conducting the study, the
research has to first collect the data from various sources such as newspapers, article,
case study and many more. In the type of qualitative research, the instrument that will
used is the observations, case study and the document analysis of the organisation. On the
basis of this, the research analysis is formulated. It helps in performance evaluation
which is a tool to appraise the research project.
Primary data: For the sole aim of resolving the author's study topic, primary data is information
that was created for the initial time by the investigator via personal efforts and expertise. usually
defined as raw data or first-hand information. Since the company or agency doing the study must
spend in resources like money and labour, collecting primary data is extremely costly. The
researcher is directly in charge of and overseeing the data collecting.
Advantage:
Primary data advantages from its validity, particular presence, and up-to-date data, but
secondary data is relatively inexpensive and time-consuming.
Primary data is particularly reliable because it is basically impartial and collected from
the source directly. In comparison to secondary information, this also gives up-to-date
information on a certain study subject.
Secondary day, on the other hand, is not expensive, allowing secondary education more
accessible for people. This doesn't take too long, and practically all secondary sources of
information are easily accessible for nothing.
Disadvantage: The drawback of primary data is the cost and effort involved in data collection,
while secondary data may be unreliable or unimportant. Primary data are expensive and time-
consuming because of the evident steps involved in doing primary research.
Secondary data: The term "secondary data" refers to information that has previously been
collected and stored from someone other than the consumer for a reason unrelated to the present
study issue. It is the easily accessible format of data gathered from a variety of resources,
including censuses, published material, firm ’s internal documents, reports, books, scientific
journals, blogs, and more.
Advantage:
In comparison to actual information, secondary data is more freely available. Secondary
data is readily available on several sites that the investigator can access.
Secondary data is fairly inexpensive. It costs almost nothing to obtain them since they are
occasionally handed free of charge.
Secondary data collection often takes far less time than initial data collection.
Disadvantage:
Secondary data might not be trustworthy and genuine. The information gathered from the
promote public may have to be additionally verified by the investigator.
When discovering the necessary data, investigators might have to handle with irrelevant
information.
Because of the information source's own bias, a portion of the information is overstated.
There may not always be updated published data to update secondary data sources.
ANALYSIS
SWOT
After analysing the annual report of Tesla Plc for the period 2019 and 2020, the Author has
identified certain key factor as explained in each category that determine the strategy of tesla.
Strength: The automobile sector expands on regular basis due to technological changes
taken place over the period of time from petrol, diesel car to batter made cars. Tesla has
recognised the need to serve their consumers with premium and luxury comfort they
wanted in today’s world (Metsälä, and Fridell, 2018). This will make them different from
their rivals as they are first mover in technological advancement from day 1. Overall, the
Author has viewed that targeting premium customer with premium electric cars are their
strength in the long run as they invest heavy in research and development to generate
different product.
Weakness: The Authors recognise that Tesla has invested hug amount of investment in
research and development due to which their operating cash flows has become negative.
On the other hand, ford motors develop their strategy according to need of market
⊘ This is a preview!⊘
Do you want full access?
Subscribe today to unlock all pages.
Trusted by 1+ million students worldwide
1 out of 25
Related Documents


Your All-in-One AI-Powered Toolkit for Academic Success.
+13062052269
info@desklib.com
Available 24*7 on WhatsApp / Email
![[object Object]](/_next/static/media/star-bottom.7253800d.svg)
Unlock your academic potential
Copyright © 2020–2026 A2Z Services. All Rights Reserved. Developed and managed by ZUCOL.