Detailed Investment Report: Tesla Inc. vs. General Motors Company
VerifiedAdded on 2021/01/02
|12
|3458
|351
Report
AI Summary
This investment report provides a comprehensive analysis of Tesla Inc. and General Motors (GM), examining their historical performance, current business activities, and future prospects. The report delves into the history and business operations of both companies, including their product lines, market positions, and key milestones. A detailed financial analysis is presented, focusing on revenues, profitability, investment strategies, and funding structures over a three-year period. Key financial ratios such as net profit margin, return on equity, return on assets, and interest coverage are calculated and compared to assess the financial health and performance of each company. Furthermore, the report identifies and evaluates the strengths, weaknesses, and potential issues facing both Tesla and GM, including market competition, technological advancements, and supply chain challenges. The report concludes with a comparative assessment, highlighting the fundamental differences between the two companies and offering a recommendation based on the investment potential of each. The report uses financial statements and market data to provide a clear comparison, making it a valuable resource for students studying finance and investment analysis.
INVESTMENT
REPORT
TESLA OR GM
REPORT
TESLA OR GM
Paraphrase This Document
Need a fresh take? Get an instant paraphrase of this document with our AI Paraphraser
Table of Contents
INTRODUCTION...........................................................................................................................1
MAIN BODY...................................................................................................................................1
1. History and business activities of GM and Tesla...............................................................1
2. Historical accounts, focusing upon revenues, profitability, investment and funding structure
................................................................................................................................................2
3. Future expectations, business strengths, weaknesses, issues and the fundamental differences
between two companies..........................................................................................................4
4. Recommendation................................................................................................................8
CONCLUSION................................................................................................................................9
REFRENCES.................................................................................................................................10
INTRODUCTION
Investments reports is a fair representation of the successful investment, results getting,
risk taken and cost obtain (Alfaro and Charlton, 2013) . It is applicable and suitable for the
purpose declared and the assets and investment strategies being presented. In the context taken
company Tesla and General motors. Tesla is an American energy and automotive company, it is
specialize to manufacturing Solar panel and electric car. General motors is an American
multinational business firm that create designs, markets, production and distributes vehicle and
vehicle parts. In the report covers history, business activities of both companies. Analysis
historical accounts at least 3 years after that focusing on profitability. Identify business strength
and weaknesses, issues and fundamental differences.
MAIN BODY
1. History and business activities of GM and Tesla
TESLA INC.
It is according to (2003-17), American electric auto-mobile industry. It was established in
2003 by American entrepreneurs Martin Eberhard and Marc Tarpenning. After some time named
was after Serbian American investor Nikola Tesla. Tesla motors was defined to create an electric
sports car. The company provide funding from several resources like pay pal co-founder Elon
Musk, who invested more than $30 million to the new venture and served as chairman of the
company, beginning in 2004.
By Tesla inc. conducted business activities that they are mainly focused on
manufacturing
General Motors
It was established in 1908 by William Billy Durant, who produced horse drawn vehicles
in starting. General motors in starting only posses the Buick motor company but after some time
it was adopted more than twenty other companies such as old mobile, Cadillac, Oakland but
today known as Pontiac – Germany's Opel, Chevrolet and Vauxhall. The company is the largest
American auto-mobile manufacturer, and one of the world's largest (Cleeve, 2012).
Business activities are conducted by general motors is design, production, distribute
vehicles, markets and vehicles parts, and sold out financial services with global headquarters in
Detroit Renaissance centre.
1
⊘ This is a preview!⊘
Do you want full access?
Subscribe today to unlock all pages.
Trusted by 1+ million students worldwide
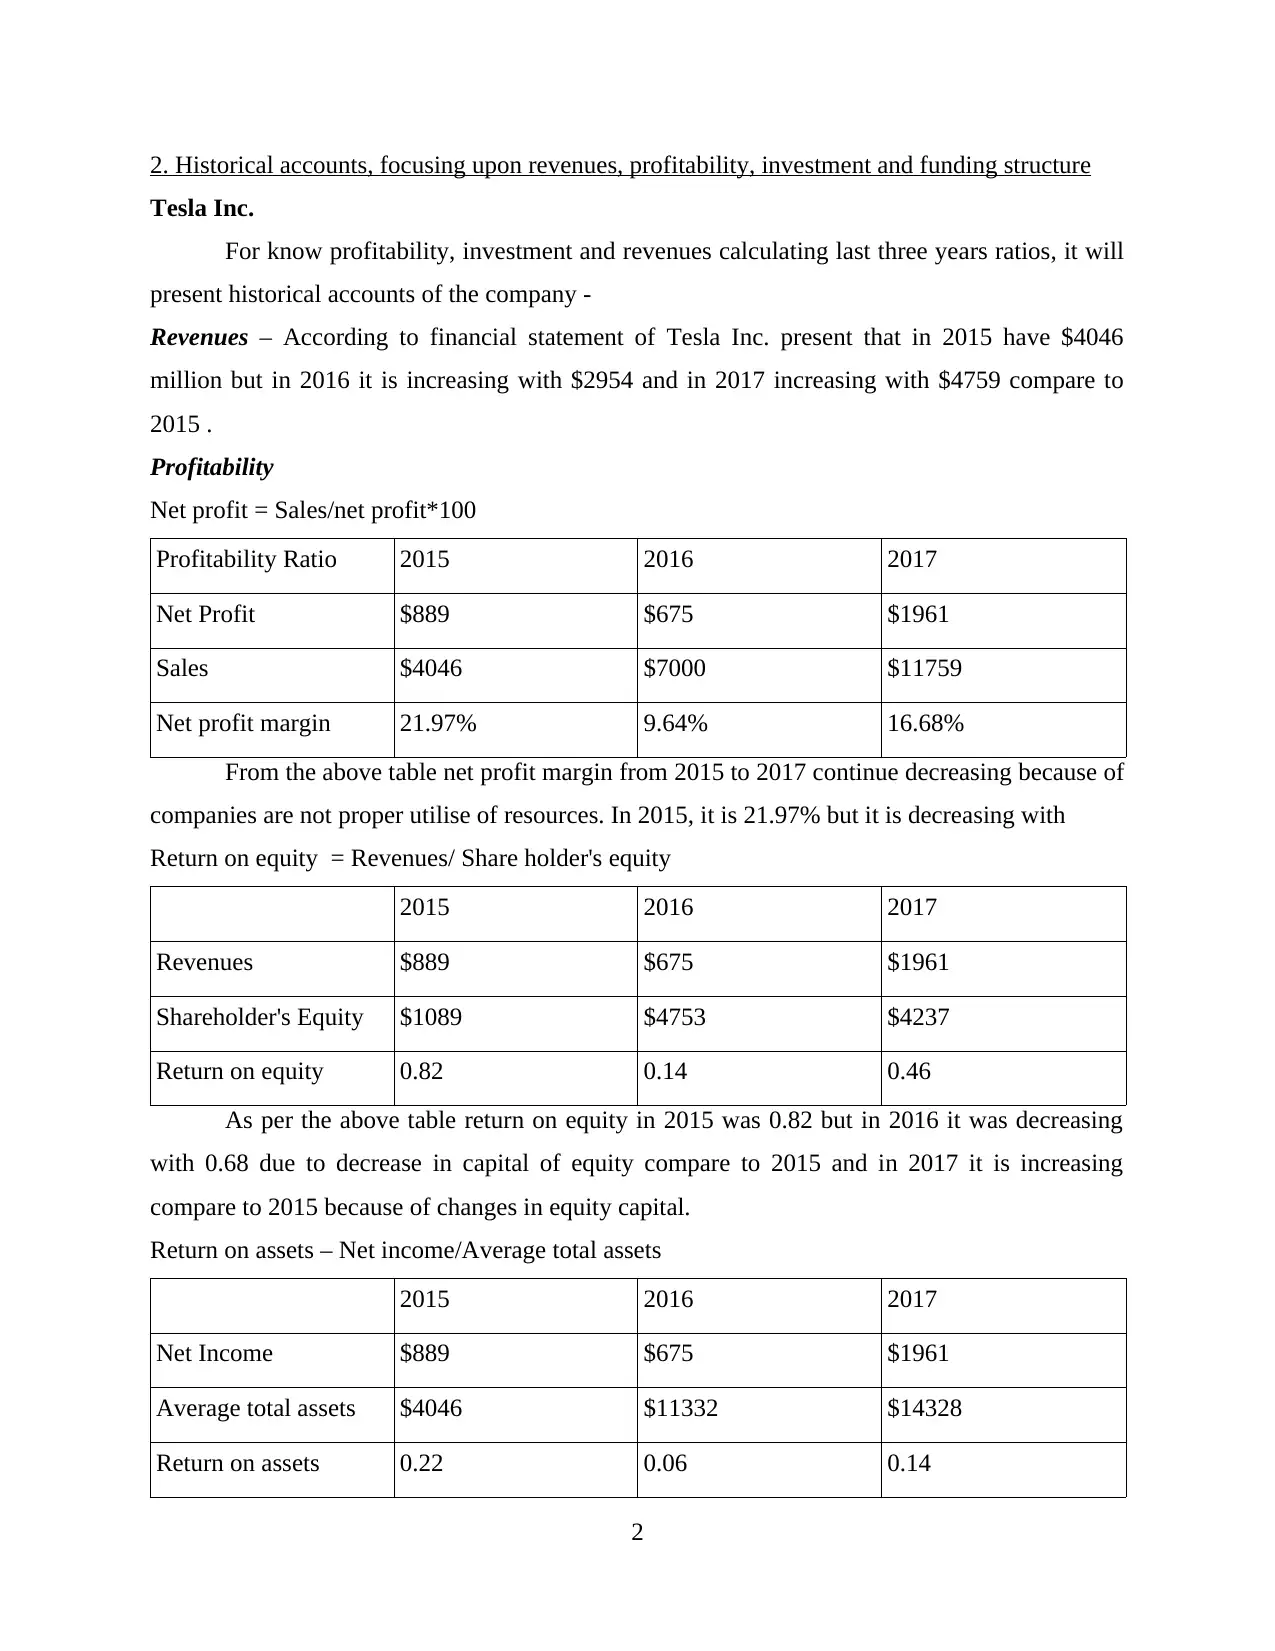
2. Historical accounts, focusing upon revenues, profitability, investment and funding structure
Tesla Inc.
For know profitability, investment and revenues calculating last three years ratios, it will
present historical accounts of the company -
Revenues – According to financial statement of Tesla Inc. present that in 2015 have $4046
million but in 2016 it is increasing with $2954 and in 2017 increasing with $4759 compare to
2015 .
Profitability
Net profit = Sales/net profit*100
Profitability Ratio 2015 2016 2017
Net Profit $889 $675 $1961
Sales $4046 $7000 $11759
Net profit margin 21.97% 9.64% 16.68%
From the above table net profit margin from 2015 to 2017 continue decreasing because of
companies are not proper utilise of resources. In 2015, it is 21.97% but it is decreasing with
Return on equity = Revenues/ Share holder's equity
2015 2016 2017
Revenues $889 $675 $1961
Shareholder's Equity $1089 $4753 $4237
Return on equity 0.82 0.14 0.46
As per the above table return on equity in 2015 was 0.82 but in 2016 it was decreasing
with 0.68 due to decrease in capital of equity compare to 2015 and in 2017 it is increasing
compare to 2015 because of changes in equity capital.
Return on assets – Net income/Average total assets
2015 2016 2017
Net Income $889 $675 $1961
Average total assets $4046 $11332 $14328
Return on assets 0.22 0.06 0.14
2
Paraphrase This Document
Need a fresh take? Get an instant paraphrase of this document with our AI Paraphraser
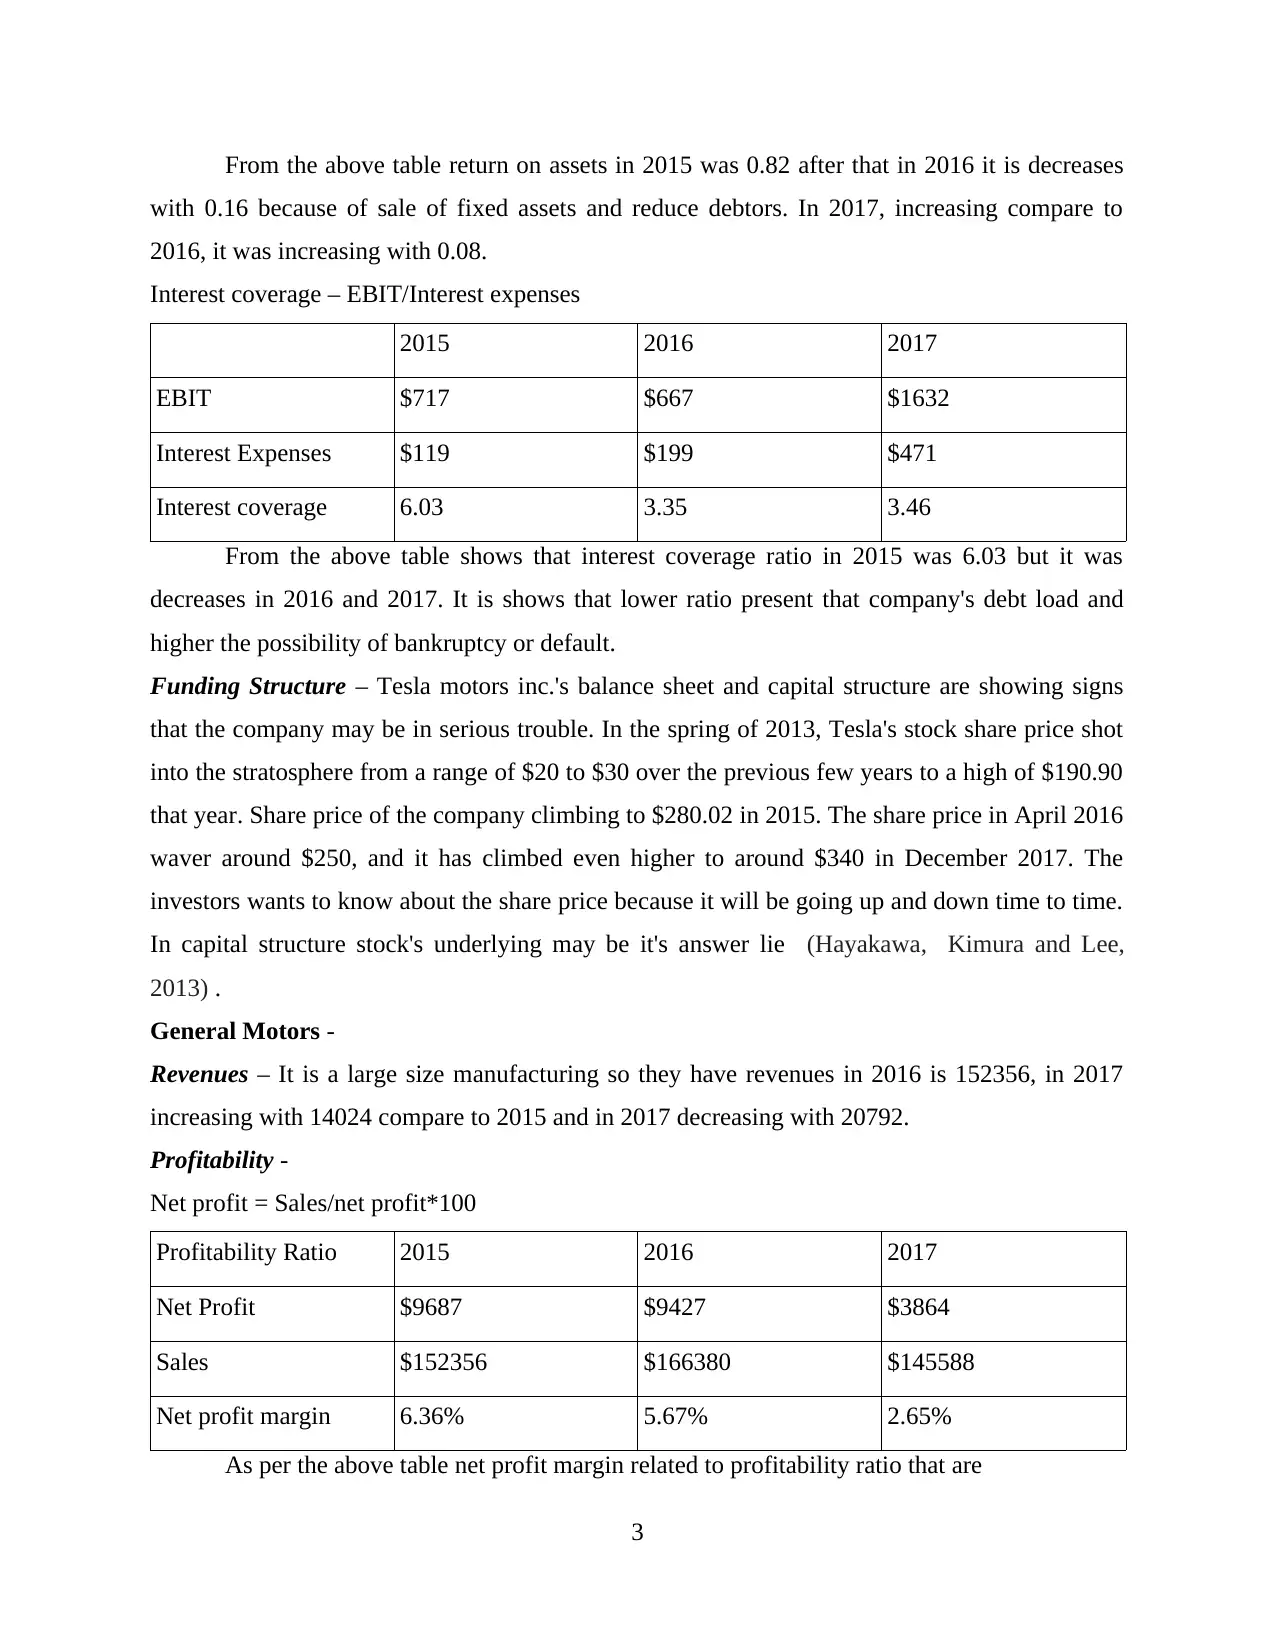
From the above table return on assets in 2015 was 0.82 after that in 2016 it is decreases
with 0.16 because of sale of fixed assets and reduce debtors. In 2017, increasing compare to
2016, it was increasing with 0.08.
Interest coverage – EBIT/Interest expenses
2015 2016 2017
EBIT $717 $667 $1632
Interest Expenses $119 $199 $471
Interest coverage 6.03 3.35 3.46
From the above table shows that interest coverage ratio in 2015 was 6.03 but it was
decreases in 2016 and 2017. It is shows that lower ratio present that company's debt load and
higher the possibility of bankruptcy or default.
Funding Structure – Tesla motors inc.'s balance sheet and capital structure are showing signs
that the company may be in serious trouble. In the spring of 2013, Tesla's stock share price shot
into the stratosphere from a range of $20 to $30 over the previous few years to a high of $190.90
that year. Share price of the company climbing to $280.02 in 2015. The share price in April 2016
waver around $250, and it has climbed even higher to around $340 in December 2017. The
investors wants to know about the share price because it will be going up and down time to time.
In capital structure stock's underlying may be it's answer lie (Hayakawa, Kimura and Lee,
2013) .
General Motors -
Revenues – It is a large size manufacturing so they have revenues in 2016 is 152356, in 2017
increasing with 14024 compare to 2015 and in 2017 decreasing with 20792.
Profitability -
Net profit = Sales/net profit*100
Profitability Ratio 2015 2016 2017
Net Profit $9687 $9427 $3864
Sales $152356 $166380 $145588
Net profit margin 6.36% 5.67% 2.65%
As per the above table net profit margin related to profitability ratio that are
3
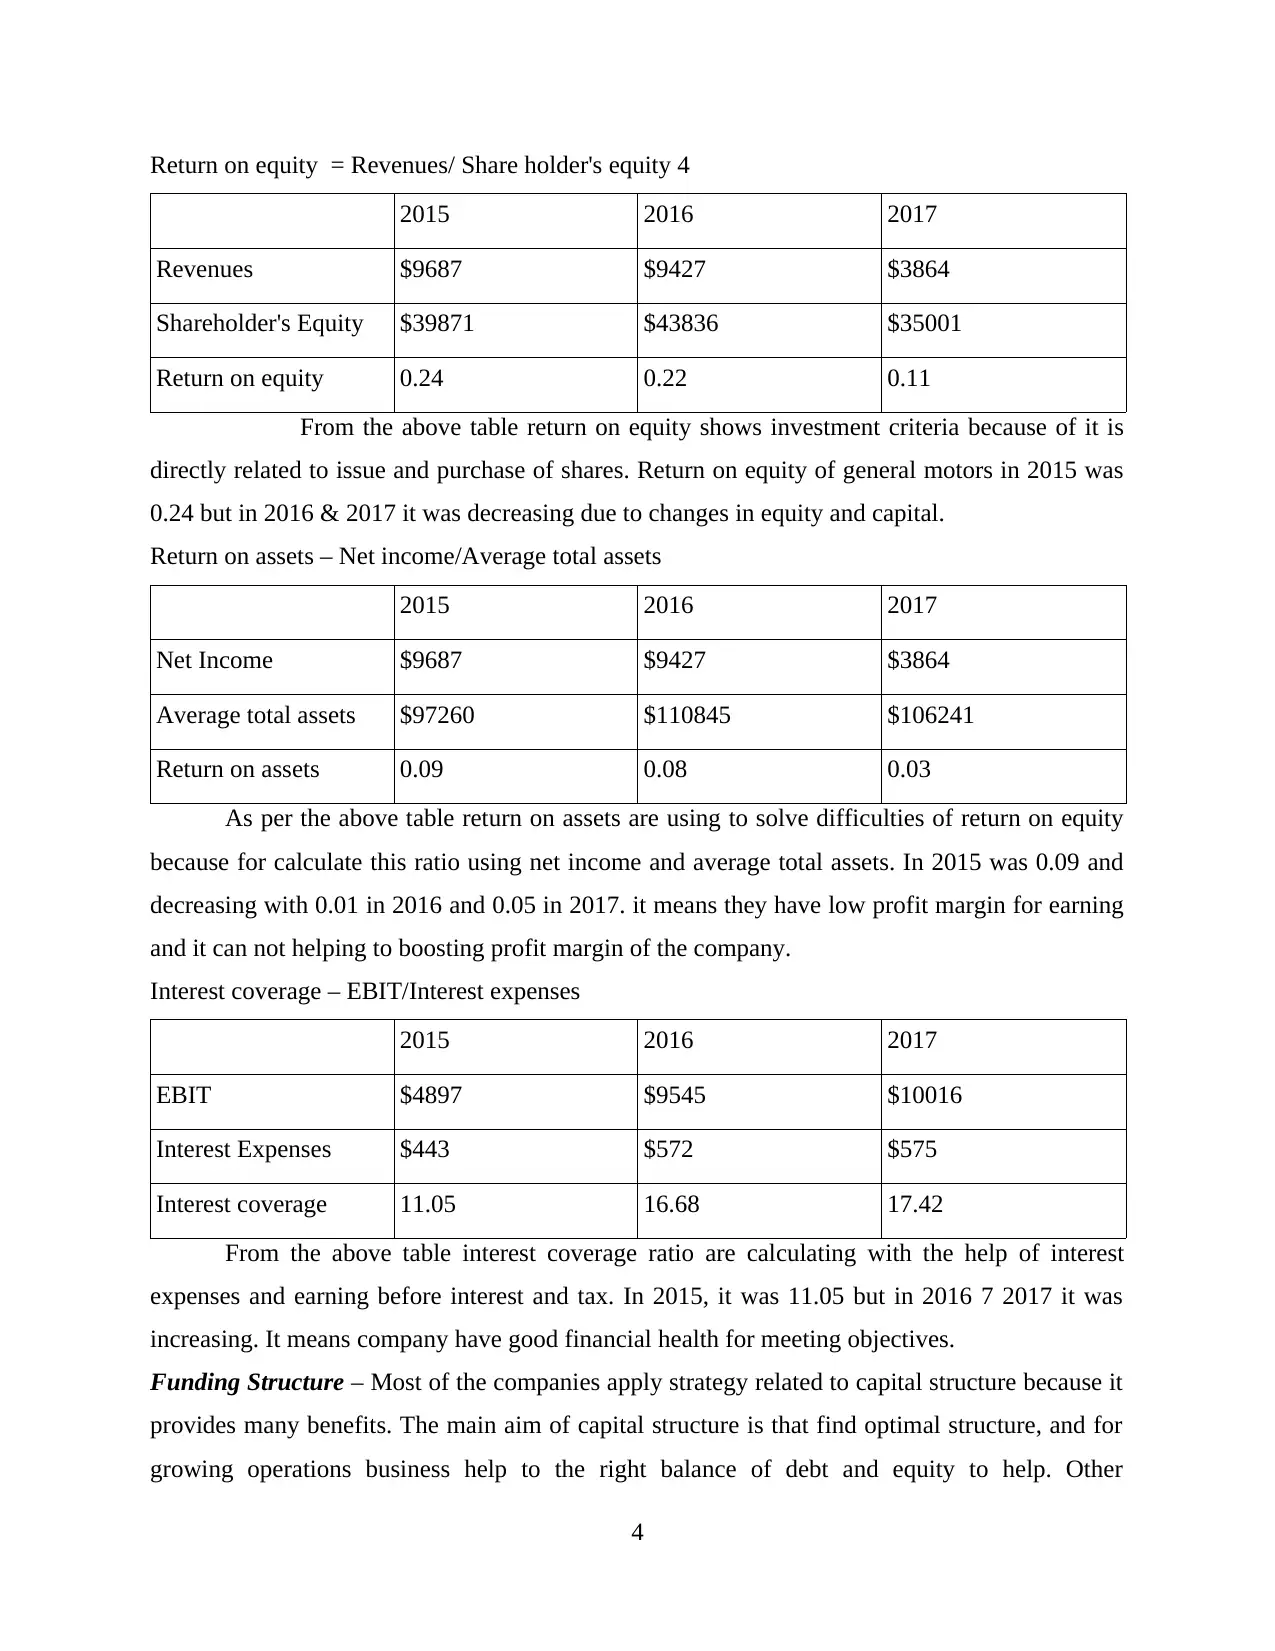
Return on equity = Revenues/ Share holder's equity 4
2015 2016 2017
Revenues $9687 $9427 $3864
Shareholder's Equity $39871 $43836 $35001
Return on equity 0.24 0.22 0.11
From the above table return on equity shows investment criteria because of it is
directly related to issue and purchase of shares. Return on equity of general motors in 2015 was
0.24 but in 2016 & 2017 it was decreasing due to changes in equity and capital.
Return on assets – Net income/Average total assets
2015 2016 2017
Net Income $9687 $9427 $3864
Average total assets $97260 $110845 $106241
Return on assets 0.09 0.08 0.03
As per the above table return on assets are using to solve difficulties of return on equity
because for calculate this ratio using net income and average total assets. In 2015 was 0.09 and
decreasing with 0.01 in 2016 and 0.05 in 2017. it means they have low profit margin for earning
and it can not helping to boosting profit margin of the company.
Interest coverage – EBIT/Interest expenses
2015 2016 2017
EBIT $4897 $9545 $10016
Interest Expenses $443 $572 $575
Interest coverage 11.05 16.68 17.42
From the above table interest coverage ratio are calculating with the help of interest
expenses and earning before interest and tax. In 2015, it was 11.05 but in 2016 7 2017 it was
increasing. It means company have good financial health for meeting objectives.
Funding Structure – Most of the companies apply strategy related to capital structure because it
provides many benefits. The main aim of capital structure is that find optimal structure, and for
growing operations business help to the right balance of debt and equity to help. Other
4
2015 2016 2017
Revenues $9687 $9427 $3864
Shareholder's Equity $39871 $43836 $35001
Return on equity 0.24 0.22 0.11
From the above table return on equity shows investment criteria because of it is
directly related to issue and purchase of shares. Return on equity of general motors in 2015 was
0.24 but in 2016 & 2017 it was decreasing due to changes in equity and capital.
Return on assets – Net income/Average total assets
2015 2016 2017
Net Income $9687 $9427 $3864
Average total assets $97260 $110845 $106241
Return on assets 0.09 0.08 0.03
As per the above table return on assets are using to solve difficulties of return on equity
because for calculate this ratio using net income and average total assets. In 2015 was 0.09 and
decreasing with 0.01 in 2016 and 0.05 in 2017. it means they have low profit margin for earning
and it can not helping to boosting profit margin of the company.
Interest coverage – EBIT/Interest expenses
2015 2016 2017
EBIT $4897 $9545 $10016
Interest Expenses $443 $572 $575
Interest coverage 11.05 16.68 17.42
From the above table interest coverage ratio are calculating with the help of interest
expenses and earning before interest and tax. In 2015, it was 11.05 but in 2016 7 2017 it was
increasing. It means company have good financial health for meeting objectives.
Funding Structure – Most of the companies apply strategy related to capital structure because it
provides many benefits. The main aim of capital structure is that find optimal structure, and for
growing operations business help to the right balance of debt and equity to help. Other
4
⊘ This is a preview!⊘
Do you want full access?
Subscribe today to unlock all pages.
Trusted by 1+ million students worldwide
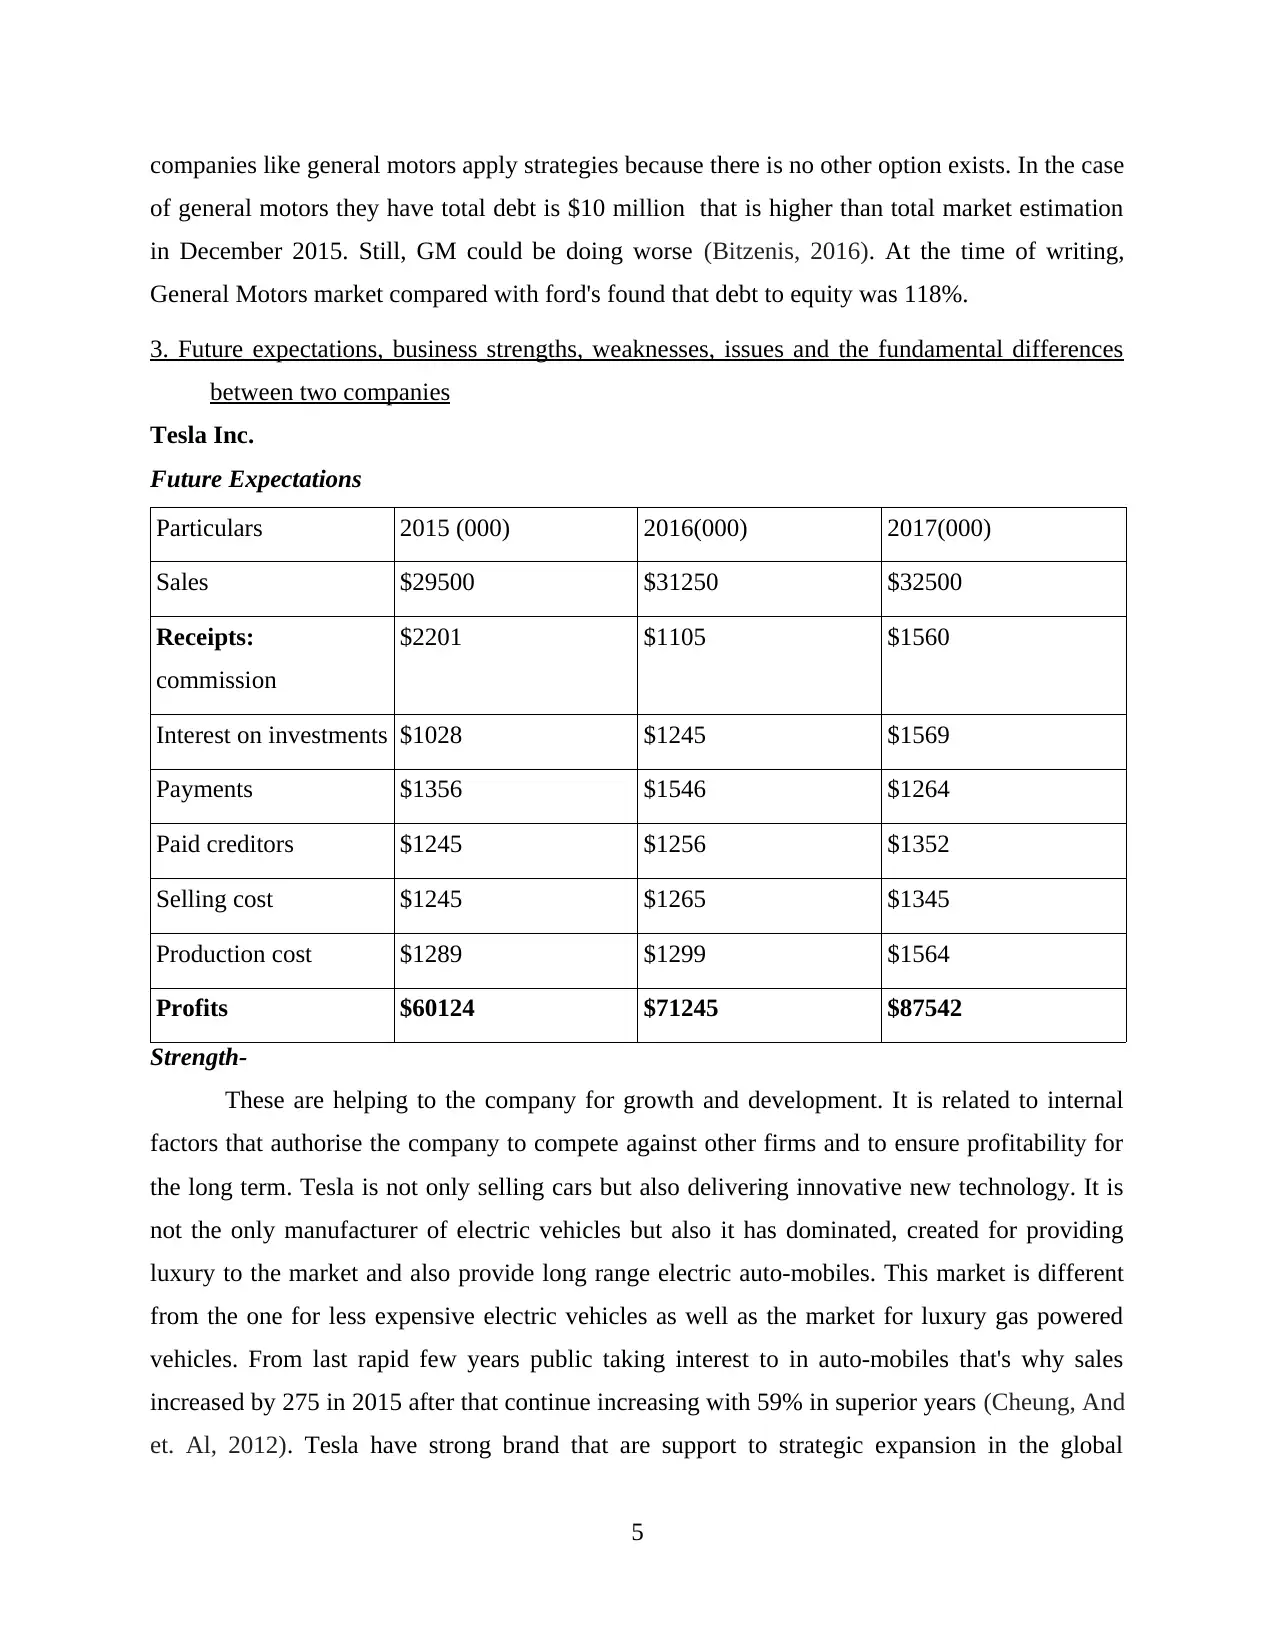
companies like general motors apply strategies because there is no other option exists. In the case
of general motors they have total debt is $10 million that is higher than total market estimation
in December 2015. Still, GM could be doing worse (Bitzenis, 2016). At the time of writing,
General Motors market compared with ford's found that debt to equity was 118%.
3. Future expectations, business strengths, weaknesses, issues and the fundamental differences
between two companies
Tesla Inc.
Future Expectations
Particulars 2015 (000) 2016(000) 2017(000)
Sales $29500 $31250 $32500
Receipts:
commission
$2201 $1105 $1560
Interest on investments $1028 $1245 $1569
Payments $1356 $1546 $1264
Paid creditors $1245 $1256 $1352
Selling cost $1245 $1265 $1345
Production cost $1289 $1299 $1564
Profits $60124 $71245 $87542
Strength-
These are helping to the company for growth and development. It is related to internal
factors that authorise the company to compete against other firms and to ensure profitability for
the long term. Tesla is not only selling cars but also delivering innovative new technology. It is
not the only manufacturer of electric vehicles but also it has dominated, created for providing
luxury to the market and also provide long range electric auto-mobiles. This market is different
from the one for less expensive electric vehicles as well as the market for luxury gas powered
vehicles. From last rapid few years public taking interest to in auto-mobiles that's why sales
increased by 275 in 2015 after that continue increasing with 59% in superior years (Cheung, And
et. Al, 2012). Tesla have strong brand that are support to strategic expansion in the global
5
Paraphrase This Document
Need a fresh take? Get an instant paraphrase of this document with our AI Paraphraser
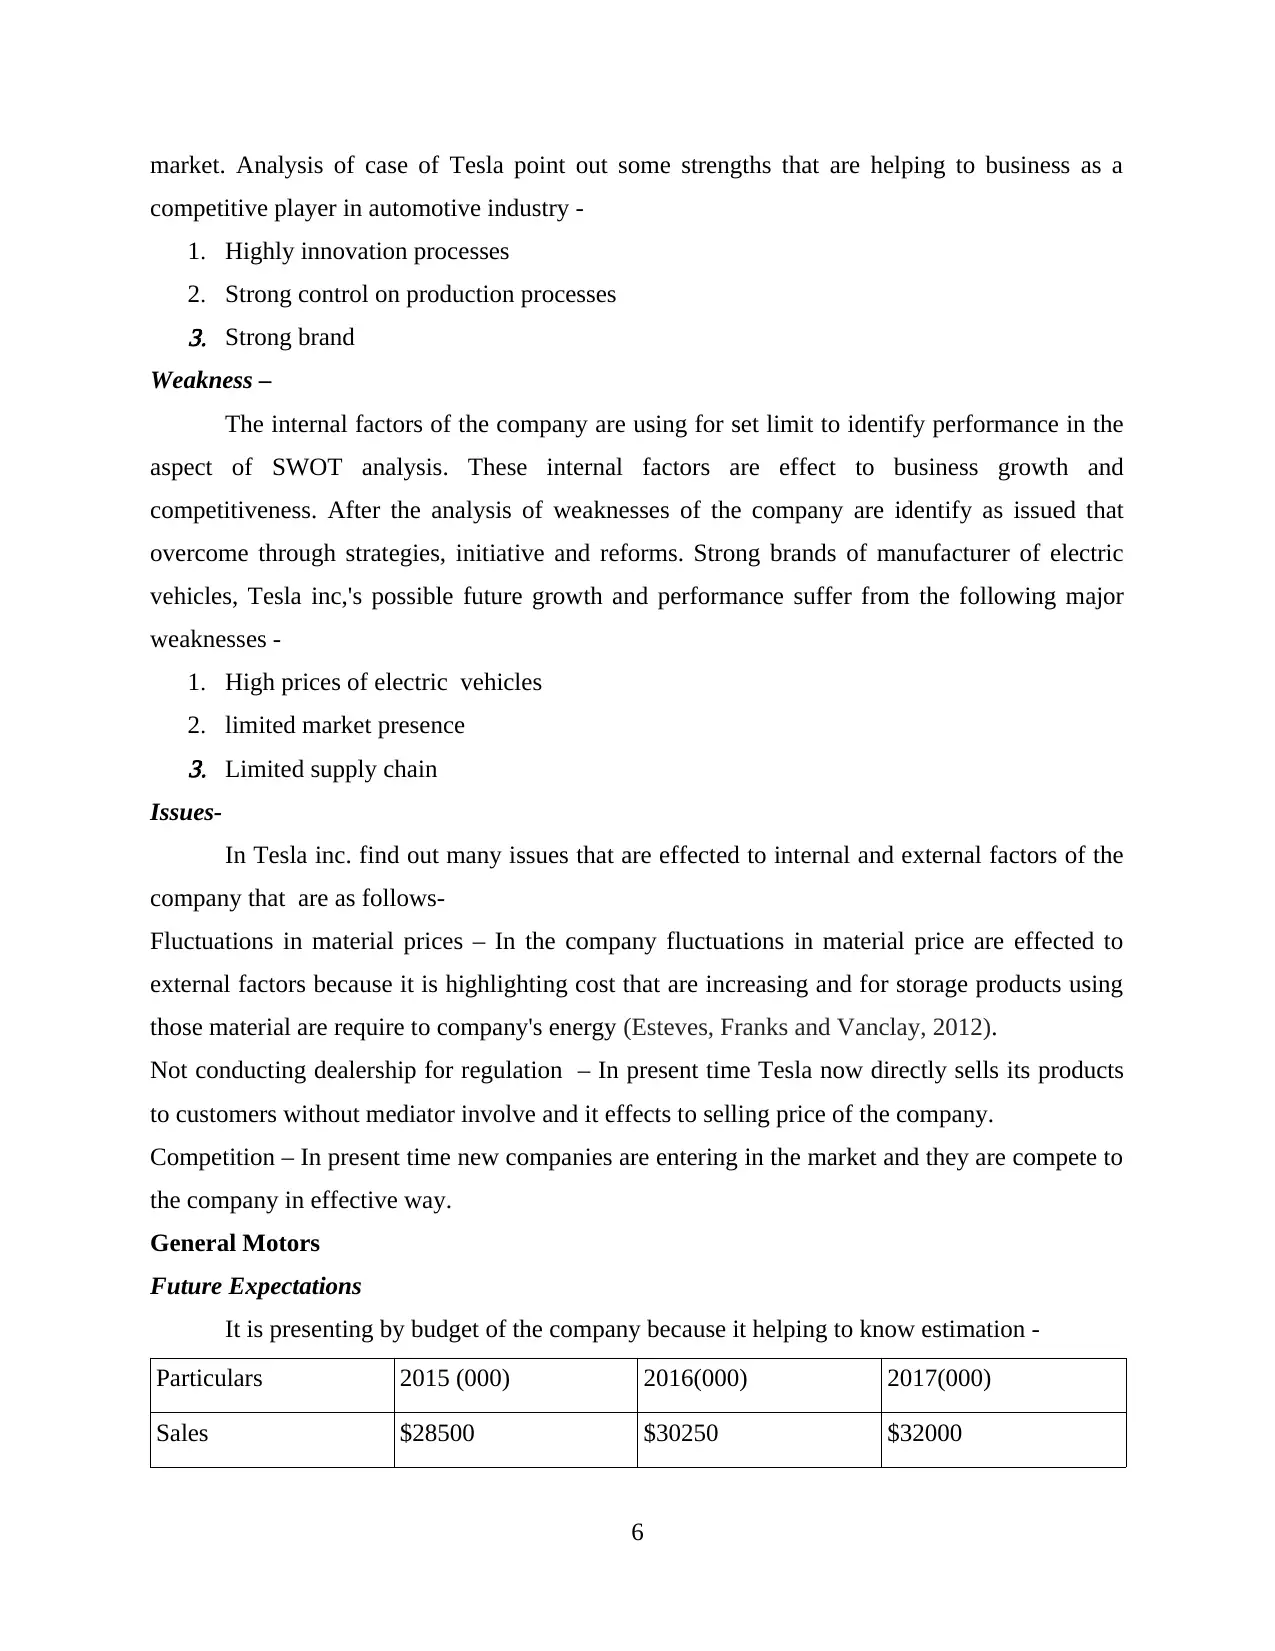
market. Analysis of case of Tesla point out some strengths that are helping to business as a
competitive player in automotive industry -
1. Highly innovation processes
2. Strong control on production processes3. Strong brand
Weakness –
The internal factors of the company are using for set limit to identify performance in the
aspect of SWOT analysis. These internal factors are effect to business growth and
competitiveness. After the analysis of weaknesses of the company are identify as issued that
overcome through strategies, initiative and reforms. Strong brands of manufacturer of electric
vehicles, Tesla inc,'s possible future growth and performance suffer from the following major
weaknesses -
1. High prices of electric vehicles
2. limited market presence3. Limited supply chain
Issues-
In Tesla inc. find out many issues that are effected to internal and external factors of the
company that are as follows-
Fluctuations in material prices – In the company fluctuations in material price are effected to
external factors because it is highlighting cost that are increasing and for storage products using
those material are require to company's energy (Esteves, Franks and Vanclay, 2012).
Not conducting dealership for regulation – In present time Tesla now directly sells its products
to customers without mediator involve and it effects to selling price of the company.
Competition – In present time new companies are entering in the market and they are compete to
the company in effective way.
General Motors
Future Expectations
It is presenting by budget of the company because it helping to know estimation -
Particulars 2015 (000) 2016(000) 2017(000)
Sales $28500 $30250 $32000
6
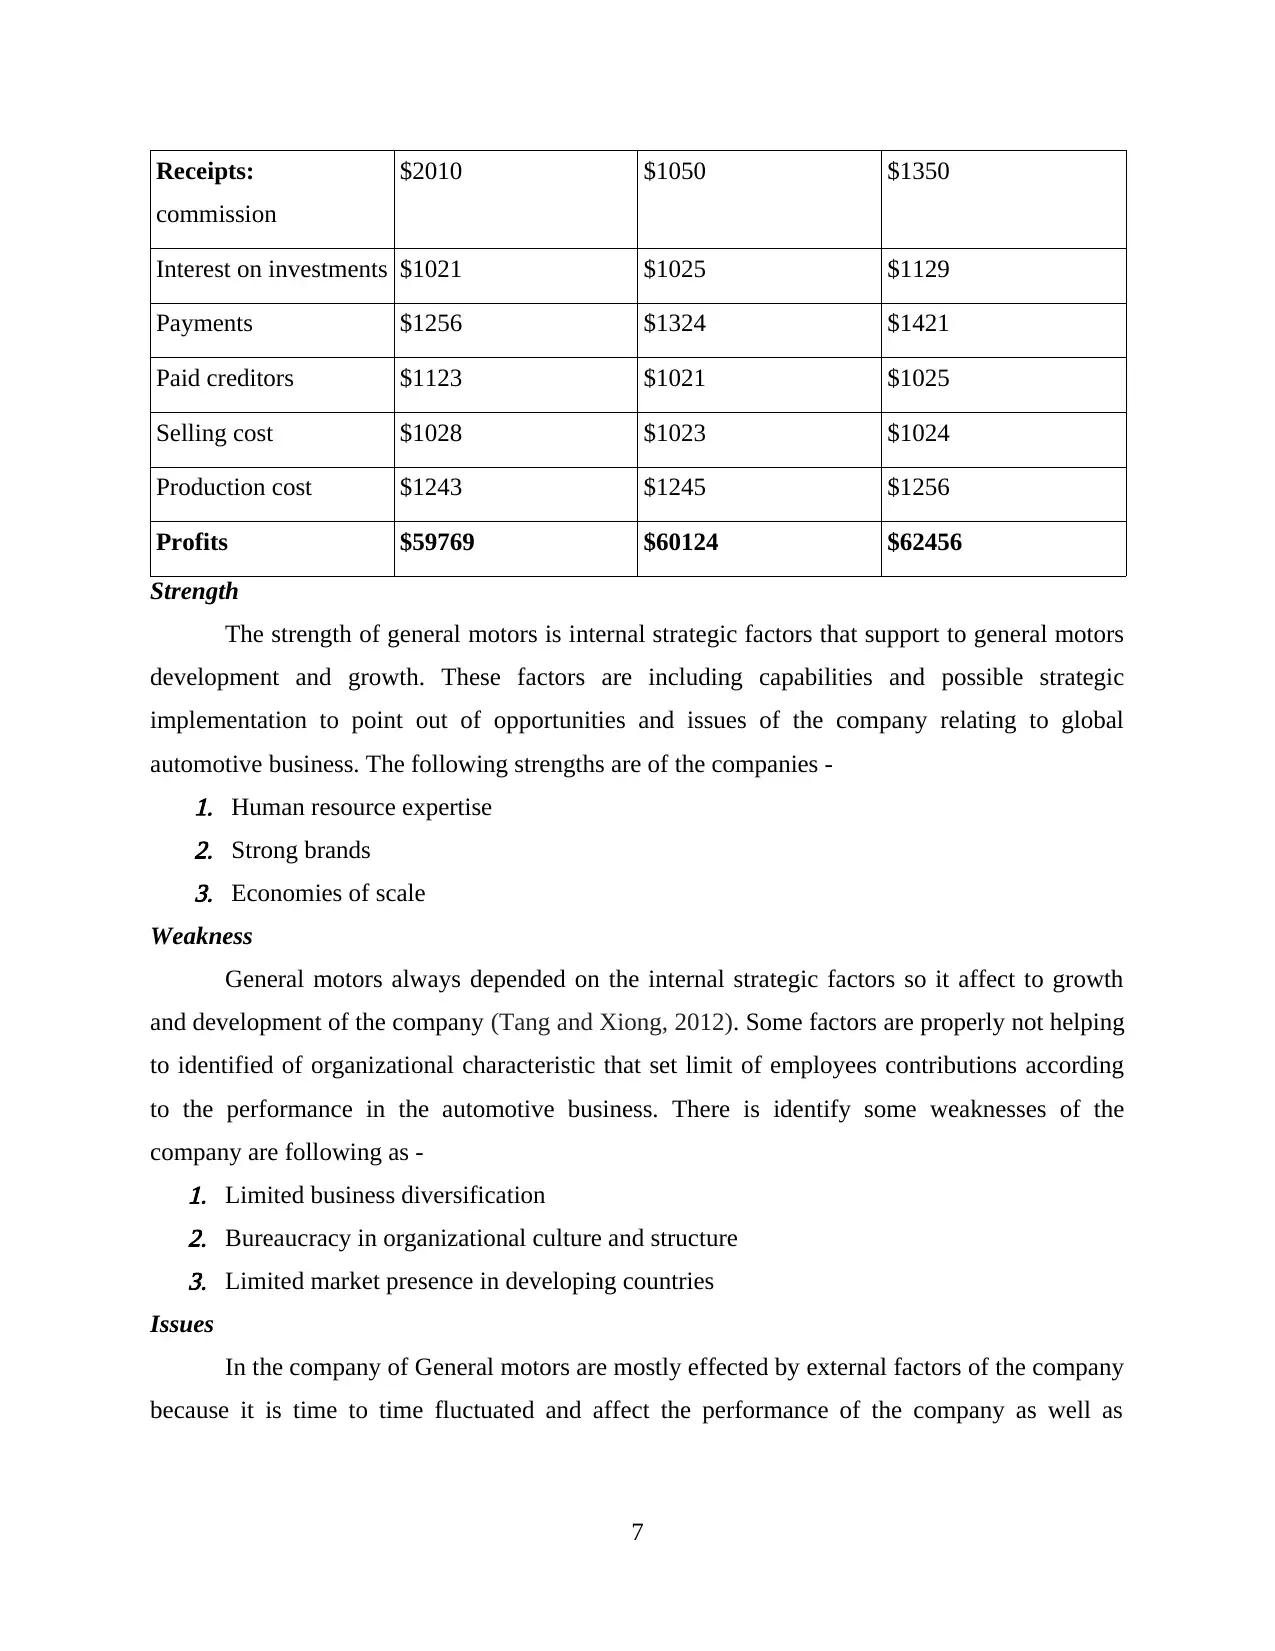
Receipts:
commission
$2010 $1050 $1350
Interest on investments $1021 $1025 $1129
Payments $1256 $1324 $1421
Paid creditors $1123 $1021 $1025
Selling cost $1028 $1023 $1024
Production cost $1243 $1245 $1256
Profits $59769 $60124 $62456
Strength
The strength of general motors is internal strategic factors that support to general motors
development and growth. These factors are including capabilities and possible strategic
implementation to point out of opportunities and issues of the company relating to global
automotive business. The following strengths are of the companies -1. Human resource expertise2. Strong brands3. Economies of scale
Weakness
General motors always depended on the internal strategic factors so it affect to growth
and development of the company (Tang and Xiong, 2012). Some factors are properly not helping
to identified of organizational characteristic that set limit of employees contributions according
to the performance in the automotive business. There is identify some weaknesses of the
company are following as -1. Limited business diversification2. Bureaucracy in organizational culture and structure3. Limited market presence in developing countries
Issues
In the company of General motors are mostly effected by external factors of the company
because it is time to time fluctuated and affect the performance of the company as well as
7
⊘ This is a preview!⊘
Do you want full access?
Subscribe today to unlock all pages.
Trusted by 1+ million students worldwide
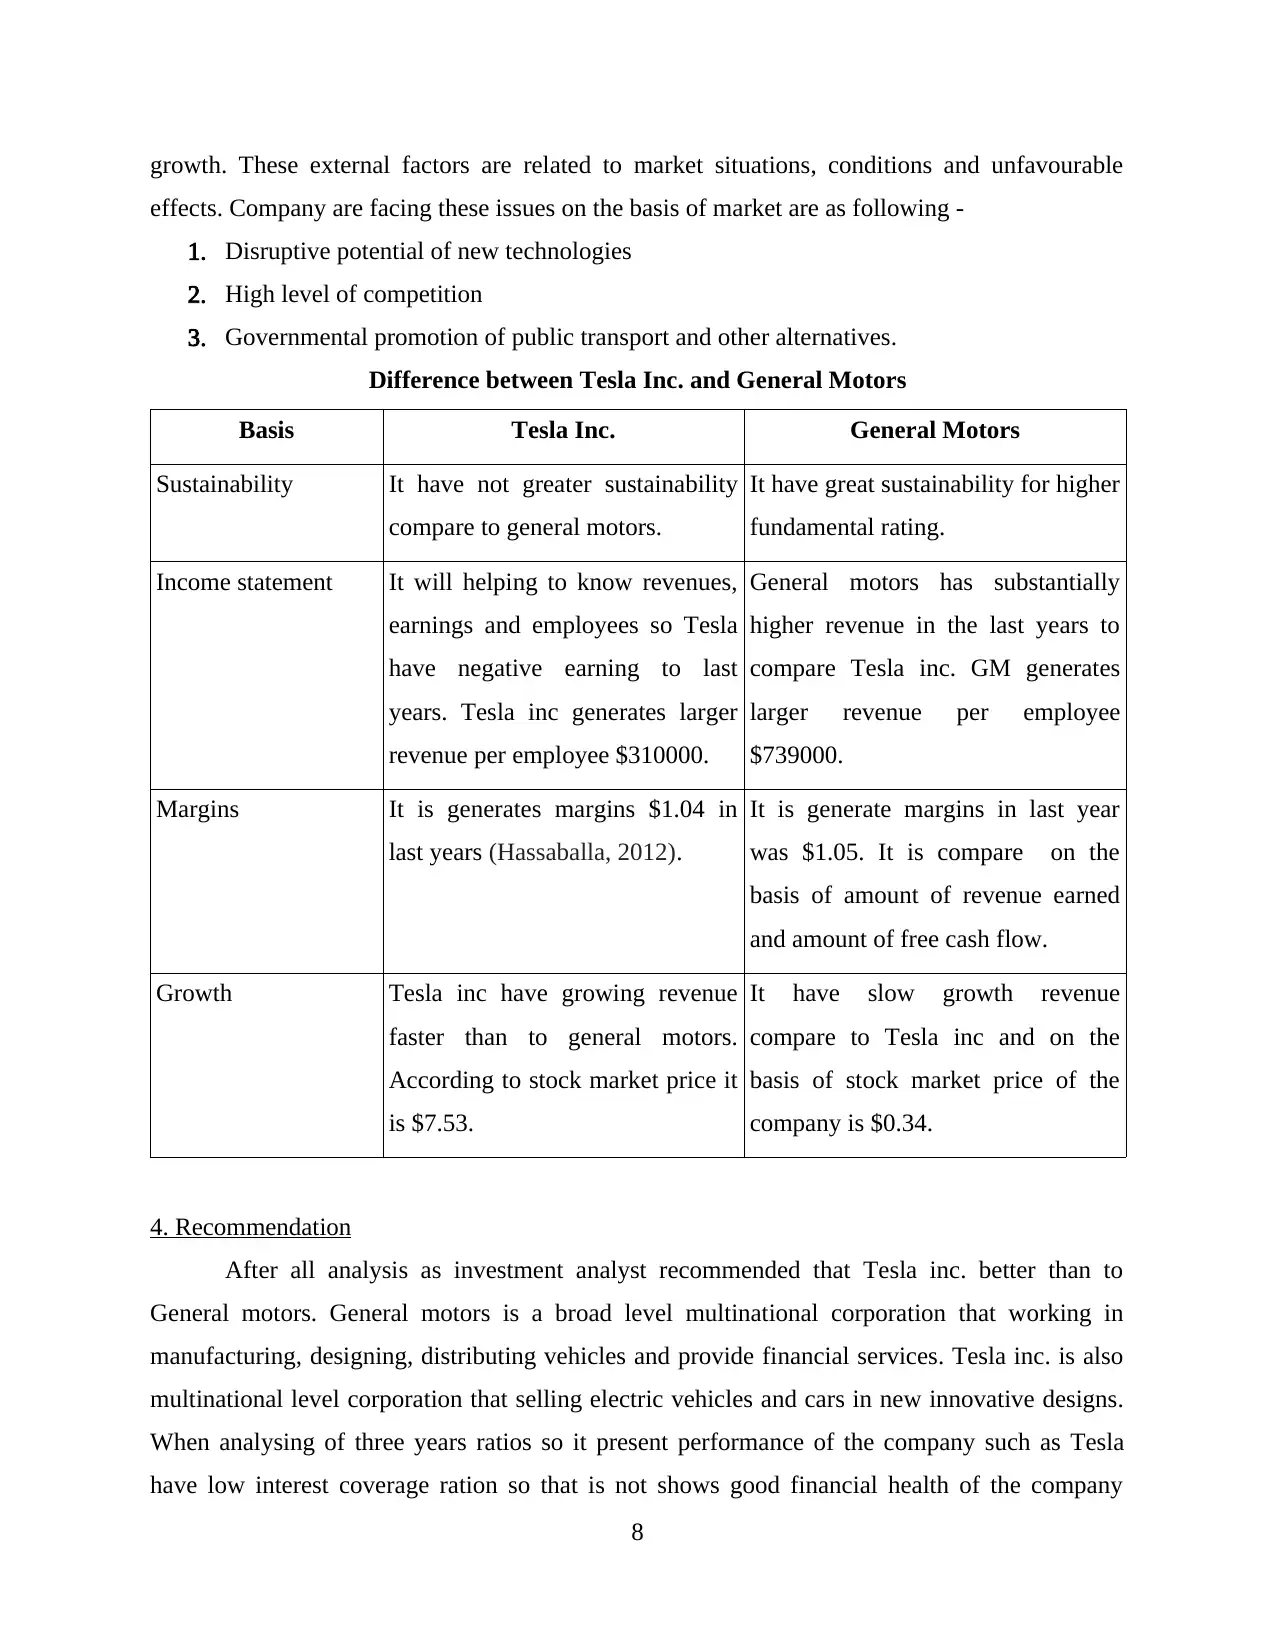
growth. These external factors are related to market situations, conditions and unfavourable
effects. Company are facing these issues on the basis of market are as following -
1. Disruptive potential of new technologies
2. High level of competition
3. Governmental promotion of public transport and other alternatives.
Difference between Tesla Inc. and General Motors
Basis Tesla Inc. General Motors
Sustainability It have not greater sustainability
compare to general motors.
It have great sustainability for higher
fundamental rating.
Income statement It will helping to know revenues,
earnings and employees so Tesla
have negative earning to last
years. Tesla inc generates larger
revenue per employee $310000.
General motors has substantially
higher revenue in the last years to
compare Tesla inc. GM generates
larger revenue per employee
$739000.
Margins It is generates margins $1.04 in
last years (Hassaballa, 2012).
It is generate margins in last year
was $1.05. It is compare on the
basis of amount of revenue earned
and amount of free cash flow.
Growth Tesla inc have growing revenue
faster than to general motors.
According to stock market price it
is $7.53.
It have slow growth revenue
compare to Tesla inc and on the
basis of stock market price of the
company is $0.34.
4. Recommendation
After all analysis as investment analyst recommended that Tesla inc. better than to
General motors. General motors is a broad level multinational corporation that working in
manufacturing, designing, distributing vehicles and provide financial services. Tesla inc. is also
multinational level corporation that selling electric vehicles and cars in new innovative designs.
When analysing of three years ratios so it present performance of the company such as Tesla
have low interest coverage ration so that is not shows good financial health of the company
8
Paraphrase This Document
Need a fresh take? Get an instant paraphrase of this document with our AI Paraphraser
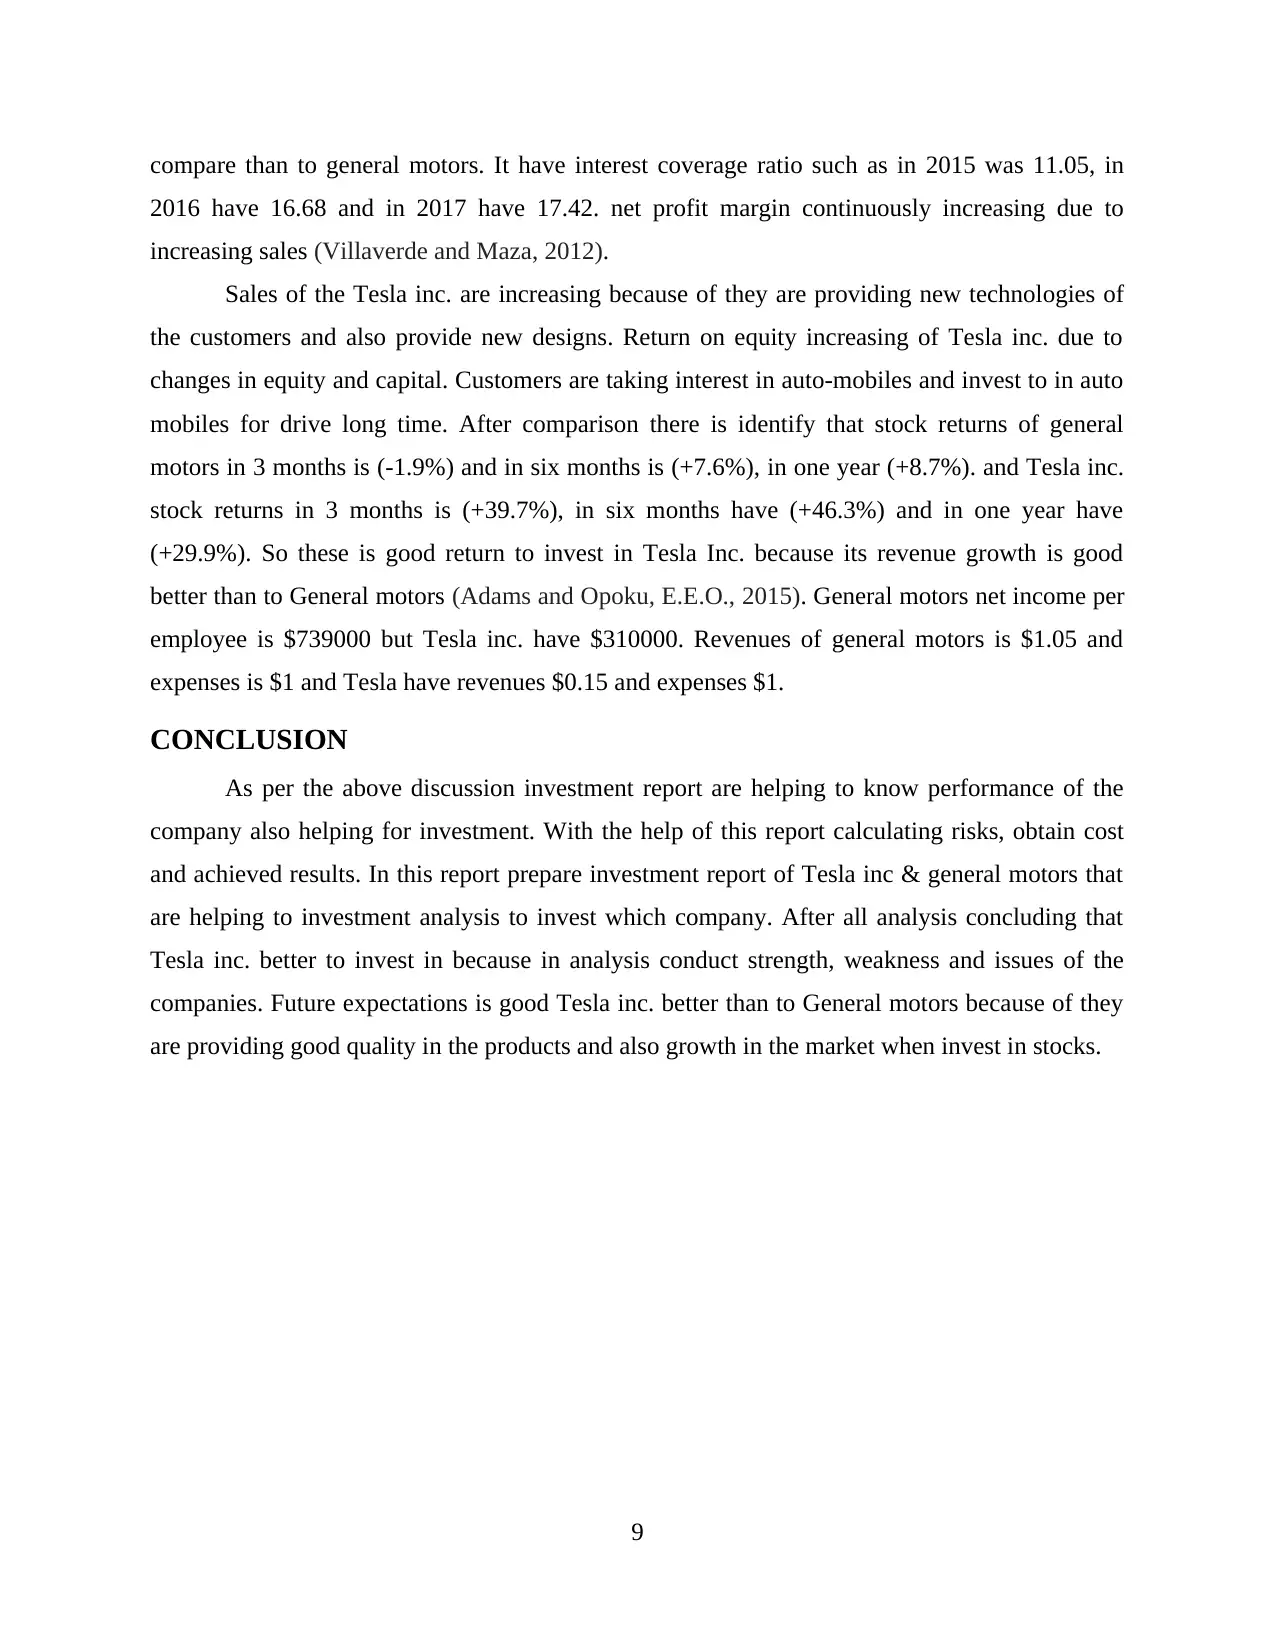
compare than to general motors. It have interest coverage ratio such as in 2015 was 11.05, in
2016 have 16.68 and in 2017 have 17.42. net profit margin continuously increasing due to
increasing sales (Villaverde and Maza, 2012).
Sales of the Tesla inc. are increasing because of they are providing new technologies of
the customers and also provide new designs. Return on equity increasing of Tesla inc. due to
changes in equity and capital. Customers are taking interest in auto-mobiles and invest to in auto
mobiles for drive long time. After comparison there is identify that stock returns of general
motors in 3 months is (-1.9%) and in six months is (+7.6%), in one year (+8.7%). and Tesla inc.
stock returns in 3 months is (+39.7%), in six months have (+46.3%) and in one year have
(+29.9%). So these is good return to invest in Tesla Inc. because its revenue growth is good
better than to General motors (Adams and Opoku, E.E.O., 2015). General motors net income per
employee is $739000 but Tesla inc. have $310000. Revenues of general motors is $1.05 and
expenses is $1 and Tesla have revenues $0.15 and expenses $1.
CONCLUSION
As per the above discussion investment report are helping to know performance of the
company also helping for investment. With the help of this report calculating risks, obtain cost
and achieved results. In this report prepare investment report of Tesla inc & general motors that
are helping to investment analysis to invest which company. After all analysis concluding that
Tesla inc. better to invest in because in analysis conduct strength, weakness and issues of the
companies. Future expectations is good Tesla inc. better than to General motors because of they
are providing good quality in the products and also growth in the market when invest in stocks.
9
REFRENCES
Books and Journals
Alfaro, L. and Charlton, A., 2013. Growth and the quality of foreign direct investment. In The
Industrial Policy Revolution I(pp. 162-204). Palgrave Macmillan, London.
Cleeve, E., 2012. Political and institutional impediments to foreign direct investment inflows to
sub‐Saharan Africa. Thunderbird International Business Review. 54(4). pp.469-477.
Hayakawa, K., Kimura, F. and Lee, H. H., 2013. How does country risk matter for foreign direct
investment?. The Developing Economies. 51(1). pp.60-78.
Bitzenis, A., 2016. The Balkans: foreign direct investment and EU accession. Routledge.
Cheung, Y. W. And et. Al, 2012. China's outward direct investment in Africa. Review of
International Economics. 20(2). pp.201-220.
Esteves, A. M., Franks, D. and Vanclay, F., 2012. Social impact assessment: the state of the art.
Impact Assessment and Project Appraisal. 30(1). pp.34-42.
Tang, K. and Xiong, W., 2012. Index investment and the financialization of commodities.
Financial Analysts Journal. 68(5). pp.54-74.
Hassaballa, H., 2014. Testing for Granger causality between energy use and foreign direct
investment Inflows in developing countries. Renewable and Sustainable Energy
Reviews. 31. pp.417-426.
Villaverde, J. and Maza, A., 2012. Foreign direct investment in Spain: Regional distribution and
determinants. International Business Review. 21(4). pp.722-733.
Adams, S. and Opoku, E.E.O., 2015. Foreign direct investment, regulations and growth in sub-
Saharan Africa. Economic Analysis and Policy. 47. pp.48-56.
Eregha, P. B., 2012. The dynamic linkages between foreign direct investment and domestic
investment in ECOWAS countries: A panel cointegration analysis. African
Development Review. 24(3). pp.208-220.
World Health Organization, 2015. World malaria report 2014. World Health Organization.
10
⊘ This is a preview!⊘
Do you want full access?
Subscribe today to unlock all pages.
Trusted by 1+ million students worldwide
1 out of 12
Related Documents


Your All-in-One AI-Powered Toolkit for Academic Success.
+13062052269
info@desklib.com
Available 24*7 on WhatsApp / Email
![[object Object]](/_next/static/media/star-bottom.7253800d.svg)
Unlock your academic potential
Copyright © 2020–2026 A2Z Services. All Rights Reserved. Developed and managed by ZUCOL.