Trident University: Module 1 SLP - Tesla Stock Risk Analysis Report
VerifiedAdded on 2022/09/15
|16
|2961
|16
Report
AI Summary
This report provides a comprehensive financial analysis of Tesla, Inc. (TSLA), focusing on its risk characteristics and comparing them to those of its competitors in the automotive industry. The analysis begins with an introduction to Tesla, highlighting its business segments, innovations, and the CEO's vision for a sustainable future. The report then assesses Tesla's risk profile using beta, a measure of systematic risk, and examines its stock price movements to gauge volatility. The study reveals Tesla's beta is relatively low, indicating it's less volatile than the market. Furthermore, the report compares Tesla's risk metrics with those of General Motors, Ford, BMW, and Volkswagen, using their respective betas to assess their relative volatility. Ultimately, the report aims to provide insights for informed investment decisions, based on the risk-return analysis of Tesla and its competitors. The report also covers the concept of perpetuity payment, present value, and future value calculations. The analysis incorporates calculations of expected return, standard deviation, and coefficient of variation for different assets.
Module 1 – Case
Paraphrase This Document
Need a fresh take? Get an instant paraphrase of this document with our AI Paraphraser
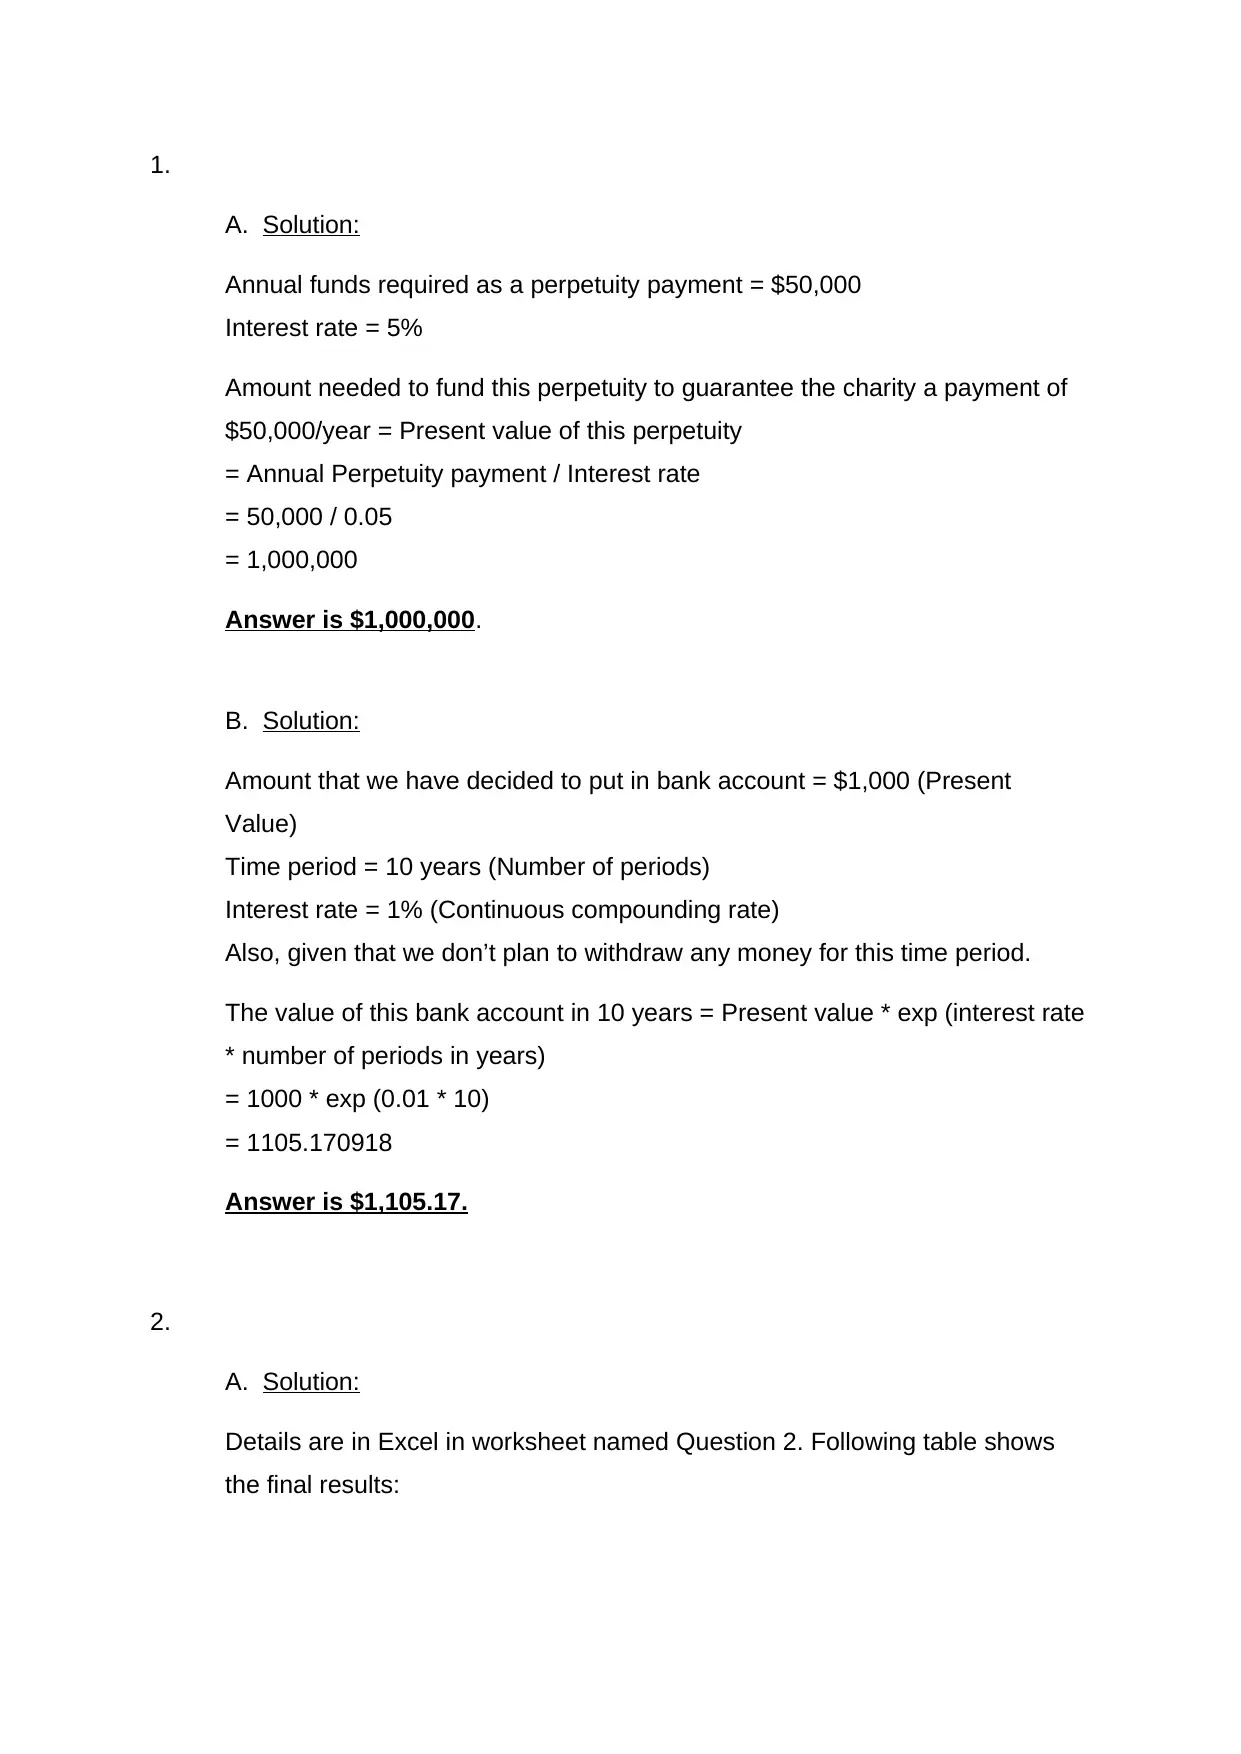
1.
A. Solution:
Annual funds required as a perpetuity payment = $50,000
Interest rate = 5%
Amount needed to fund this perpetuity to guarantee the charity a payment of
$50,000/year = Present value of this perpetuity
= Annual Perpetuity payment / Interest rate
= 50,000 / 0.05
= 1,000,000
Answer is $1,000,000.
B. Solution:
Amount that we have decided to put in bank account = $1,000 (Present
Value)
Time period = 10 years (Number of periods)
Interest rate = 1% (Continuous compounding rate)
Also, given that we don’t plan to withdraw any money for this time period.
The value of this bank account in 10 years = Present value * exp (interest rate
* number of periods in years)
= 1000 * exp (0.01 * 10)
= 1105.170918
Answer is $1,105.17.
2.
A. Solution:
Details are in Excel in worksheet named Question 2. Following table shows
the final results:
A. Solution:
Annual funds required as a perpetuity payment = $50,000
Interest rate = 5%
Amount needed to fund this perpetuity to guarantee the charity a payment of
$50,000/year = Present value of this perpetuity
= Annual Perpetuity payment / Interest rate
= 50,000 / 0.05
= 1,000,000
Answer is $1,000,000.
B. Solution:
Amount that we have decided to put in bank account = $1,000 (Present
Value)
Time period = 10 years (Number of periods)
Interest rate = 1% (Continuous compounding rate)
Also, given that we don’t plan to withdraw any money for this time period.
The value of this bank account in 10 years = Present value * exp (interest rate
* number of periods in years)
= 1000 * exp (0.01 * 10)
= 1105.170918
Answer is $1,105.17.
2.
A. Solution:
Details are in Excel in worksheet named Question 2. Following table shows
the final results:
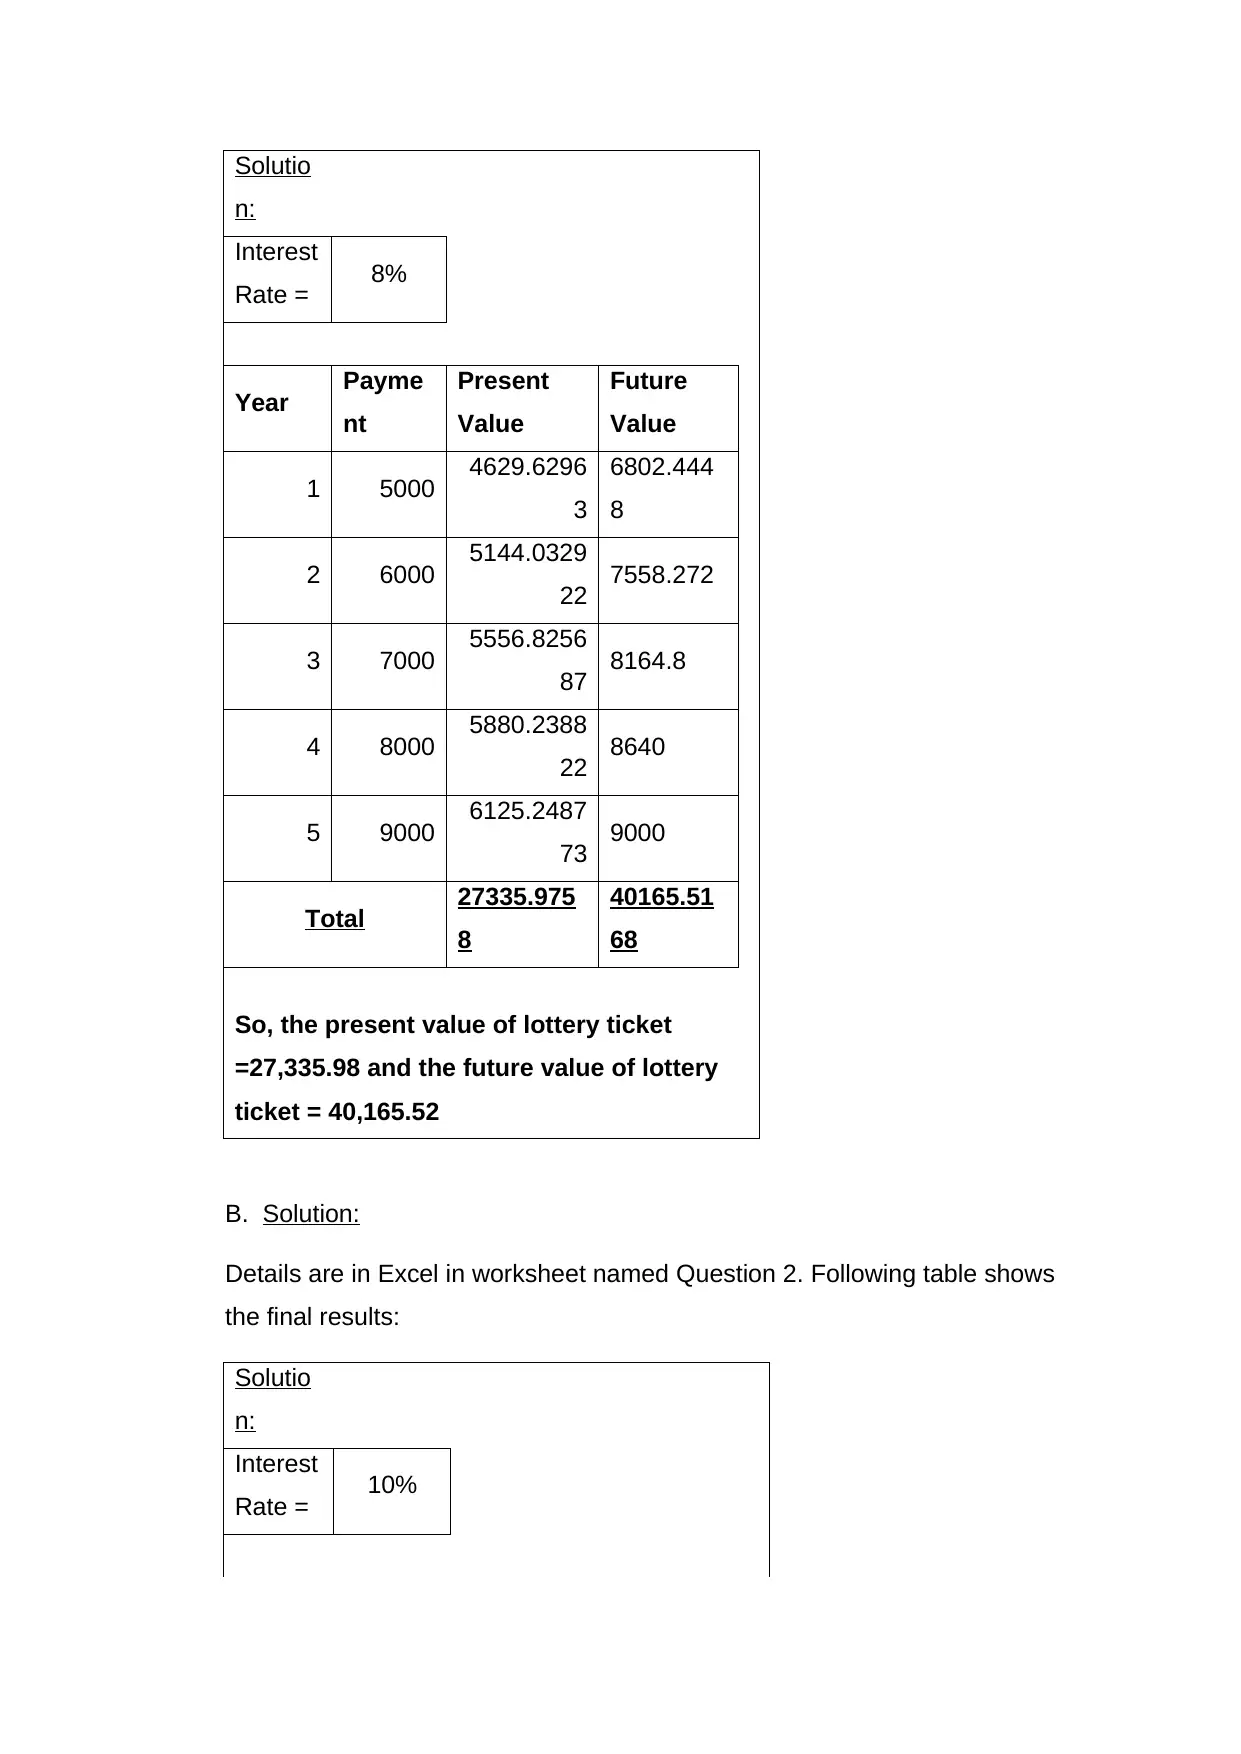
Solutio
n:
Interest
Rate = 8%
Year Payme
nt
Present
Value
Future
Value
1 5000 4629.6296
3
6802.444
8
2 6000 5144.0329
22 7558.272
3 7000 5556.8256
87 8164.8
4 8000 5880.2388
22 8640
5 9000 6125.2487
73 9000
Total 27335.975
8
40165.51
68
So, the present value of lottery ticket
=27,335.98 and the future value of lottery
ticket = 40,165.52
B. Solution:
Details are in Excel in worksheet named Question 2. Following table shows
the final results:
Solutio
n:
Interest
Rate = 10%
n:
Interest
Rate = 8%
Year Payme
nt
Present
Value
Future
Value
1 5000 4629.6296
3
6802.444
8
2 6000 5144.0329
22 7558.272
3 7000 5556.8256
87 8164.8
4 8000 5880.2388
22 8640
5 9000 6125.2487
73 9000
Total 27335.975
8
40165.51
68
So, the present value of lottery ticket
=27,335.98 and the future value of lottery
ticket = 40,165.52
B. Solution:
Details are in Excel in worksheet named Question 2. Following table shows
the final results:
Solutio
n:
Interest
Rate = 10%
⊘ This is a preview!⊘
Do you want full access?
Subscribe today to unlock all pages.
Trusted by 1+ million students worldwide
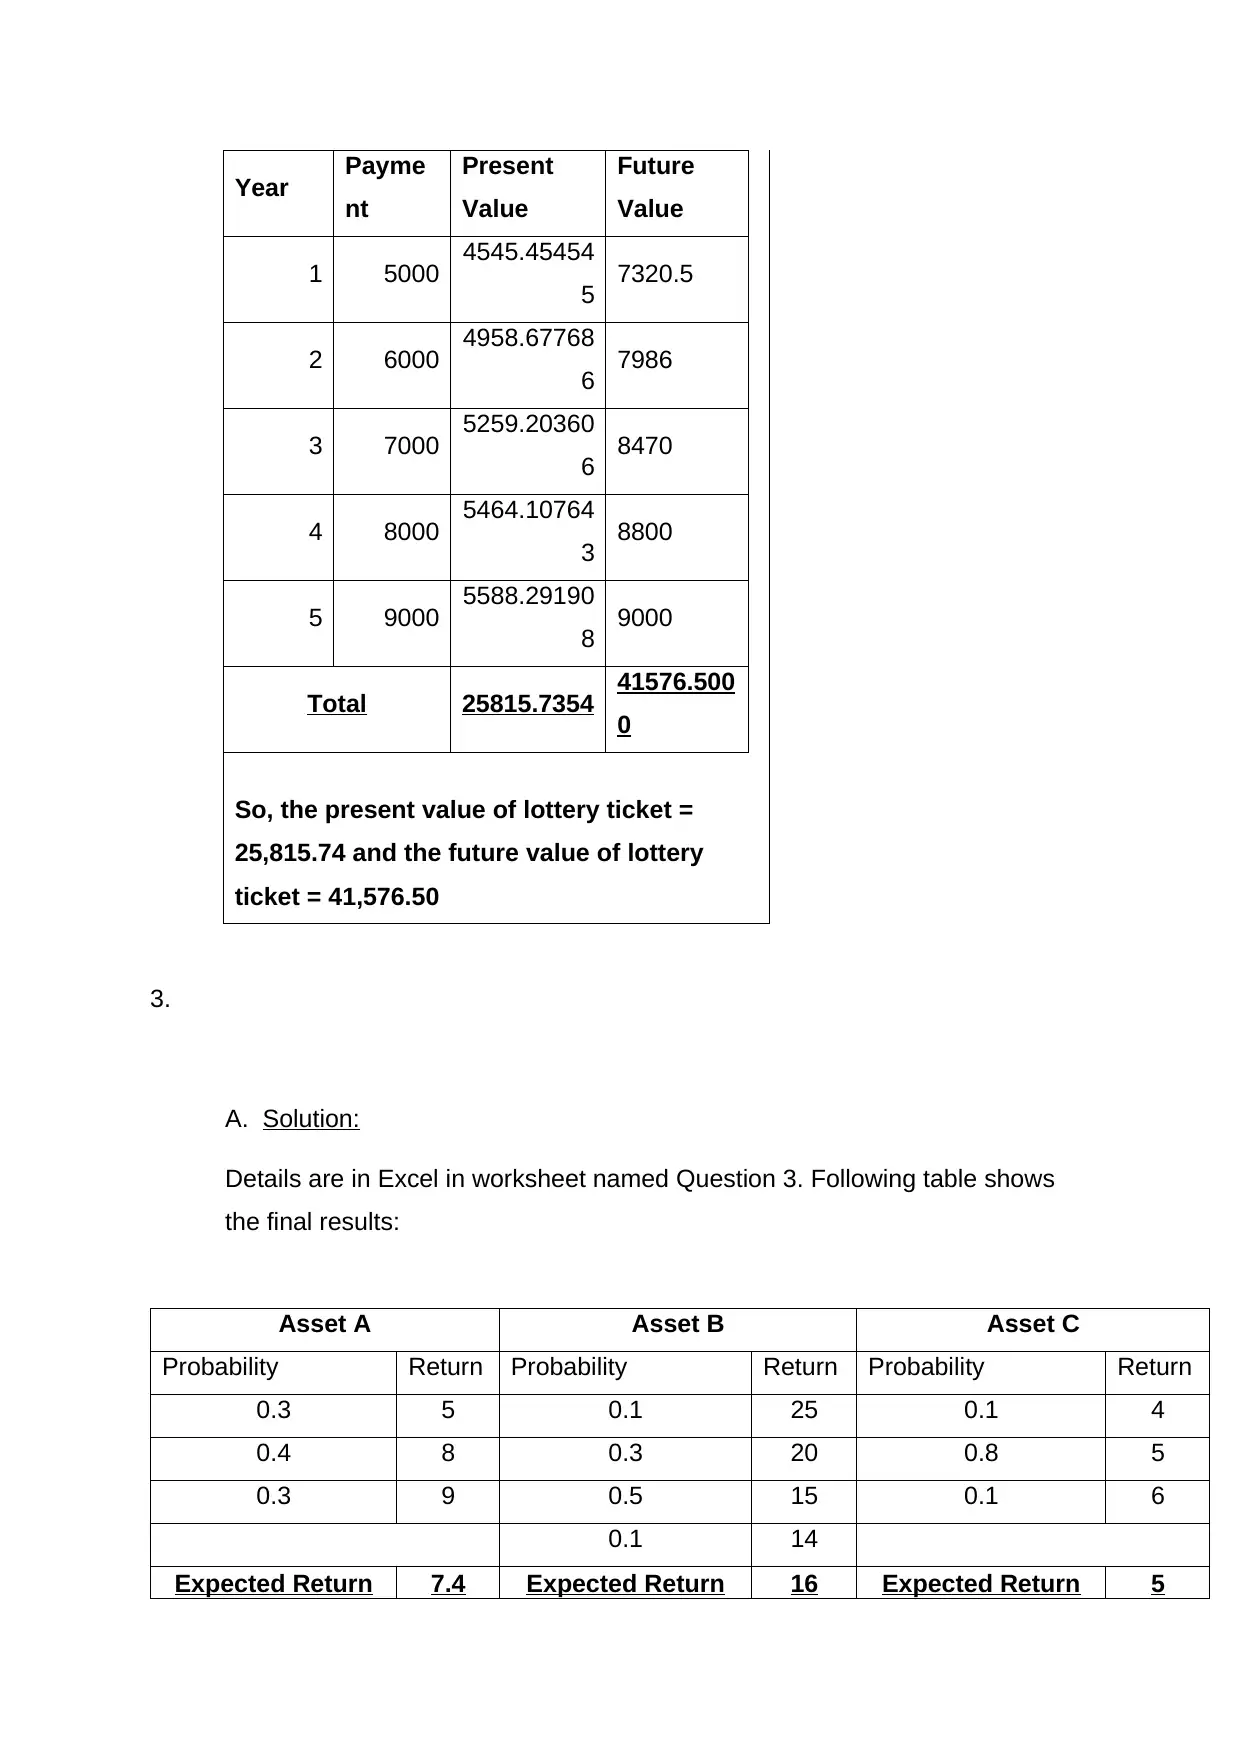
Year Payme
nt
Present
Value
Future
Value
1 5000 4545.45454
5 7320.5
2 6000 4958.67768
6 7986
3 7000 5259.20360
6 8470
4 8000 5464.10764
3 8800
5 9000 5588.29190
8 9000
Total 25815.7354 41576.500
0
So, the present value of lottery ticket =
25,815.74 and the future value of lottery
ticket = 41,576.50
3.
A. Solution:
Details are in Excel in worksheet named Question 3. Following table shows
the final results:
Asset A Asset B Asset C
Probability Return Probability Return Probability Return
0.3 5 0.1 25 0.1 4
0.4 8 0.3 20 0.8 5
0.3 9 0.5 15 0.1 6
0.1 14
Expected Return 7.4 Expected Return 16 Expected Return 5
Paraphrase This Document
Need a fresh take? Get an instant paraphrase of this document with our AI Paraphraser
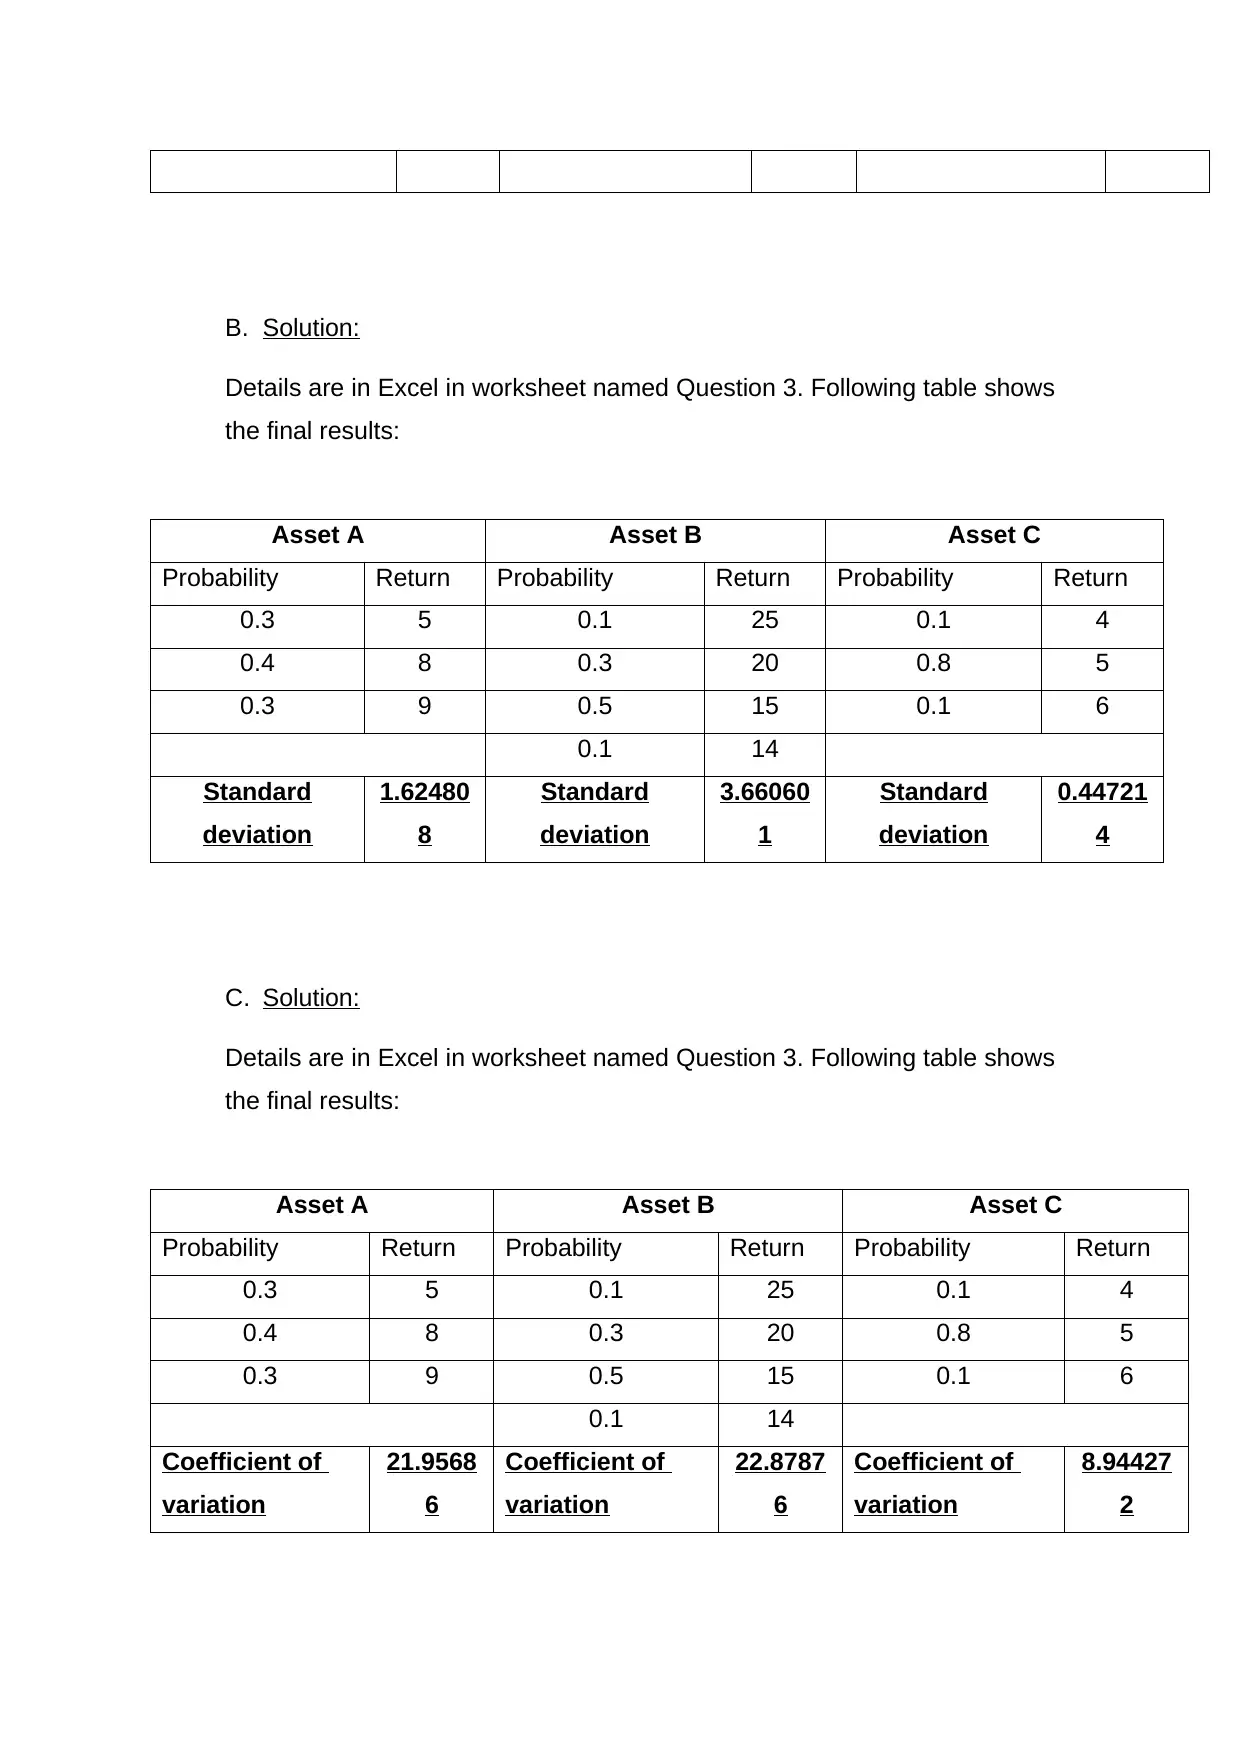
B. Solution:
Details are in Excel in worksheet named Question 3. Following table shows
the final results:
Asset A Asset B Asset C
Probability Return Probability Return Probability Return
0.3 5 0.1 25 0.1 4
0.4 8 0.3 20 0.8 5
0.3 9 0.5 15 0.1 6
0.1 14
Standard
deviation
1.62480
8
Standard
deviation
3.66060
1
Standard
deviation
0.44721
4
C. Solution:
Details are in Excel in worksheet named Question 3. Following table shows
the final results:
Asset A Asset B Asset C
Probability Return Probability Return Probability Return
0.3 5 0.1 25 0.1 4
0.4 8 0.3 20 0.8 5
0.3 9 0.5 15 0.1 6
0.1 14
Coefficient of
variation
21.9568
6
Coefficient of
variation
22.8787
6
Coefficient of
variation
8.94427
2
Details are in Excel in worksheet named Question 3. Following table shows
the final results:
Asset A Asset B Asset C
Probability Return Probability Return Probability Return
0.3 5 0.1 25 0.1 4
0.4 8 0.3 20 0.8 5
0.3 9 0.5 15 0.1 6
0.1 14
Standard
deviation
1.62480
8
Standard
deviation
3.66060
1
Standard
deviation
0.44721
4
C. Solution:
Details are in Excel in worksheet named Question 3. Following table shows
the final results:
Asset A Asset B Asset C
Probability Return Probability Return Probability Return
0.3 5 0.1 25 0.1 4
0.4 8 0.3 20 0.8 5
0.3 9 0.5 15 0.1 6
0.1 14
Coefficient of
variation
21.9568
6
Coefficient of
variation
22.8787
6
Coefficient of
variation
8.94427
2
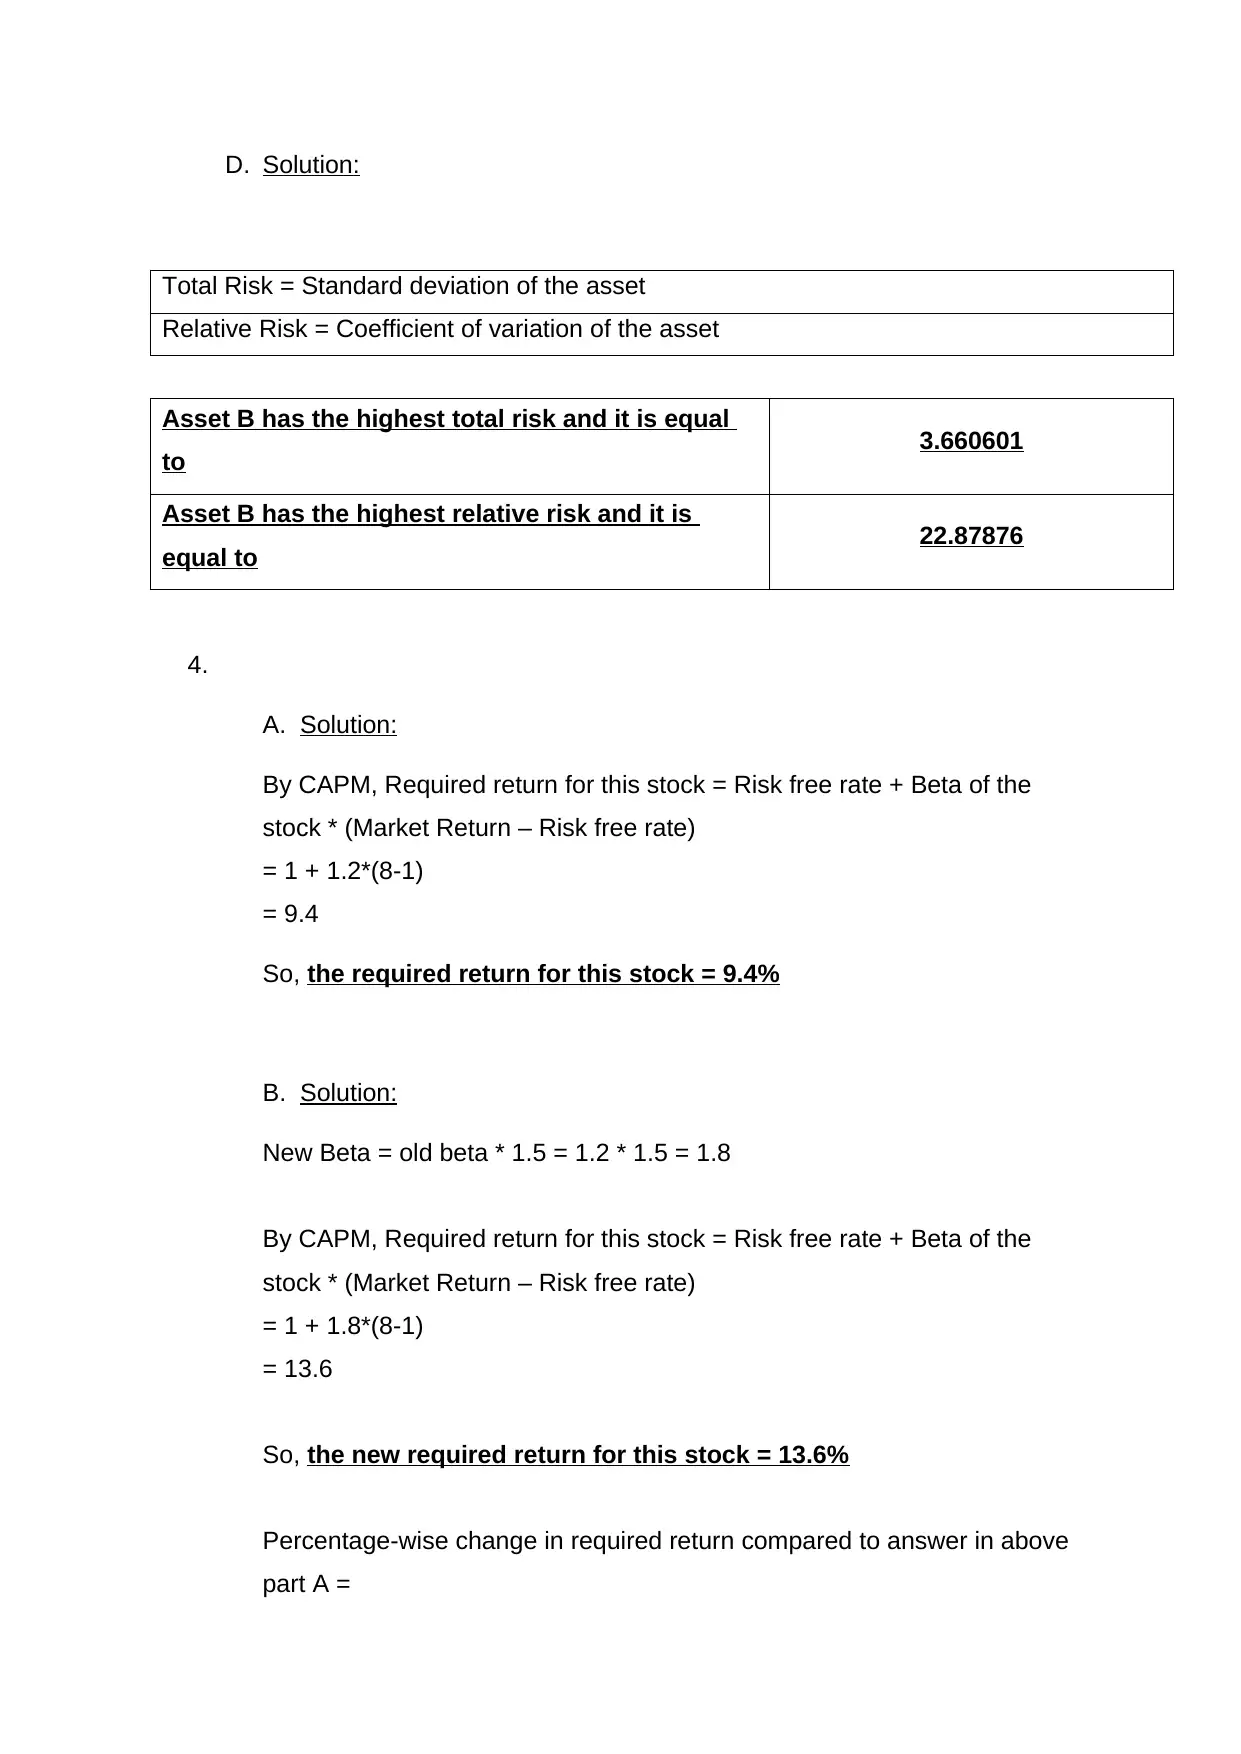
D. Solution:
Total Risk = Standard deviation of the asset
Relative Risk = Coefficient of variation of the asset
Asset B has the highest total risk and it is equal
to 3.660601
Asset B has the highest relative risk and it is
equal to 22.87876
4.
A. Solution:
By CAPM, Required return for this stock = Risk free rate + Beta of the
stock * (Market Return – Risk free rate)
= 1 + 1.2*(8-1)
= 9.4
So, the required return for this stock = 9.4%
B. Solution:
New Beta = old beta * 1.5 = 1.2 * 1.5 = 1.8
By CAPM, Required return for this stock = Risk free rate + Beta of the
stock * (Market Return – Risk free rate)
= 1 + 1.8*(8-1)
= 13.6
So, the new required return for this stock = 13.6%
Percentage-wise change in required return compared to answer in above
part A =
⊘ This is a preview!⊘
Do you want full access?
Subscribe today to unlock all pages.
Trusted by 1+ million students worldwide
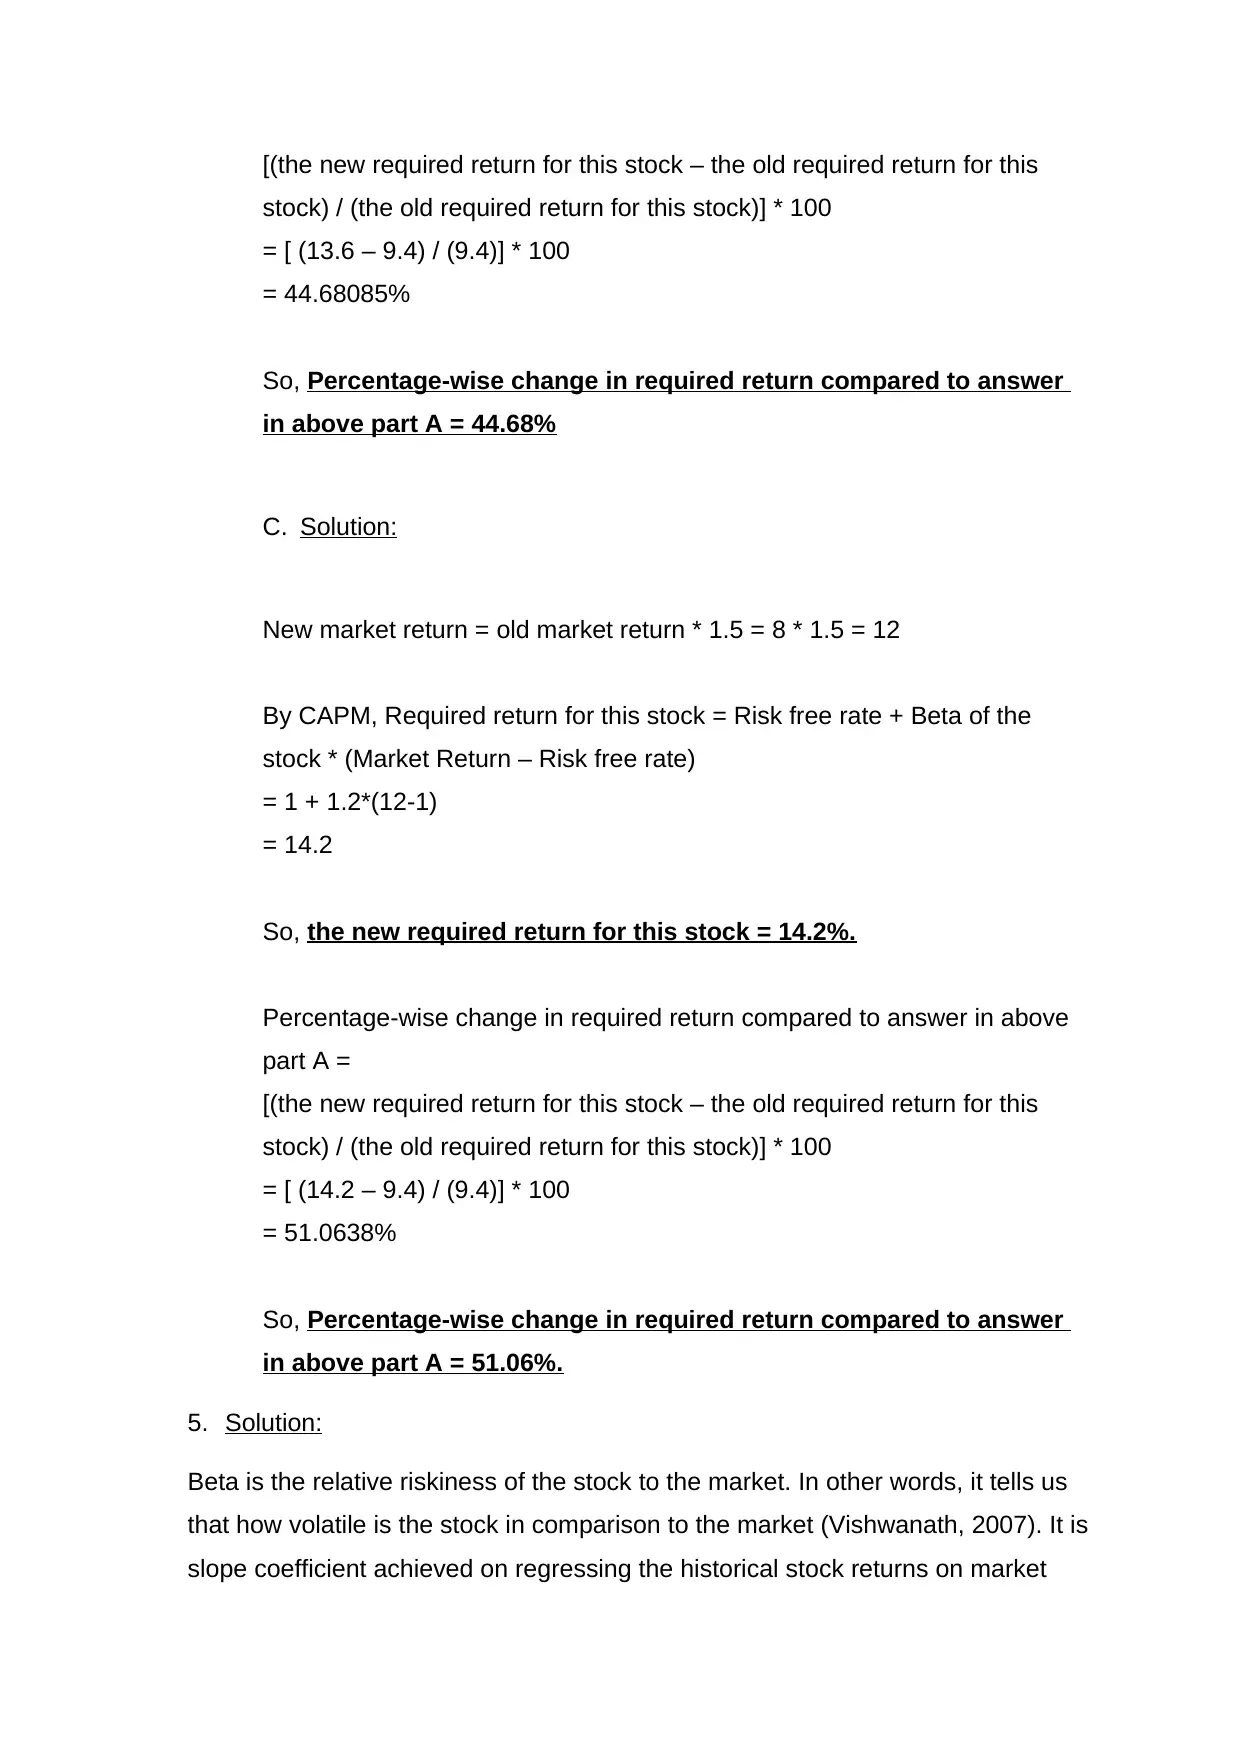
[(the new required return for this stock – the old required return for this
stock) / (the old required return for this stock)] * 100
= [ (13.6 – 9.4) / (9.4)] * 100
= 44.68085%
So, Percentage-wise change in required return compared to answer
in above part A = 44.68%
C. Solution:
New market return = old market return * 1.5 = 8 * 1.5 = 12
By CAPM, Required return for this stock = Risk free rate + Beta of the
stock * (Market Return – Risk free rate)
= 1 + 1.2*(12-1)
= 14.2
So, the new required return for this stock = 14.2%.
Percentage-wise change in required return compared to answer in above
part A =
[(the new required return for this stock – the old required return for this
stock) / (the old required return for this stock)] * 100
= [ (14.2 – 9.4) / (9.4)] * 100
= 51.0638%
So, Percentage-wise change in required return compared to answer
in above part A = 51.06%.
5. Solution:
Beta is the relative riskiness of the stock to the market. In other words, it tells us
that how volatile is the stock in comparison to the market (Vishwanath, 2007). It is
slope coefficient achieved on regressing the historical stock returns on market
stock) / (the old required return for this stock)] * 100
= [ (13.6 – 9.4) / (9.4)] * 100
= 44.68085%
So, Percentage-wise change in required return compared to answer
in above part A = 44.68%
C. Solution:
New market return = old market return * 1.5 = 8 * 1.5 = 12
By CAPM, Required return for this stock = Risk free rate + Beta of the
stock * (Market Return – Risk free rate)
= 1 + 1.2*(12-1)
= 14.2
So, the new required return for this stock = 14.2%.
Percentage-wise change in required return compared to answer in above
part A =
[(the new required return for this stock – the old required return for this
stock) / (the old required return for this stock)] * 100
= [ (14.2 – 9.4) / (9.4)] * 100
= 51.0638%
So, Percentage-wise change in required return compared to answer
in above part A = 51.06%.
5. Solution:
Beta is the relative riskiness of the stock to the market. In other words, it tells us
that how volatile is the stock in comparison to the market (Vishwanath, 2007). It is
slope coefficient achieved on regressing the historical stock returns on market
Paraphrase This Document
Need a fresh take? Get an instant paraphrase of this document with our AI Paraphraser
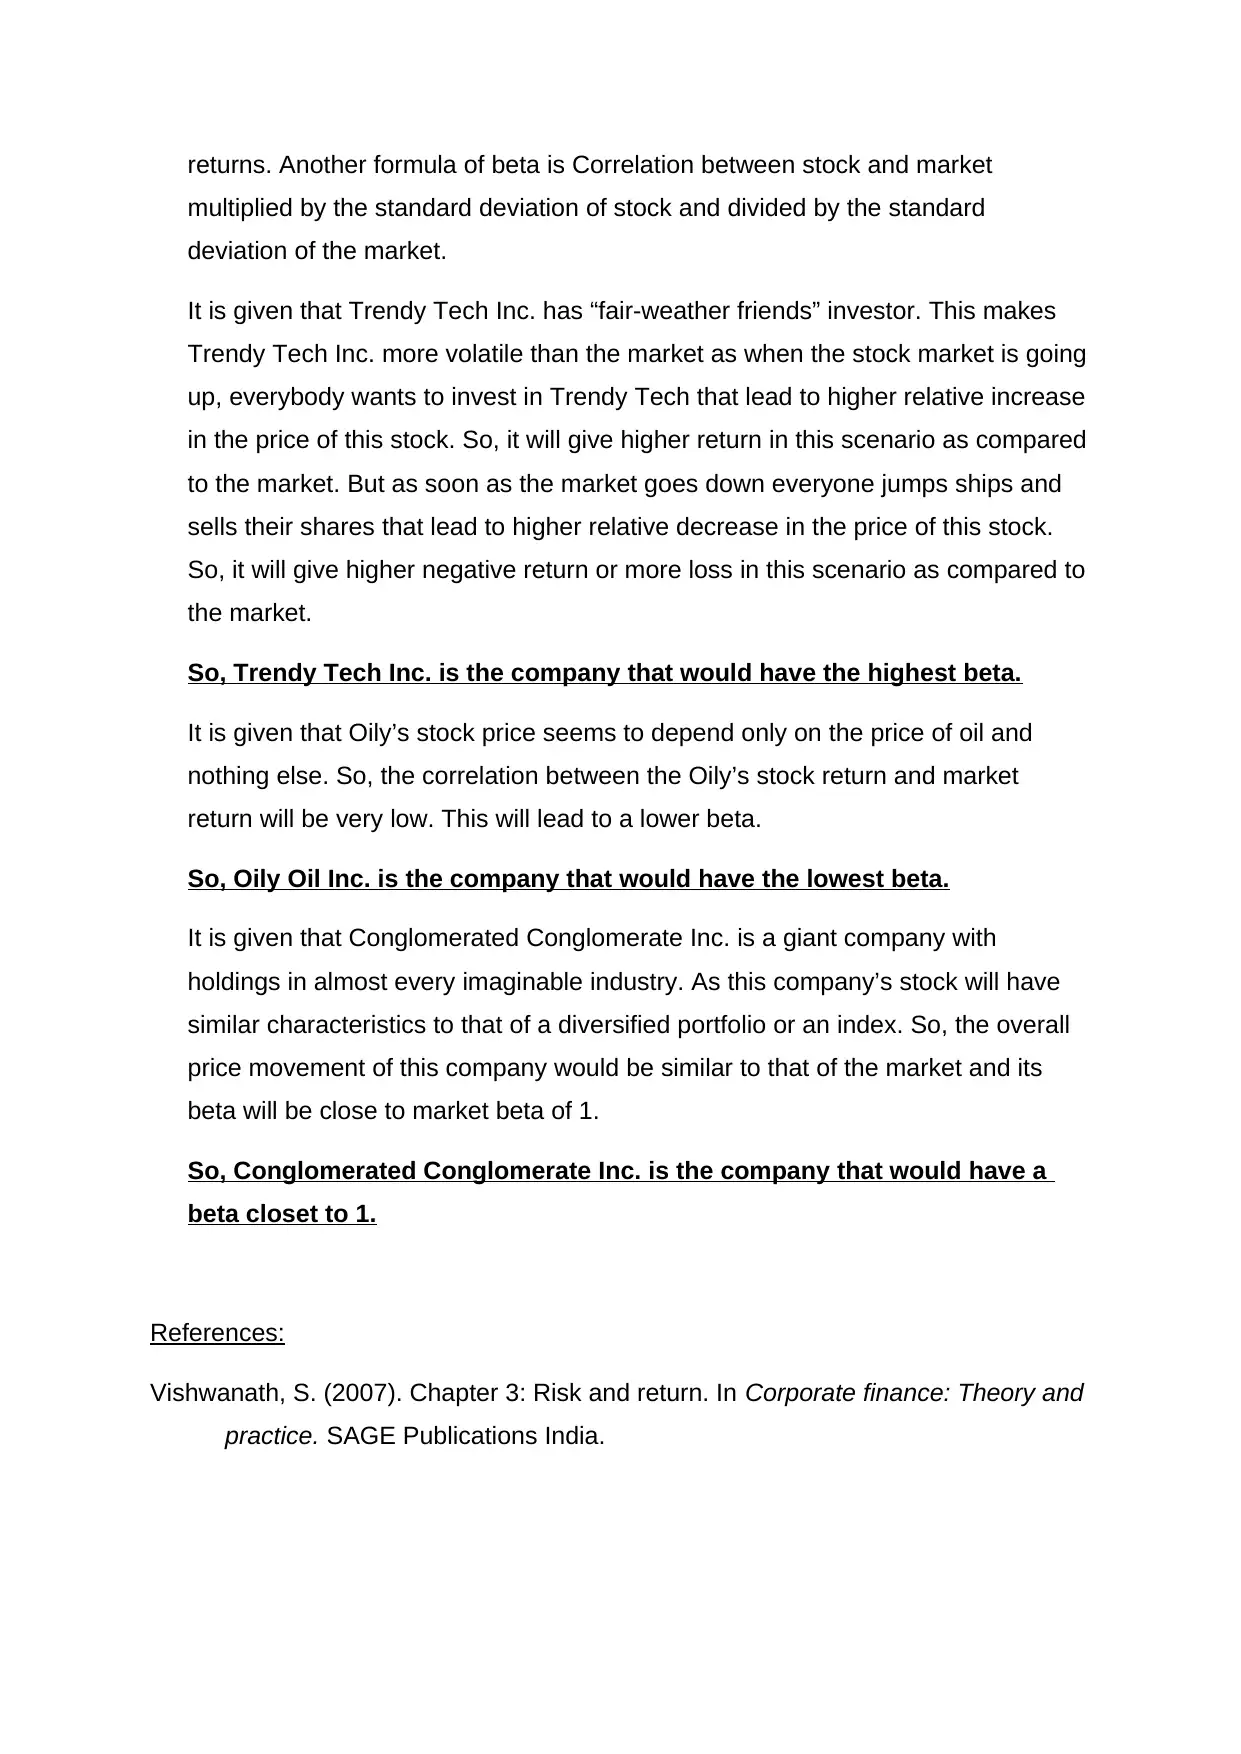
returns. Another formula of beta is Correlation between stock and market
multiplied by the standard deviation of stock and divided by the standard
deviation of the market.
It is given that Trendy Tech Inc. has “fair-weather friends” investor. This makes
Trendy Tech Inc. more volatile than the market as when the stock market is going
up, everybody wants to invest in Trendy Tech that lead to higher relative increase
in the price of this stock. So, it will give higher return in this scenario as compared
to the market. But as soon as the market goes down everyone jumps ships and
sells their shares that lead to higher relative decrease in the price of this stock.
So, it will give higher negative return or more loss in this scenario as compared to
the market.
So, Trendy Tech Inc. is the company that would have the highest beta.
It is given that Oily’s stock price seems to depend only on the price of oil and
nothing else. So, the correlation between the Oily’s stock return and market
return will be very low. This will lead to a lower beta.
So, Oily Oil Inc. is the company that would have the lowest beta.
It is given that Conglomerated Conglomerate Inc. is a giant company with
holdings in almost every imaginable industry. As this company’s stock will have
similar characteristics to that of a diversified portfolio or an index. So, the overall
price movement of this company would be similar to that of the market and its
beta will be close to market beta of 1.
So, Conglomerated Conglomerate Inc. is the company that would have a
beta closet to 1.
References:
Vishwanath, S. (2007). Chapter 3: Risk and return. In Corporate finance: Theory and
practice. SAGE Publications India.
Trident University
Student’s Name
Module 1 – SLP
Course Number: Course Name
Student’s Name
Module 1 – SLP
Course Number: Course Name
⊘ This is a preview!⊘
Do you want full access?
Subscribe today to unlock all pages.
Trusted by 1+ million students worldwide
Professor’s Name
Date
Contents
1. Introduction...........................................................................................................11
2. Tesla, Inc. (TSLA) Risk Analysis.........................................................................11
2.1. Tesla’s description and its interesting details.........................................11
2.2. Tesla’s beta and its risk characteristics...................................................11
2.3. Tesla’s stock price movements and its overall riskiness.......................12
2.4. Comparison of Tesla with its competitors in terms of beta and other
riskiness measures to choose a preferred company for investment..............13
3. Conclusion..........................................................................................................14
4. References:.........................................................................................................14
5. Appendix.............................................................................................................15
Paraphrase This Document
Need a fresh take? Get an instant paraphrase of this document with our AI Paraphraser
1. Introduction
The paper analyses the risk characteristics of Tesla stock using the systematic risk
measure, beta and total risk measure, standard deviation. It compares these risk
measures of Tesla with that of its competitors in the same industry. Finally, the paper
recommends the investment in Tesla or its competitors based on this risk return
analysis.
2. Tesla, Inc. (TSLA) Risk Analysis.
2.1. Tesla’s description and its interesting details.
Tesla, Inc. is a US based electric-vehicle and clean-energy firm with its headquarters
in Palo Alto, California. It was founded in 2003 by a Martin Eberhard and Marc
Tarpenning with a dream of manufacturing electric vehicles that are better than
gasoline driven cars in term of looks and performance. Two segments in which the
firm operates are Automotive segment and Energy generation & storage segment.
The Automotive segment is in the business of designing, developing, manufacturing
and selling electric-vehicles. The Energy generation & storage segment is in the
business of designing, manufacturing, installing, and selling/leasing of solar energy
systems and energy storage products for use in commercial places, residential
places and utility sites (Tesla, n.d.).
I find Tesla interesting due to its focus on sustainability and innovation. I admire its
electric vehicles particularly Model X and Model S that are among the cars with
fastest acceleration. These vehicles have great performance and advanced features
alongside the environmental advantages because of no emission. The amazing thing
about Tesla is that it is more like a software company as their cars are updated
quickly to include new features because to their advanced technological capabilities.
Also, I really like Tesla’s CEO Elon Musk because of his agenda of a sustainable
future. He advocates the use of the clean energy and innovative products to address
the existing issue of the carbon crisis. To promote the advent of sustainable
transport, Tesla had made all its patents free to use for anyone. So, I have chosen
Tesla for this analysis as I like its awesome electric cars and its vision of a better and
more sustainable future.
2.2. Tesla’s beta and its risk characteristics.
Beta of Tesla based on 5-year monthly return = 0.73 (Yahoo Finance, n.d.).
Beta measures the volatility of the stock in comparison to the market. It tells us that
how risky the stock is relative to the overall market. Beta equal to one means that the
stock moves with the market. Beta lower than one means that the stock is less
volatile than the market. Beta greater than one means that the stock is more volatile
than the market (Vishwanath, 2007). Based on the beta of 0.73, Tesla appears to
have low risk. It means that this stock is less volatile than the market. So, if the
market declines by 10% then Tesla stock will decline by 7.3% that is less as
compared to the market.
2.3. Tesla’s stock price movements and its overall riskiness.
On analyzing the movement of the Tesla’s stock, it is observed that the highest price
the stock has been over the last year is 917.42 (Google Finance, 2020) and the
lowest price of the stock over the last year is 178.97 (Google Finance, 2020). The
five-year pattern of the Tesla stock’s movement is shown below (Google Finance,
2020):
⊘ This is a preview!⊘
Do you want full access?
Subscribe today to unlock all pages.
Trusted by 1+ million students worldwide
1 out of 16

Your All-in-One AI-Powered Toolkit for Academic Success.
+13062052269
info@desklib.com
Available 24*7 on WhatsApp / Email
![[object Object]](/_next/static/media/star-bottom.7253800d.svg)
Unlock your academic potential
Copyright © 2020–2026 A2Z Services. All Rights Reserved. Developed and managed by ZUCOL.