An Investigation into Test Anxiety, Study Habits and Exam Results
VerifiedAdded on 2021/01/13
|13
|2862
|137
Report
AI Summary
This study investigated the relationship between test anxiety, study time, and test performance among third-year psychology undergraduates at the University of Bedfordshire. Using a modified Spielberger Test Anxiety Inventory (TAI) and collecting data on study hours and exam scores, the researchers found a significant inverse relationship between test anxiety and both revision study time and test performance. Higher revision study time correlated with lower test anxiety, and higher test anxiety correlated with lower test scores. The study also revealed a positive relationship between revision study time and test performance, though the variance explained was relatively low. Multiple linear regression analysis further confirmed these relationships, highlighting the importance of both test anxiety and study habits in predicting academic success. The findings support previous research on the negative impact of test anxiety on performance and underscore the value of effective study strategies.

1
Paraphrase This Document
Need a fresh take? Get an instant paraphrase of this document with our AI Paraphraser
2
Abstract
This study explores the relationship between test anxiety, hours of study, and
test score. The role of gender and age in the participants' level of test anxiety
was taken into consideration. To this end, students were selected if they studied
Psychology at the undergraduate level. Participants were aged between 18 and
25. They all were in their third year of Psychology (N=103). The test anxiety
inventory developed by Spielberger (1980) was modified to a 100mm ruler scale
(20 item short version) was administered to the participants. Participants were
asked to respond by choosing between "almost never" (0mm) and "almost
always" (100mm). A significant equation was found for predicting participants'
TAI scores based on their Revision study time (F (1,101) = 102.233, p < .001),
with an R² of .503. A similar relationship was seen when predicting a participants'
test performance based on their TAI score. A significant regression equation was
found (F (1,101) = 24.384, p < .001), with an R² of .194. Meanwhile, there was
seen to be a positive relationship between the test performance and revision
study time. Although variance found was low with 15.7%, but when a multiple
linear regression was carried out for test performance against both TAI score and
revision study time, the variance was seen to be 20.9%
3
Test Anxiety, Study time and Test performance
Anxiety is an emotional state of fear, worry, hesitation, nervousness, and
panic with somatic symptoms (Crooks & Stein, 1988). Tests' are methods of
assessing individuals to set them apart from others to achieve a goal. These
assessments can come in various forms, such as written, physical, aptitude,
achievements, and mental ability tests. Test anxiety can occur before a test is
judged by others (Birjandi & Alemi, 2010). Many individuals, generally, go
through some form of test anxiety, though over time, research has focused more
on students. Test anxiety is prevalent among the student population (Dalkiran,
Şahin Baltaci, Karatas, & Nacakci, 2016; Lowe & Ang, 2012).
Test anxiety can be caused by many different factors, such as fear of
failure, previous history of poor performances, poor study skills, generalised
anxiety disorder, pressure or judgment from others, and the individuals'
background. There are three components of test anxiety (Zeidner, 1998). These
are cognitive, affective, and behavioural.
Test anxiety has been associated with a negative impact on test
performance. However, the two variables are not causally related, as the
variance is low. A study found that test anxiety, study habits and subject skill
together accounted for 25% of the criterion variance (Musch & Broder, 1999).
(Musch & Broder, 1999) concluded that academic skills are as essential as test
anxiety.
There have several theories that have tried to explain test anxiety and its
impact on test performance. These include Cognitive Test Anxiety, Emotionality
⊘ This is a preview!⊘
Do you want full access?
Subscribe today to unlock all pages.
Trusted by 1+ million students worldwide
4
and Attentional theories. These theories have led intervention studies to be done
to reduce test anxiety in student populations such as (Balogun, Balogun, &
Onyencho, 2017; DordiNejad et al., 2011; Mamasseh, 2013; Mohamadi, Alishahi,
& Soleimani, 2014). The majority of test anxiety intervention studies have used
the Spielberg 1980 Test Anxiety Inventory (TAI) as their primary outcome
parameter.
The test anxiety inventory has been shown to have good test-retest
reliability (r = .80) and good convergent validity (Szafranski, Barrera, & Norton,
2012). Though several studies have tried to elicit the relationship between study
skills, test anxiety and test performance, the outcomes have been relatively
similar. This study would aim to understand the relationship between test anxiety
and revision study time and to revalidate the relationship between test anxiety
and test performance. Also, the study aims to assess the relationship between
revision study time and test performance. Finally, to find the combined variance
of test anxiety and revision study time against test performance.
Method
Design:
The institutional review board (IRB) approved the following research
design. The study is a quantitative study using both descriptive and regression
for analysis of the data. Data collected were the age, gender, study revision
hours, test anxiety inventory score and test score. Test anxiety is the
independent variable, academic performance and study hours are the dependent
variables. SPSS 26 was used for the analysis of the data.
Paraphrase This Document
Need a fresh take? Get an instant paraphrase of this document with our AI Paraphraser
5
Participants:
We studied consenting participants comprised of 103 (52 males and 51
females) third-year psychology undergraduates. All enrolled in the University of
Bedfordshire, Luton campus. The students had attended a minimum of 75% of
their developmental psychology classes and had taken the examination held that
semester. The participants' ages ranged between 18 and 25 years (M = 21.84,
SD = 2.38). The participants were recruited via emails sent out to the entire
class, leaflets and posters advertised in the psychology department hallway.
Materials:
Demographic characteristics
Relevant data was gathered through the use of a validated questionnaire
with four sections. The first section of the questionnaire elicited participants'
socio-demographic information such as age, gender, academic level, and faculty.
In the second section, the participants were asked to indicate their test score
from the developmental psychology exam, which was further verified from the
department. The third and fourth sections contained test anxiety measures and
daily revision study hours leading up to the exam.
Test Anxiety Inventory
This was measured using a modified self-reported 20-item Test Anxiety
inventory developed by Spielberger (1980), modified to 100mm ruler scale. The
TAI is widely used in research and clinical settings and provides reliable (α
coefficient of 0.9) assessment of acute anxiety. After TAI was introduced more
than 30 years ago, the TAI has been translated and adapted in 48 languages and
6
used to measure anxiety in more than 6,000 studies. The TAI has particular
application to the assessment and treatment of test anxiety in student population.
The students were asked to report how often they experience specific anxiety
symptoms before, during, and after the examination. It consists of three
subscales. Each subscale consists of eight items, which are to be rated on a
four-point Likert scale (1=almost never; 2=sometimes; 3=often; 4=almost
always). The modified 100mm scale required the students to respond by moving
a line between "Almost Never" (0mm) to "Almost Always" (100mm). Higher
scores mean more self-reported test anxiety. Scores in mm are averaged across
the 20 items to obtain the TAI-T (total test anxiety inventory score).
In responding to the 20-item Likert-type TAI questionnaire, students self-
reported the intensity of their feelings at a particular time (i.e., at the time of the
examinations). The TAI consists of 2 subscales for measuring emotionality and
worry, which appear to be the significant test anxiety components (HUXHAM,
LIPTON, & CUMMINS, 1976). Eight questionnaire items make up an emotionality
subscale (the autonomic nervous system reactions evoked by the evaluated
stress). Eight things make up a worry subscale (cognitive concerns about the
consequences of failure that interfere with attention). Subscale scores range from
8 to 32 points. The remaining 4 TAI items are used to derive the total score.
Given the scale of 1 to 4 for each of the 20 items, the range of possible scores,
could vary from a minimum of 20 to a maximum of 80. Although norms are not
available for medical students, the questionnaire is reported to have excellent
⊘ This is a preview!⊘
Do you want full access?
Subscribe today to unlock all pages.
Trusted by 1+ million students worldwide
7
psychometric properties in college and high school students. (Spielberger &
Sapp, 1999)
Procedure:
The participants were recruited via posters, leaflets, and Email. The
students were informed at the end of their developmental psychology exam of
the study and were given handouts. Posters of the survey were advertised in the
psychology department hallways and emails sent out to all the students. They
were asked to access the questionnaire online with the link provided. Consents
were taken online before the questionnaire could be filled. Participants were
advised that they could withdraw at any time, and their data kept confidential.
Incentives were given, in the form of either amazon £10 gift card or a chance to
win £100 from a raffle draw, depending on their choice. All students participated
(100% feedback). After the responses were collated and analysed, a descriptive
and regression analysis was completed, and the results were interpreted. The
analysis was done in line with the hypothesis of less test anxiety score having a
positive impact on the test performance and the more the number of hours spent
revising positively affected test anxiety.
Results
The study set out to investigate two hypotheses. First, there would be a
positive impact on the TAI score with an increase in revision study time. The
figure below shows an increase in the participants' revision study time, resulting
Paraphrase This Document
Need a fresh take? Get an instant paraphrase of this document with our AI Paraphraser
8
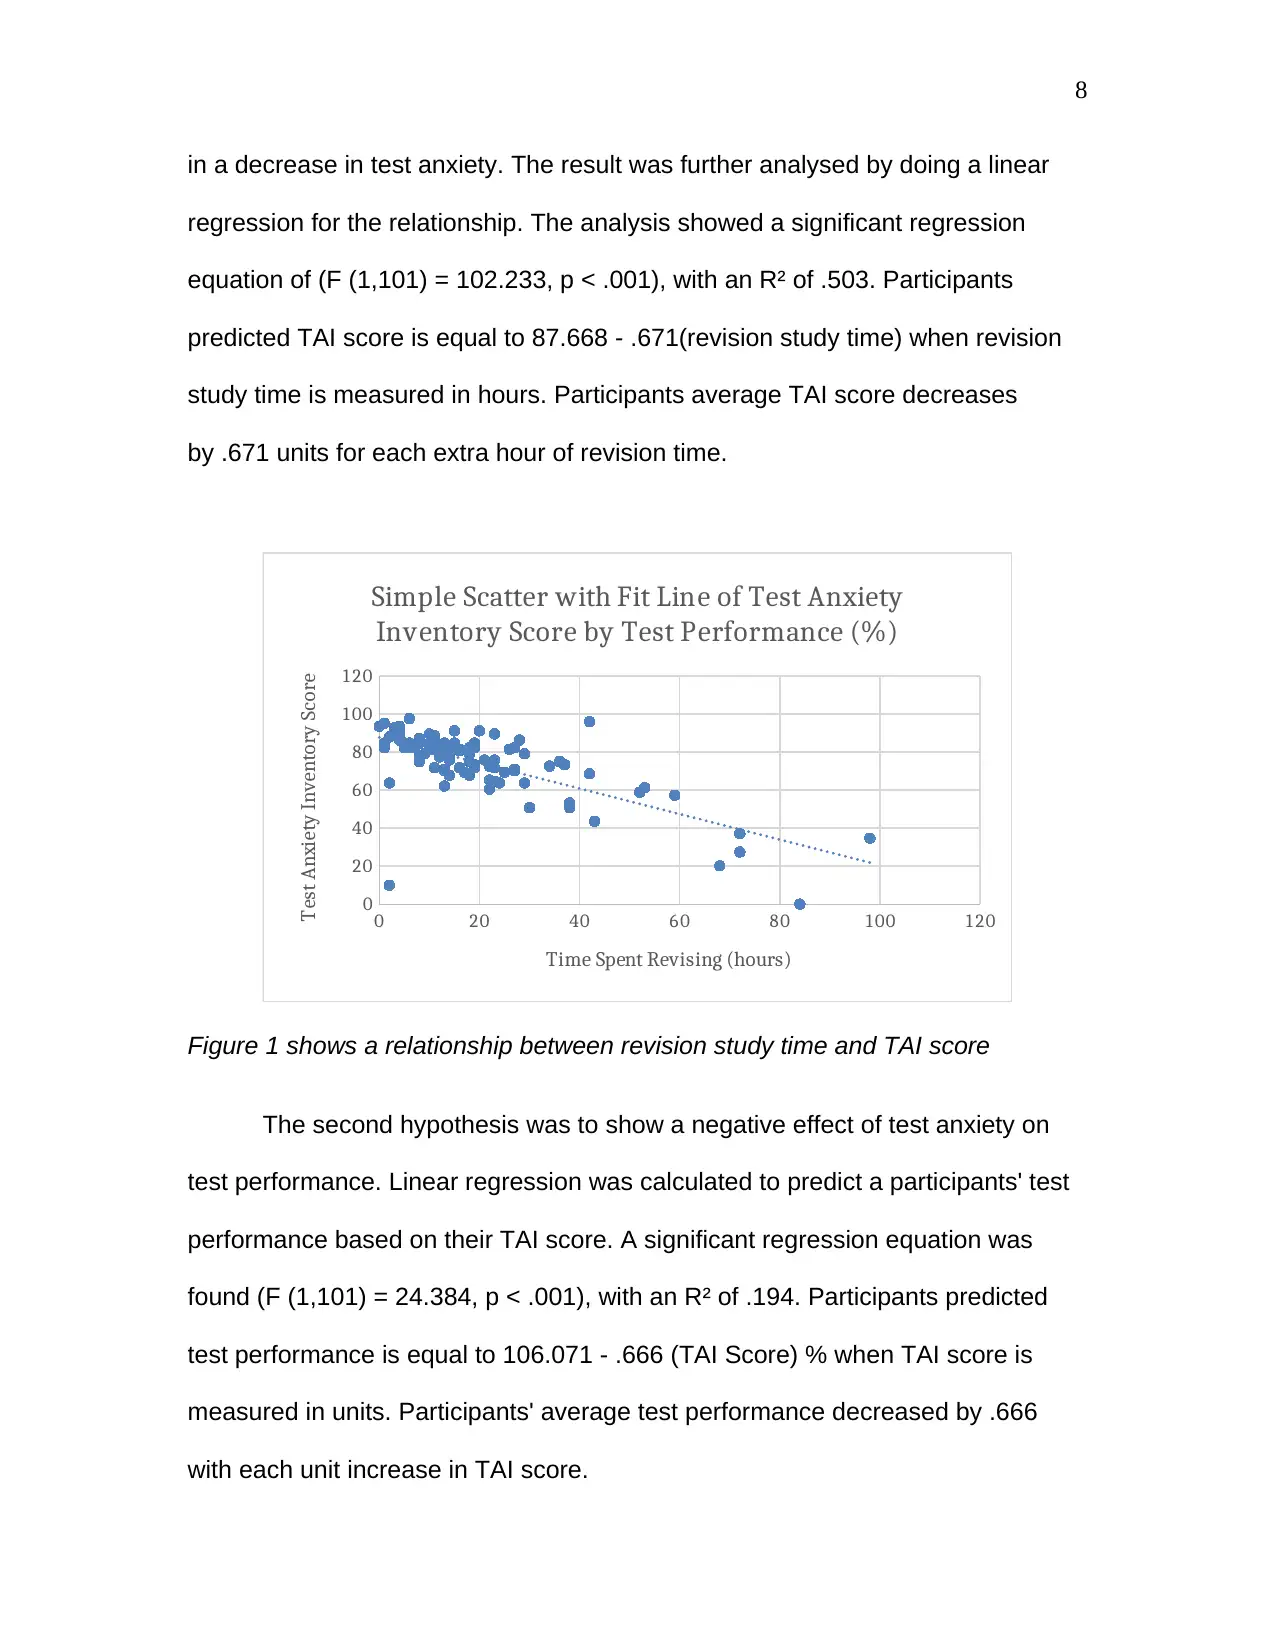
in a decrease in test anxiety. The result was further analysed by doing a linear
regression for the relationship. The analysis showed a significant regression
equation of (F (1,101) = 102.233, p < .001), with an R² of .503. Participants
predicted TAI score is equal to 87.668 - .671(revision study time) when revision
study time is measured in hours. Participants average TAI score decreases
by .671 units for each extra hour of revision time.
0 20 40 60 80 100 120
0
20
40
60
80
100
120
Simple Scatter with Fit Line of Test Anxiety
Inventory Score by Test Performance (%)
Time Spent Revising (hours)
Test Anxiety Inventory Score
Figure 1 shows a relationship between revision study time and TAI score
The second hypothesis was to show a negative effect of test anxiety on
test performance. Linear regression was calculated to predict a participants' test
performance based on their TAI score. A significant regression equation was
found (F (1,101) = 24.384, p < .001), with an R² of .194. Participants predicted
test performance is equal to 106.071 - .666 (TAI Score) % when TAI score is
measured in units. Participants' average test performance decreased by .666
with each unit increase in TAI score.
9
Linear regression was done to see the relationship between exam
performance and revision study time and a significant regression equation was
found (F (1,101) = 18.865, p < .001), with an R² of .157. Participants predicted
that test performance was equal to 45.321 + .567(revision study time) % when
revision study time is measured in hours. Participants average test performance
increased by .567% for each hour of revision study time.
A simple multiple linear regression was done to find the relationship
between exam performance against both test anxiety and revision time. The
variance was found to be 20.9% and was significant (p<.001).
Discussion
This study result shows that there is an inverse relationship between test
anxiety and test performance which is in keeping with the previous study and that
the level of variance is low but still significant as found by (Musch & Broder,
1999).
The study also found that there was a similar inverse trend for the
relationship between test anxiety and revision study time. No other study was
found to have reported this specific relationship. However, there has been some
attempt to compare test anxiety with study skills, which involves several factors
(D, Ed, & Ed, 2013).
The relationship for test performance against revision study time was
found to be a positive one, but with a low variance of 15.7%. Although a multiple
linear regression was done, the results show a 20.9% variance, which is not too
⊘ This is a preview!⊘
Do you want full access?
Subscribe today to unlock all pages.
Trusted by 1+ million students worldwide
10
different from the results (Musch & Broder, 1999). This indicates that the TAI
scale developed by Spielberg 1980 still has reliability and validity even after 40
years.
different from the results (Musch & Broder, 1999). This indicates that the TAI
scale developed by Spielberg 1980 still has reliability and validity even after 40
years.
Paraphrase This Document
Need a fresh take? Get an instant paraphrase of this document with our AI Paraphraser
11
References
Balogun, A. G., Balogun, S. K., & Onyencho, C. V. (2017). Test Anxiety and
Academic Performance among Undergraduates: The Moderating Role of
Achievement Motivation. Spanish Journal of Psychology, 20(February).
https://doi.org/10.1017/sjp.2017.5
Birjandi, P., & Alemi, M. (2010). The Impact of Test Anxiety on Test Performance
among Iranian EFL Learners. BRAIN. Broad Research in Artificial
Intelligence and Neuroscience Autumn, 1(4), 44–58. Retrieved from
https://www.edusoft.ro/brain/index.php/brain/article/view/131/260
Crooks, R. L., & Stein, J. (1988). Psychology: Science, behaviour and life. In
Psychology: Science, behaviour and life. Fort Worth, TX, England: Holt,
Rinehart & Winston Inc.
D, D. N. P., Ed, O. V. M., & Ed, C. L. M. (2013). Influence of Study Skills on Test
Anxiety of Secondary School Students in Nsukka Urban, Enugu State,
Nigeria. 4(17), 162–166.
Dalkiran, E., Şahin Baltaci, H., Karatas, Z., & Nacakci, Z. (2016). Developing of
Individual Instrument Performance Anxiety Scale: ValidityReliability Study.
International Journal of Assessment Tools in Education, 1(22374), 13–25.
https://doi.org/10.21449/ijate.239569
DordiNejad, F. G., Hakimi, H., Ashouri, M., Dehghani, M., Zeinali, Z., Daghighi,
M. S., & Bahrami, N. (2011). On the relationship between test anxiety and
academic performance. Procedia - Social and Behavioral Sciences.
https://doi.org/10.1016/j.sbspro.2011.04.372
12
HUXHAM, G. J., LIPTON, A., & CUMMINS, R. A. (1976). Student test type
preference and its relation to personality and achievement. Medical
Education, 10(2), 90–96. https://doi.org/10.1111/j.1365-2923.1976.tb00538.x
Lowe, P. A., & Ang, R. P. (2012). A cross-cultural examination of test anxiety
among US and Singapore students on the Test Anxiety Scale for Elementary
Students (TAS-E). Educational Psychology, 32(1), 107–126.
https://doi.org/10.1080/01443410.2011.625625
Mamasseh, I. (2013). Effect of test anxiety, gender and perceived self-concept
on the academic performance of Nigerian students. International Journal of
Psychology and Counselling, 5(7), 143–146.
https://doi.org/10.5897/IJPC2013.0218
Mohamadi, M., Alishahi, Z., & Soleimani, N. (2014). A Study on Test Anxiety and
its Relationship to Test Score and Self-actualization of Academic EFL
Students in Iran. Procedia - Social and Behavioral Sciences, 98, 1156–1164.
https://doi.org/10.1016/j.sbspro.2014.03.529
Musch, J., & Broder, A. (1999). Test anxiety versus academic skills: A
comparison of two alternative models for predicting performance in a
statistics exam. British Journal of Educational Psychology, 69(1), 105–116.
https://doi.org/10.1348/000709999157608
Spielberger, C. D., & Sapp, M. (1999). Test Anxiety: Applied Research,
Assessment, and Treatment Interventions. In Maryland University Press of
America. Retrieved from https://books.google.co.uk/books?
hl=en&lr=&id=O25BAgAAQBAJ&oi=fnd&pg=PR5&dq=Sapp+M+Test+Anxiet
⊘ This is a preview!⊘
Do you want full access?
Subscribe today to unlock all pages.
Trusted by 1+ million students worldwide
1 out of 13

Your All-in-One AI-Powered Toolkit for Academic Success.
+13062052269
info@desklib.com
Available 24*7 on WhatsApp / Email
![[object Object]](/_next/static/media/star-bottom.7253800d.svg)
Unlock your academic potential
Copyright © 2020–2026 A2Z Services. All Rights Reserved. Developed and managed by ZUCOL.