Financial Analysis and Valuation of Texas Roadhouse Inc. Shares

Verified

Added on  2023/04/23

|6
|1248
|457
Case Study
AI Summary
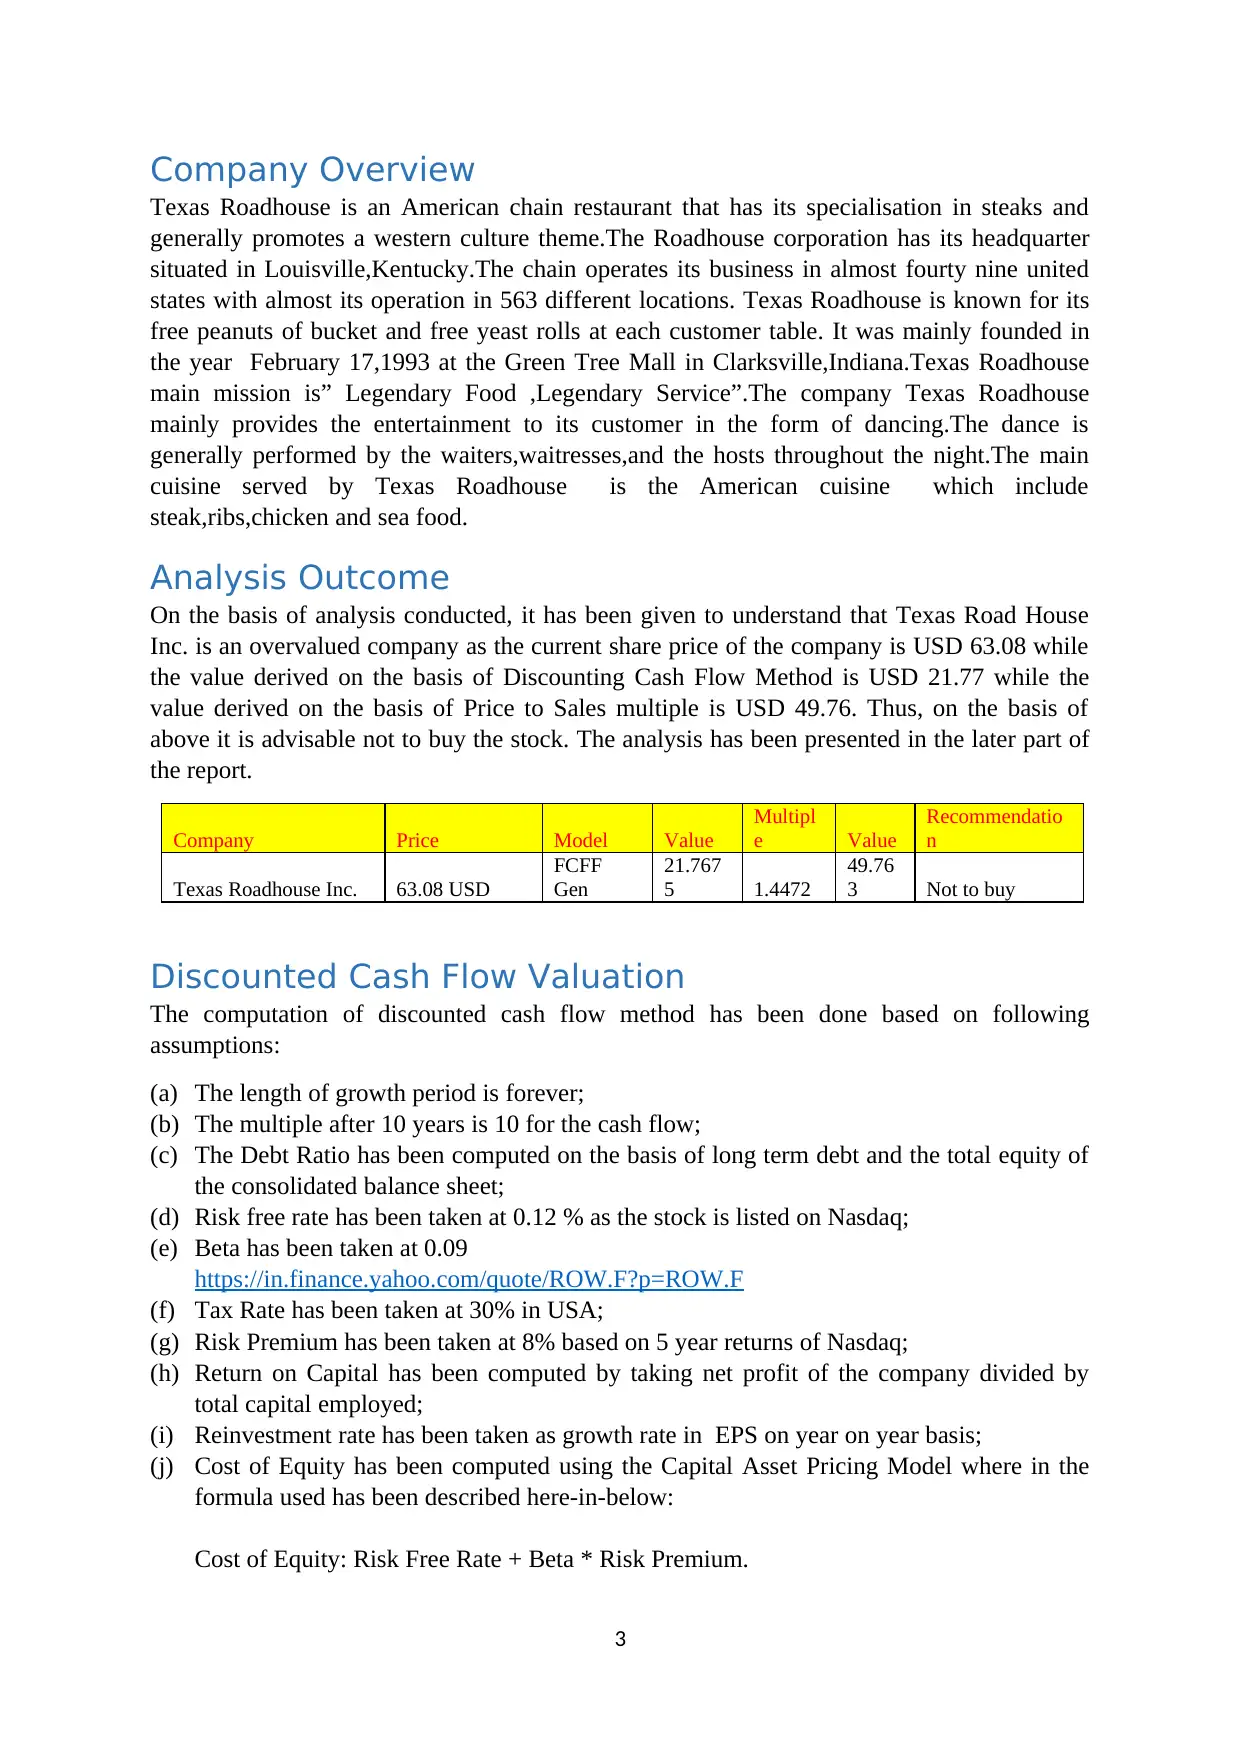
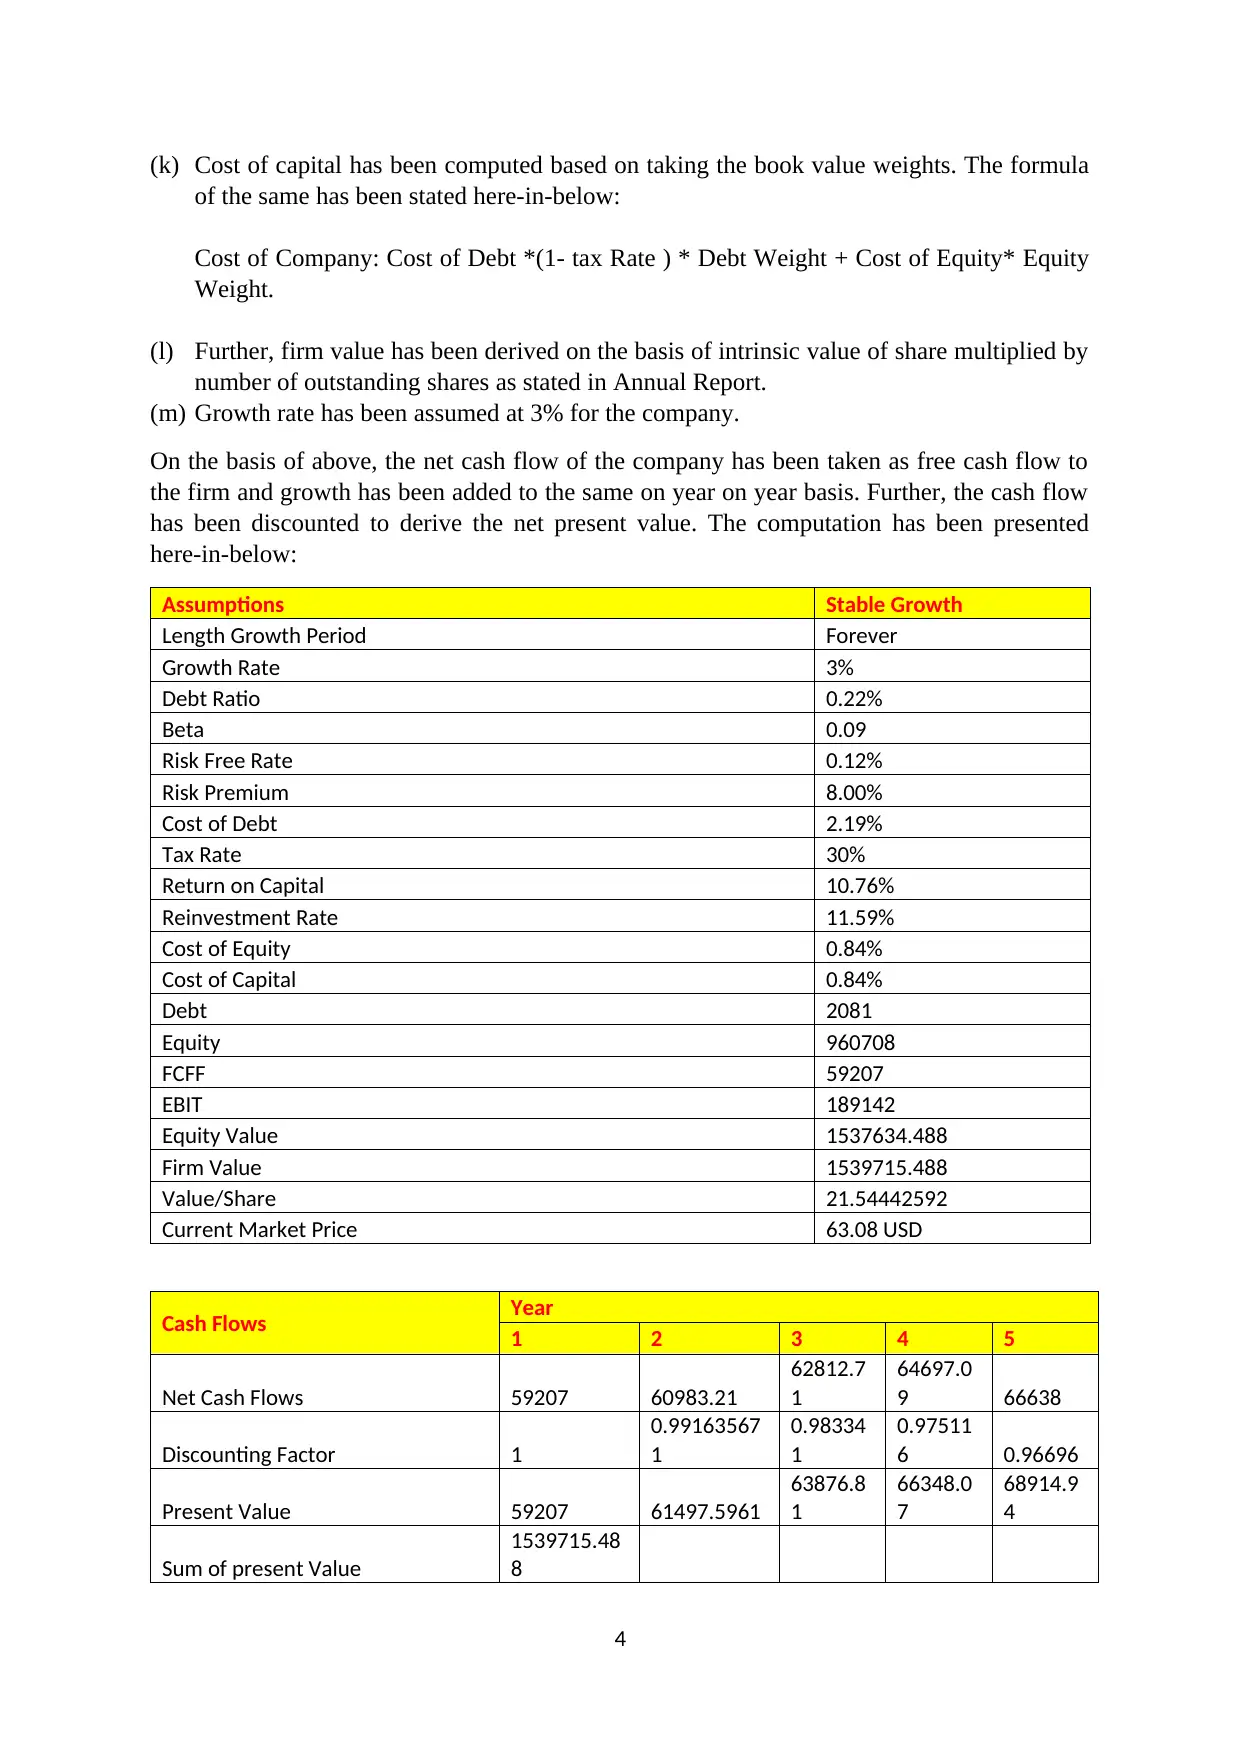
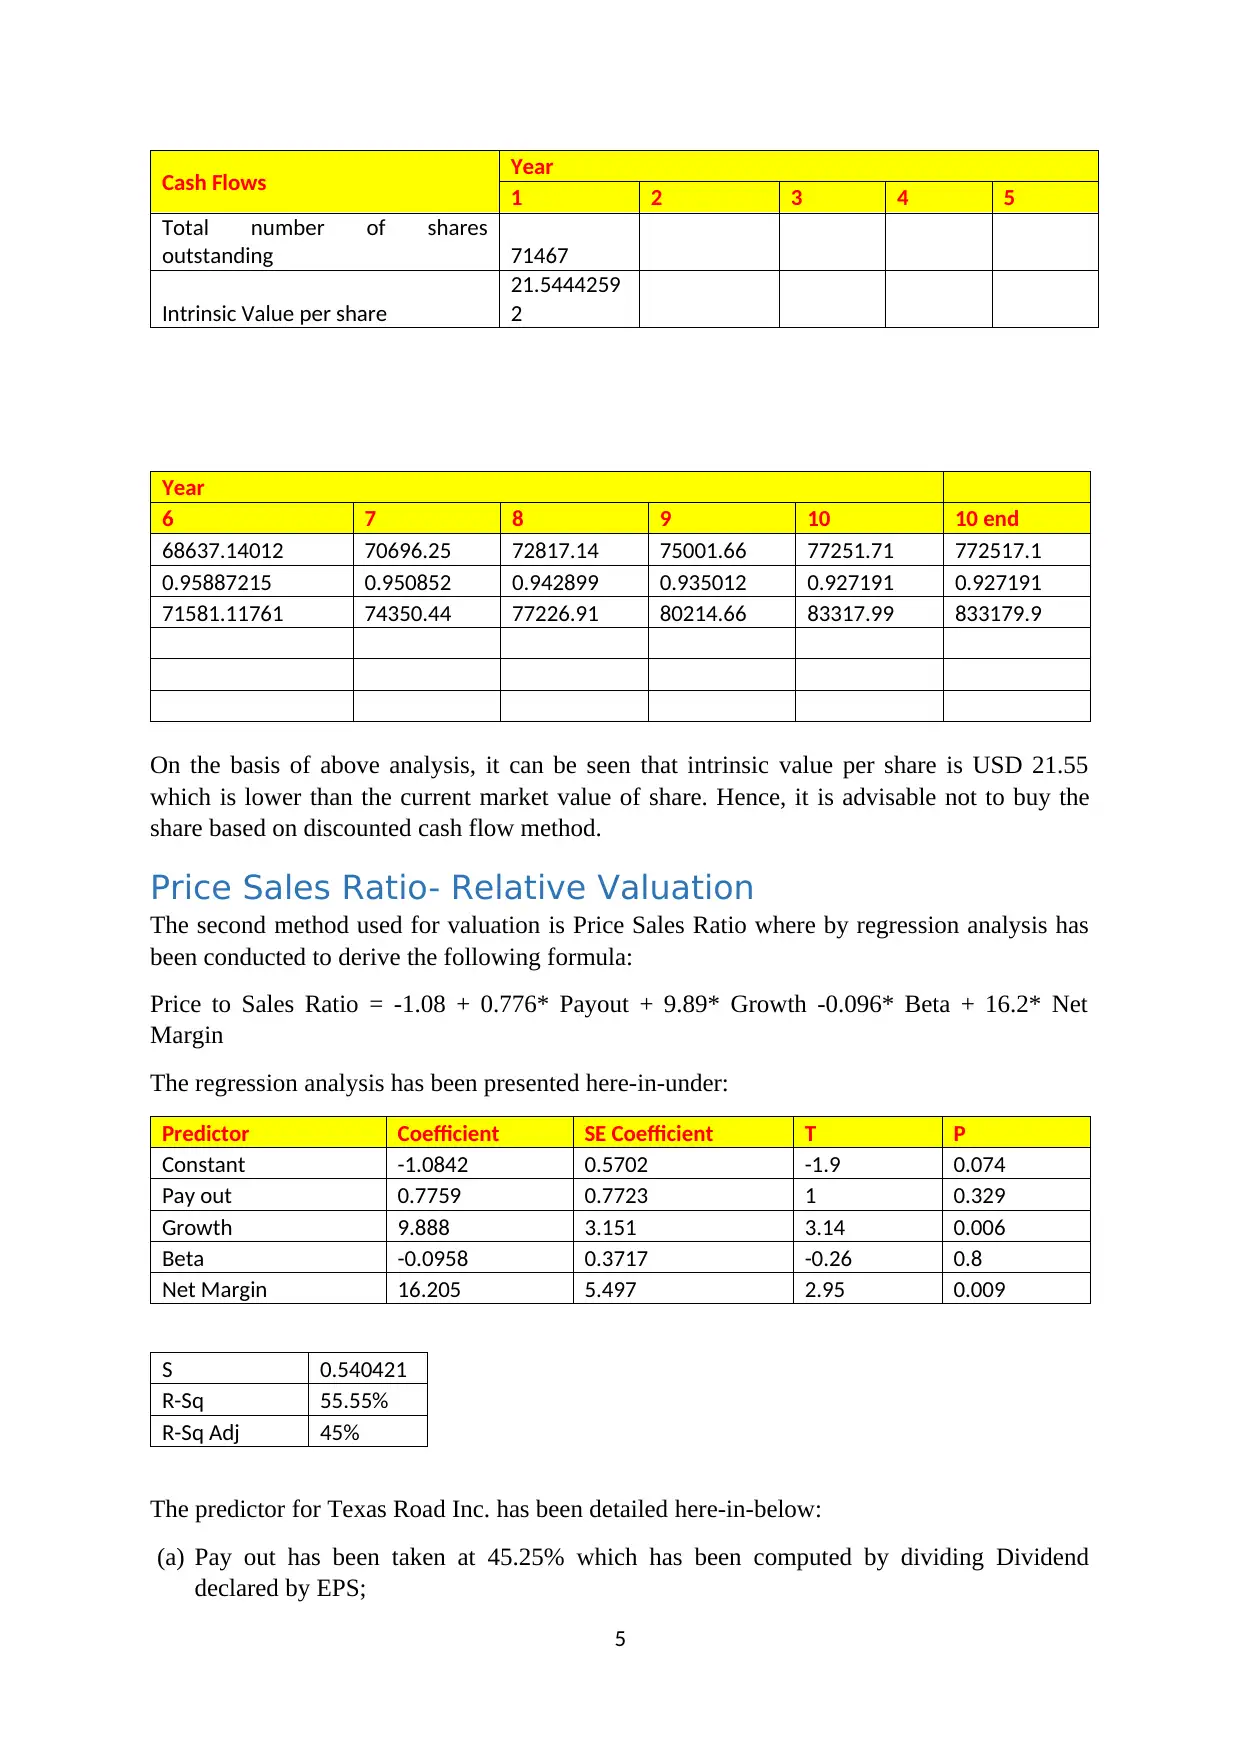
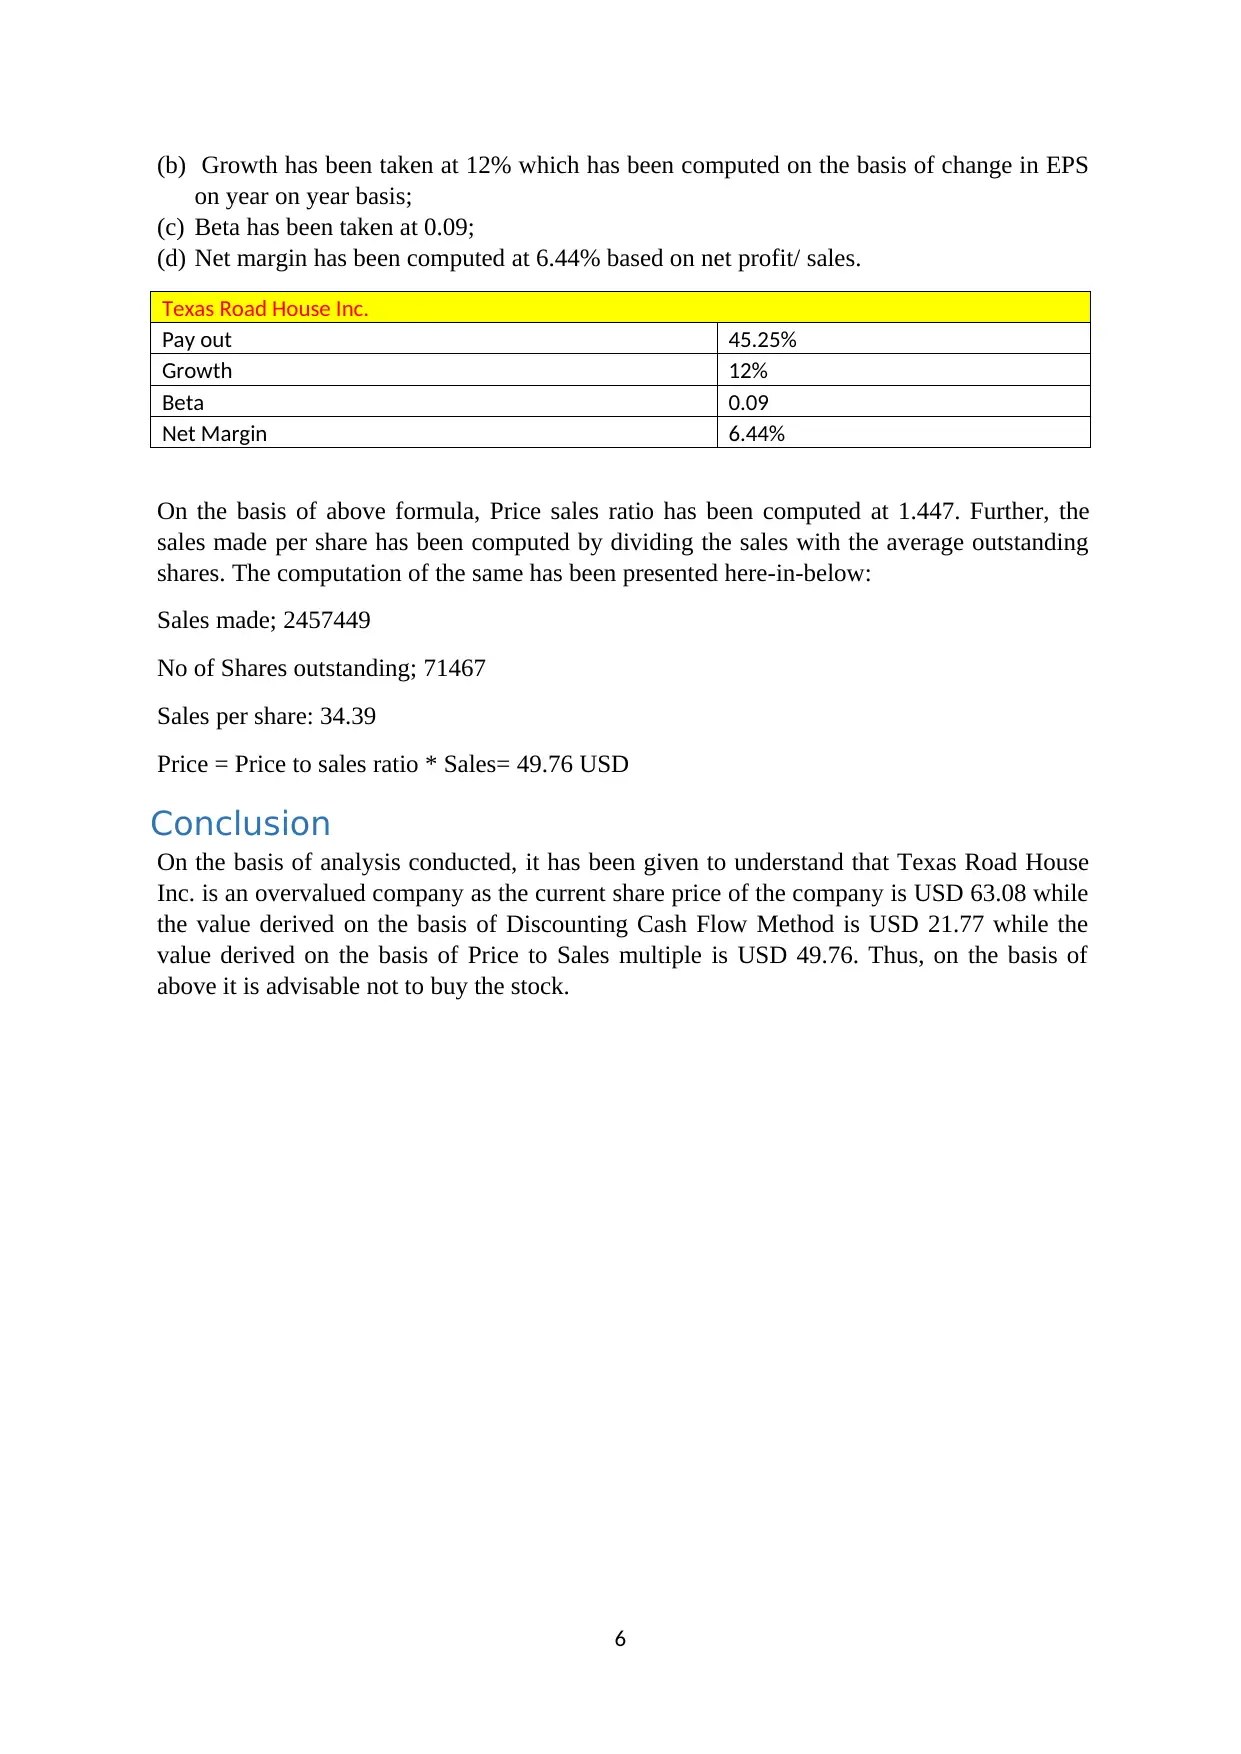
This case study provides a comprehensive business valuation and financial analysis of Texas Roadhouse Inc., utilizing both Discounted Cash Flow (DCF) and Price to Sales Ratio (PSR) methods. The analysis reveals that the company's stock may be overvalued, with the DCF method suggesting a value of USD 21.77 per share compared to the current market price of USD 63.08, and the PSR method indicating a value of USD 49.76. The DCF valuation incorporates assumptions such as a stable growth period, a terminal multiple of 10, and a 3% growth rate. The PSR valuation employs a regression analysis formula incorporating payout, growth, beta, and net margin. Based on these valuations, the recommendation is not to buy Texas Roadhouse Inc. stock. Desklib provides access to similar solved assignments and resources for students.
Document Page
Business Valuation and Analysis
1
tabler-icon-diamond-filled.svg

Paraphrase This Document

Need a fresh take? Get an instant paraphrase of this document with our AI Paraphraser
Document Page
Index
Contents
Index......................................................................................................................................................2
Company Overview...............................................................................................................................3
Analysis Outcome..................................................................................................................................3
Discounted Cash Flow Valuation...........................................................................................................3
Price Sales Ratio....................................................................................................................................5
Conclusion.............................................................................................................................................6
2
Document Page
Company Overview
Texas Roadhouse is an American chain restaurant that has its specialisation in steaks and
generally promotes a western culture theme.The Roadhouse corporation has its headquarter
situated in Louisville,Kentucky.The chain operates its business in almost fourty nine united
states with almost its operation in 563 different locations. Texas Roadhouse is known for its
free peanuts of bucket and free yeast rolls at each customer table. It was mainly founded in
the year February 17,1993 at the Green Tree Mall in Clarksville,Indiana.Texas Roadhouse
main mission is” Legendary Food ,Legendary Service”.The company Texas Roadhouse
mainly provides the entertainment to its customer in the form of dancing.The dance is
generally performed by the waiters,waitresses,and the hosts throughout the night.The main
cuisine served by Texas Roadhouse is the American cuisine which include
steak,ribs,chicken and sea food.
Analysis Outcome
On the basis of analysis conducted, it has been given to understand that Texas Road House
Inc. is an overvalued company as the current share price of the company is USD 63.08 while
the value derived on the basis of Discounting Cash Flow Method is USD 21.77 while the
value derived on the basis of Price to Sales multiple is USD 49.76. Thus, on the basis of
above it is advisable not to buy the stock. The analysis has been presented in the later part of
the report.
Company Price Model Value
Multipl
e Value
Recommendatio
n
Texas Roadhouse Inc. 63.08 USD
FCFF
Gen
21.767
5 1.4472
49.76
3 Not to buy
Discounted Cash Flow Valuation
The computation of discounted cash flow method has been done based on following
assumptions:
(a) The length of growth period is forever;
(b) The multiple after 10 years is 10 for the cash flow;
(c) The Debt Ratio has been computed on the basis of long term debt and the total equity of
the consolidated balance sheet;
(d) Risk free rate has been taken at 0.12 % as the stock is listed on Nasdaq;
(e) Beta has been taken at 0.09
https://in.finance.yahoo.com/quote/ROW.F?p=ROW.F
(f) Tax Rate has been taken at 30% in USA;
(g) Risk Premium has been taken at 8% based on 5 year returns of Nasdaq;
(h) Return on Capital has been computed by taking net profit of the company divided by
total capital employed;
(i) Reinvestment rate has been taken as growth rate in EPS on year on year basis;
(j) Cost of Equity has been computed using the Capital Asset Pricing Model where in the
formula used has been described here-in-below:
Cost of Equity: Risk Free Rate + Beta * Risk Premium.
3
Document Page
(k) Cost of capital has been computed based on taking the book value weights. The formula
of the same has been stated here-in-below:
Cost of Company: Cost of Debt *(1- tax Rate ) * Debt Weight + Cost of Equity* Equity
Weight.
(l) Further, firm value has been derived on the basis of intrinsic value of share multiplied by
number of outstanding shares as stated in Annual Report.
(m) Growth rate has been assumed at 3% for the company.
On the basis of above, the net cash flow of the company has been taken as free cash flow to
the firm and growth has been added to the same on year on year basis. Further, the cash flow
has been discounted to derive the net present value. The computation has been presented
here-in-below:
Assumptions Stable Growth
Length Growth Period Forever
Growth Rate 3%
Debt Ratio 0.22%
Beta 0.09
Risk Free Rate 0.12%
Risk Premium 8.00%
Cost of Debt 2.19%
Tax Rate 30%
Return on Capital 10.76%
Reinvestment Rate 11.59%
Cost of Equity 0.84%
Cost of Capital 0.84%
Debt 2081
Equity 960708
FCFF 59207
EBIT 189142
Equity Value 1537634.488
Firm Value 1539715.488
Value/Share 21.54442592
Current Market Price 63.08 USD
Cash Flows Year
1 2 3 4 5
Net Cash Flows 59207 60983.21
62812.7
1
64697.0
9 66638
Discounting Factor 1
0.99163567
1
0.98334
1
0.97511
6 0.96696
Present Value 59207 61497.5961
63876.8
1
66348.0
7
68914.9
4
Sum of present Value
1539715.48
8
4
tabler-icon-diamond-filled.svg

Paraphrase This Document

Need a fresh take? Get an instant paraphrase of this document with our AI Paraphraser
Document Page
Cash Flows Year
1 2 3 4 5
Total number of shares
outstanding 71467
Intrinsic Value per share
21.5444259
2
Year
6 7 8 9 10 10 end
68637.14012 70696.25 72817.14 75001.66 77251.71 772517.1
0.95887215 0.950852 0.942899 0.935012 0.927191 0.927191
71581.11761 74350.44 77226.91 80214.66 83317.99 833179.9
On the basis of above analysis, it can be seen that intrinsic value per share is USD 21.55
which is lower than the current market value of share. Hence, it is advisable not to buy the
share based on discounted cash flow method.
Price Sales Ratio- Relative Valuation
The second method used for valuation is Price Sales Ratio where by regression analysis has
been conducted to derive the following formula:
Price to Sales Ratio = -1.08 + 0.776* Payout + 9.89* Growth -0.096* Beta + 16.2* Net
Margin
The regression analysis has been presented here-in-under:
Predictor Coefficient SE Coefficient T P
Constant -1.0842 0.5702 -1.9 0.074
Pay out 0.7759 0.7723 1 0.329
Growth 9.888 3.151 3.14 0.006
Beta -0.0958 0.3717 -0.26 0.8
Net Margin 16.205 5.497 2.95 0.009
S 0.540421
R-Sq 55.55%
R-Sq Adj 45%
The predictor for Texas Road Inc. has been detailed here-in-below:
(a) Pay out has been taken at 45.25% which has been computed by dividing Dividend
declared by EPS;
5
Document Page
(b) Growth has been taken at 12% which has been computed on the basis of change in EPS
on year on year basis;
(c) Beta has been taken at 0.09;
(d) Net margin has been computed at 6.44% based on net profit/ sales.
Texas Road House Inc.
Pay out 45.25%
Growth 12%
Beta 0.09
Net Margin 6.44%
On the basis of above formula, Price sales ratio has been computed at 1.447. Further, the
sales made per share has been computed by dividing the sales with the average outstanding
shares. The computation of the same has been presented here-in-below:
Sales made; 2457449
No of Shares outstanding; 71467
Sales per share: 34.39
Price = Price to sales ratio * Sales= 49.76 USD
Conclusion
On the basis of analysis conducted, it has been given to understand that Texas Road House
Inc. is an overvalued company as the current share price of the company is USD 63.08 while
the value derived on the basis of Discounting Cash Flow Method is USD 21.77 while the
value derived on the basis of Price to Sales multiple is USD 49.76. Thus, on the basis of
above it is advisable not to buy the stock.
6
chevron_up_icon
1 out of 6
circle_padding
hide_on_mobile
zoom_out_icon
[object Object]