Corporate Finance Valuation of Telstra Company - TFIN501 Report
VerifiedAdded on 2022/12/15
|20
|4157
|153
Report
AI Summary
This report undertakes a valuation of Telstra Company, employing the discounted cash flow (DCF) method, with operating cash flows (OCF) as the primary input. The OCF for 2018 is calculated at $6,267 million, based on assumptions regarding cash revenues and expenses. A growth rate of 5.95% is used to forecast OCF for the next five years, and the Gordon growth model determines the terminal value at $6,19,427 million at period 5, utilizing a weighted average cost of capital (WACC) of 4% and a constant growth rate of 2.61%. This leads to a present value of Telstra of $5,42,267 million and an estimated share price of $44.17 as of July 30, 2018. The report compares this estimated price with the market price of $2.81, acknowledging potential discrepancies due to market conditions and model assumptions. The analysis includes detailed steps of the valuation process, from reconstructing the profit and loss statement to calculating the cost of equity, debt, and WACC, and finally determining the equity value and share price. The report also explores the sensitivity of the valuation to changes in growth rates and WACC.
Corporate Finance
Valuation of Telstra company
Student Name
Student Number
Course Code and Title
Due Date
Valuation of Telstra company
Student Name
Student Number
Course Code and Title
Due Date
Paraphrase This Document
Need a fresh take? Get an instant paraphrase of this document with our AI Paraphraser
Executive Summary
This report performs the valuation of Telstra Company. Discounted cash flows method is
used for the valuation of the company and the cash flows used for this purpose are the
company’s operating cash flows (OCF). The operating cash flows for 2018 are calculated at
6,267 ($m) after assuming that 81 per cent and 75 per cent of the operating revenues and
expenses respectively are in cash. The growth rate of 5.95 % is assumed to forecast the OCF
for next five years. The Gordon growth method assuming the constant perpetual growth rate
is used for calculating the terminal value of the company. Terminal value at period 5 is found
to be 6,19,427 ($m) using the weighted average cost of capital of 4 per cent and constant
growth rate of 2.61 per cent. This resulted in the present value of Telstra of 5,42,267 ($m)
and the estimated share price of 44.17 ($) on 30 July 2018. It is found that this estimated
price is different than the market price of 2.81 ($). This difference can be due to the prevalent
market conditions and sensitivity of the valuation model to various assumptions.
Contents
Introduction...........................................................................................................................................1
Telstra Valuation...................................................................................................................................1
Step 1: Reconstruction of the profit and loss statement in the format of Operating Cash flow..........1
Step 2: Forecasting the reconstructed P&L for the next 5 years........................................................3
Step 3: Calculating the after tax OCF for the next 5 years.................................................................4
Step 4: Calculating the terminal value (TV) at time 5........................................................................4
Step 5: Calculating the cost of equity (Re)........................................................................................5
Step 6: Calculating cost of debt (Rd).................................................................................................5
Step 7: Calculating Debt/Value and Equity/Value ratio from the Debt/Equity ratio..........................6
Step 8: Calculating the Weighted Cost of Capital (WACC or k).......................................................6
Step 9: Calculating the present value of the asset of your company at time zero...............................6
Step 10: Calculating the Equity Value..............................................................................................6
Step 11: Calculating the share price..................................................................................................7
Step 12: Comparing the estimated share price of Telstra with its market price.................................7
Conclusion.............................................................................................................................................8
Recommendations.................................................................................................................................9
References...........................................................................................................................................10
Appendices..........................................................................................................................................11
Appendix 1: Balance sheets and Profit & Loss statements..............................................................11
Appendix 2: Telstra’s operating revenues and expenses.................................................................15
Appendix 3: Assumptions used for forecasting next 5 years reconstructed profit and loss
statement........................................................................................................................................16
Appendix 4: Average GDP growth rate for estimating the perpetual growth rate of Telstra..........17
⊘ This is a preview!⊘
Do you want full access?
Subscribe today to unlock all pages.
Trusted by 1+ million students worldwide
Corporate Finance [Surname, Student ID #]
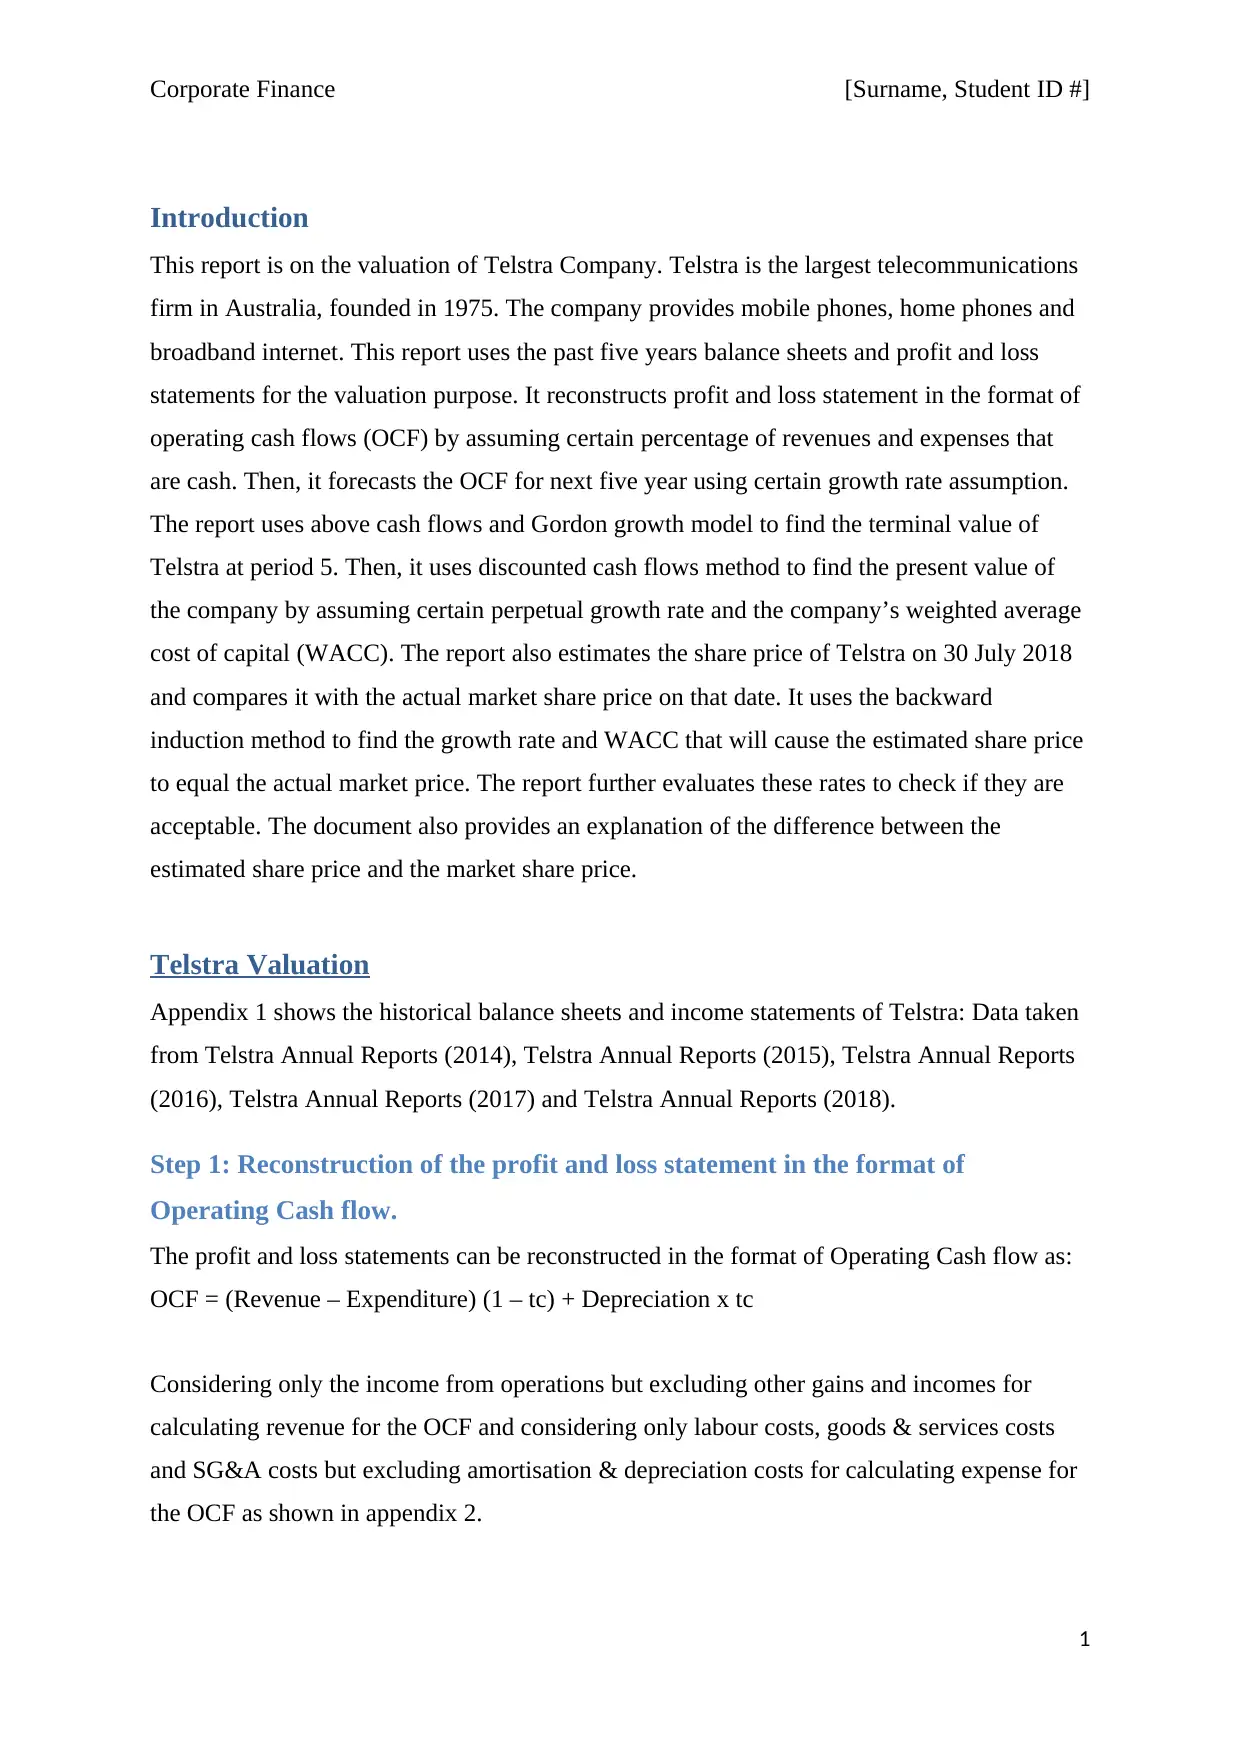
Introduction
This report is on the valuation of Telstra Company. Telstra is the largest telecommunications
firm in Australia, founded in 1975. The company provides mobile phones, home phones and
broadband internet. This report uses the past five years balance sheets and profit and loss
statements for the valuation purpose. It reconstructs profit and loss statement in the format of
operating cash flows (OCF) by assuming certain percentage of revenues and expenses that
are cash. Then, it forecasts the OCF for next five year using certain growth rate assumption.
The report uses above cash flows and Gordon growth model to find the terminal value of
Telstra at period 5. Then, it uses discounted cash flows method to find the present value of
the company by assuming certain perpetual growth rate and the company’s weighted average
cost of capital (WACC). The report also estimates the share price of Telstra on 30 July 2018
and compares it with the actual market share price on that date. It uses the backward
induction method to find the growth rate and WACC that will cause the estimated share price
to equal the actual market price. The report further evaluates these rates to check if they are
acceptable. The document also provides an explanation of the difference between the
estimated share price and the market share price.
Telstra Valuation
Appendix 1 shows the historical balance sheets and income statements of Telstra: Data taken
from Telstra Annual Reports (2014), Telstra Annual Reports (2015), Telstra Annual Reports
(2016), Telstra Annual Reports (2017) and Telstra Annual Reports (2018).
Step 1: Reconstruction of the profit and loss statement in the format of
Operating Cash flow.
The profit and loss statements can be reconstructed in the format of Operating Cash flow as:
OCF = (Revenue – Expenditure) (1 – tc) + Depreciation x tc
Considering only the income from operations but excluding other gains and incomes for
calculating revenue for the OCF and considering only labour costs, goods & services costs
and SG&A costs but excluding amortisation & depreciation costs for calculating expense for
the OCF as shown in appendix 2.
1
Paraphrase This Document
Need a fresh take? Get an instant paraphrase of this document with our AI Paraphraser
Corporate Finance [Surname, Student ID #]
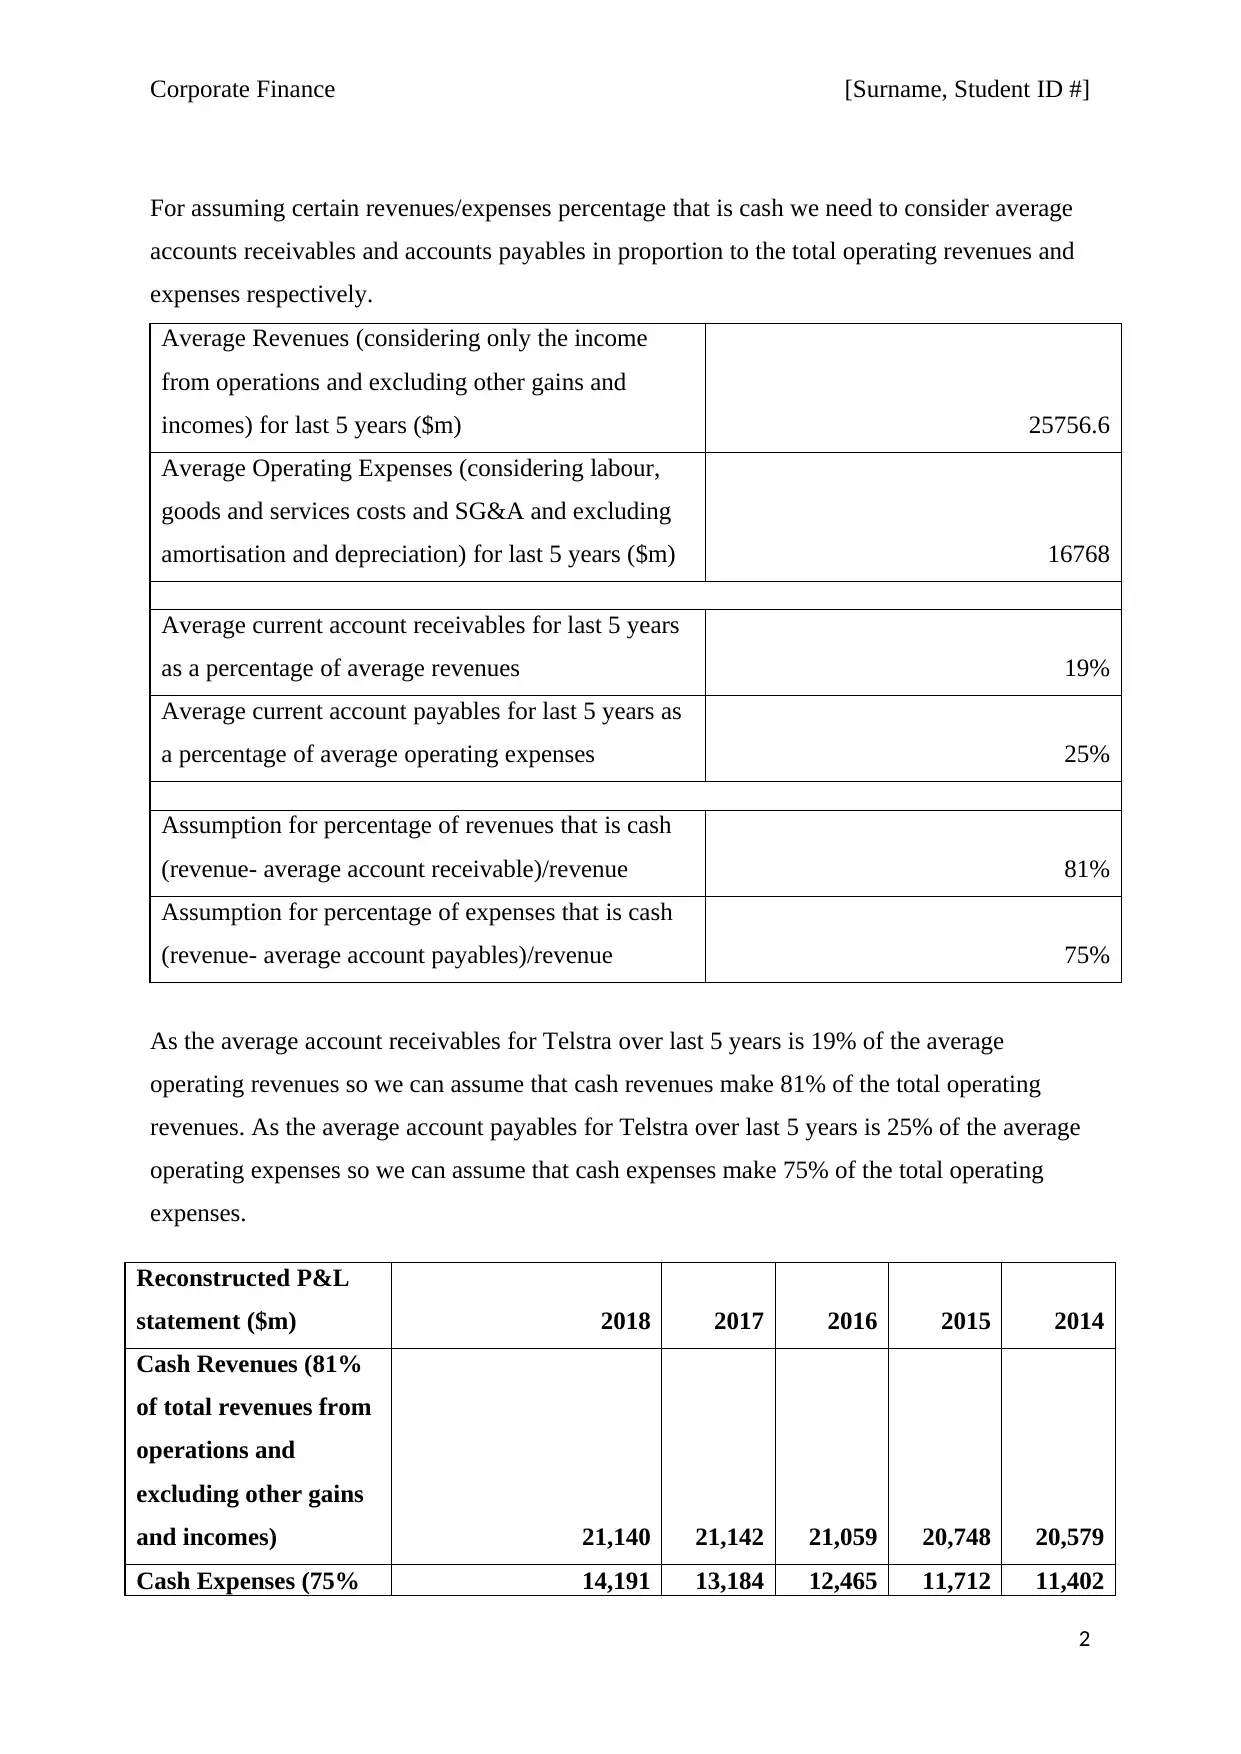
For assuming certain revenues/expenses percentage that is cash we need to consider average
accounts receivables and accounts payables in proportion to the total operating revenues and
expenses respectively.
Average Revenues (considering only the income
from operations and excluding other gains and
incomes) for last 5 years ($m) 25756.6
Average Operating Expenses (considering labour,
goods and services costs and SG&A and excluding
amortisation and depreciation) for last 5 years ($m) 16768
Average current account receivables for last 5 years
as a percentage of average revenues 19%
Average current account payables for last 5 years as
a percentage of average operating expenses 25%
Assumption for percentage of revenues that is cash
(revenue- average account receivable)/revenue 81%
Assumption for percentage of expenses that is cash
(revenue- average account payables)/revenue 75%
As the average account receivables for Telstra over last 5 years is 19% of the average
operating revenues so we can assume that cash revenues make 81% of the total operating
revenues. As the average account payables for Telstra over last 5 years is 25% of the average
operating expenses so we can assume that cash expenses make 75% of the total operating
expenses.
Reconstructed P&L
statement ($m) 2018 2017 2016 2015 2014
Cash Revenues (81%
of total revenues from
operations and
excluding other gains
and incomes) 21,140 21,142 21,059 20,748 20,579
Cash Expenses (75% 14,191 13,184 12,465 11,712 11,402
2
Corporate Finance [Surname, Student ID #]
of Operating Expenses
from labour, goods
and services costs and
SG&A and excluding
amortisation and
depreciation)
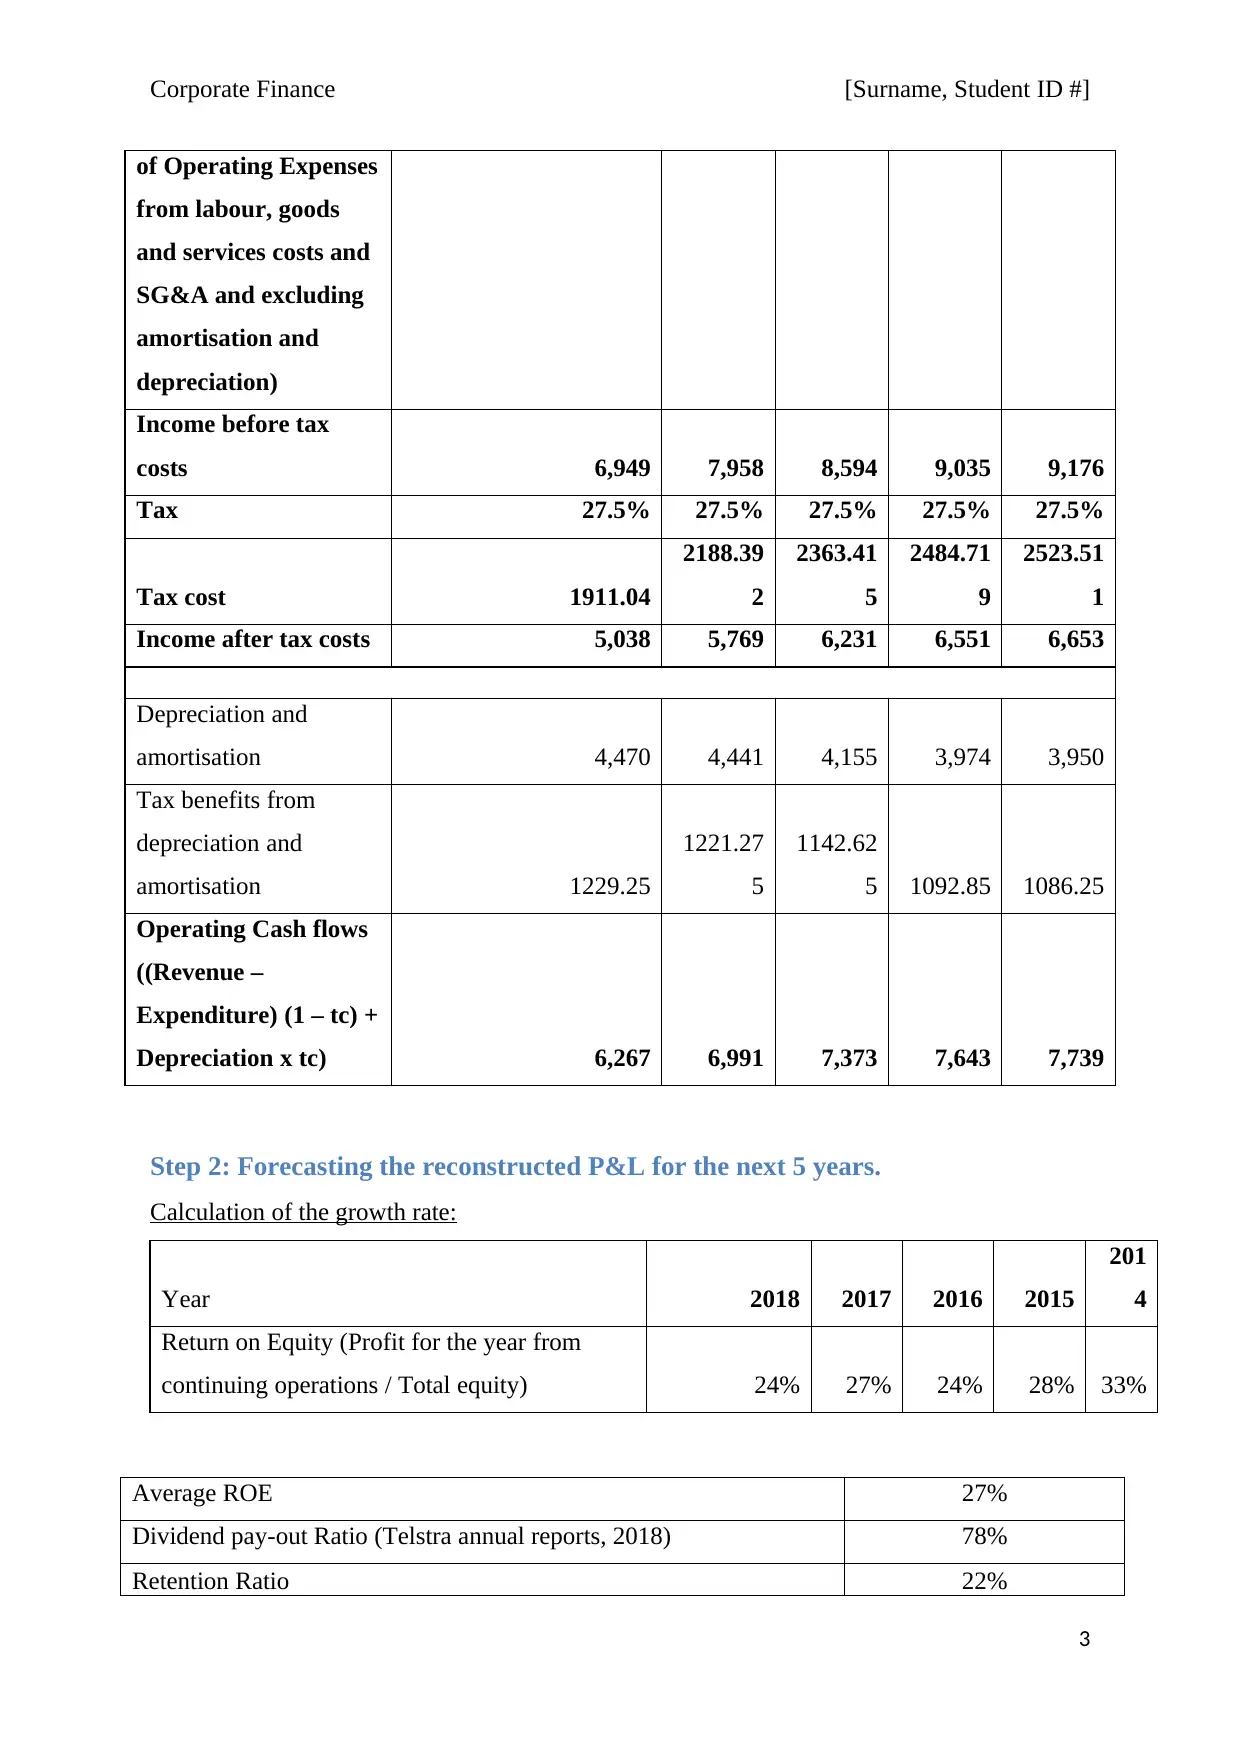
Income before tax
costs 6,949 7,958 8,594 9,035 9,176
Tax 27.5% 27.5% 27.5% 27.5% 27.5%
Tax cost 1911.04
2188.39
2
2363.41
5
2484.71
9
2523.51
1
Income after tax costs 5,038 5,769 6,231 6,551 6,653
Depreciation and
amortisation 4,470 4,441 4,155 3,974 3,950
Tax benefits from
depreciation and
amortisation 1229.25
1221.27
5
1142.62
5 1092.85 1086.25
Operating Cash flows
((Revenue –
Expenditure) (1 – tc) +
Depreciation x tc) 6,267 6,991 7,373 7,643 7,739
Step 2: Forecasting the reconstructed P&L for the next 5 years.
Calculation of the growth rate:
Year 2018 2017 2016 2015
201
4
Return on Equity (Profit for the year from
continuing operations / Total equity) 24% 27% 24% 28% 33%
Average ROE 27%
Dividend pay-out Ratio (Telstra annual reports, 2018) 78%
Retention Ratio 22%
3
of Operating Expenses
from labour, goods
and services costs and
SG&A and excluding
amortisation and
depreciation)
Income before tax
costs 6,949 7,958 8,594 9,035 9,176
Tax 27.5% 27.5% 27.5% 27.5% 27.5%
Tax cost 1911.04
2188.39
2
2363.41
5
2484.71
9
2523.51
1
Income after tax costs 5,038 5,769 6,231 6,551 6,653
Depreciation and
amortisation 4,470 4,441 4,155 3,974 3,950
Tax benefits from
depreciation and
amortisation 1229.25
1221.27
5
1142.62
5 1092.85 1086.25
Operating Cash flows
((Revenue –
Expenditure) (1 – tc) +
Depreciation x tc) 6,267 6,991 7,373 7,643 7,739
Step 2: Forecasting the reconstructed P&L for the next 5 years.
Calculation of the growth rate:
Year 2018 2017 2016 2015
201
4
Return on Equity (Profit for the year from
continuing operations / Total equity) 24% 27% 24% 28% 33%
Average ROE 27%
Dividend pay-out Ratio (Telstra annual reports, 2018) 78%
Retention Ratio 22%
3
⊘ This is a preview!⊘
Do you want full access?
Subscribe today to unlock all pages.
Trusted by 1+ million students worldwide
Corporate Finance [Surname, Student ID #]
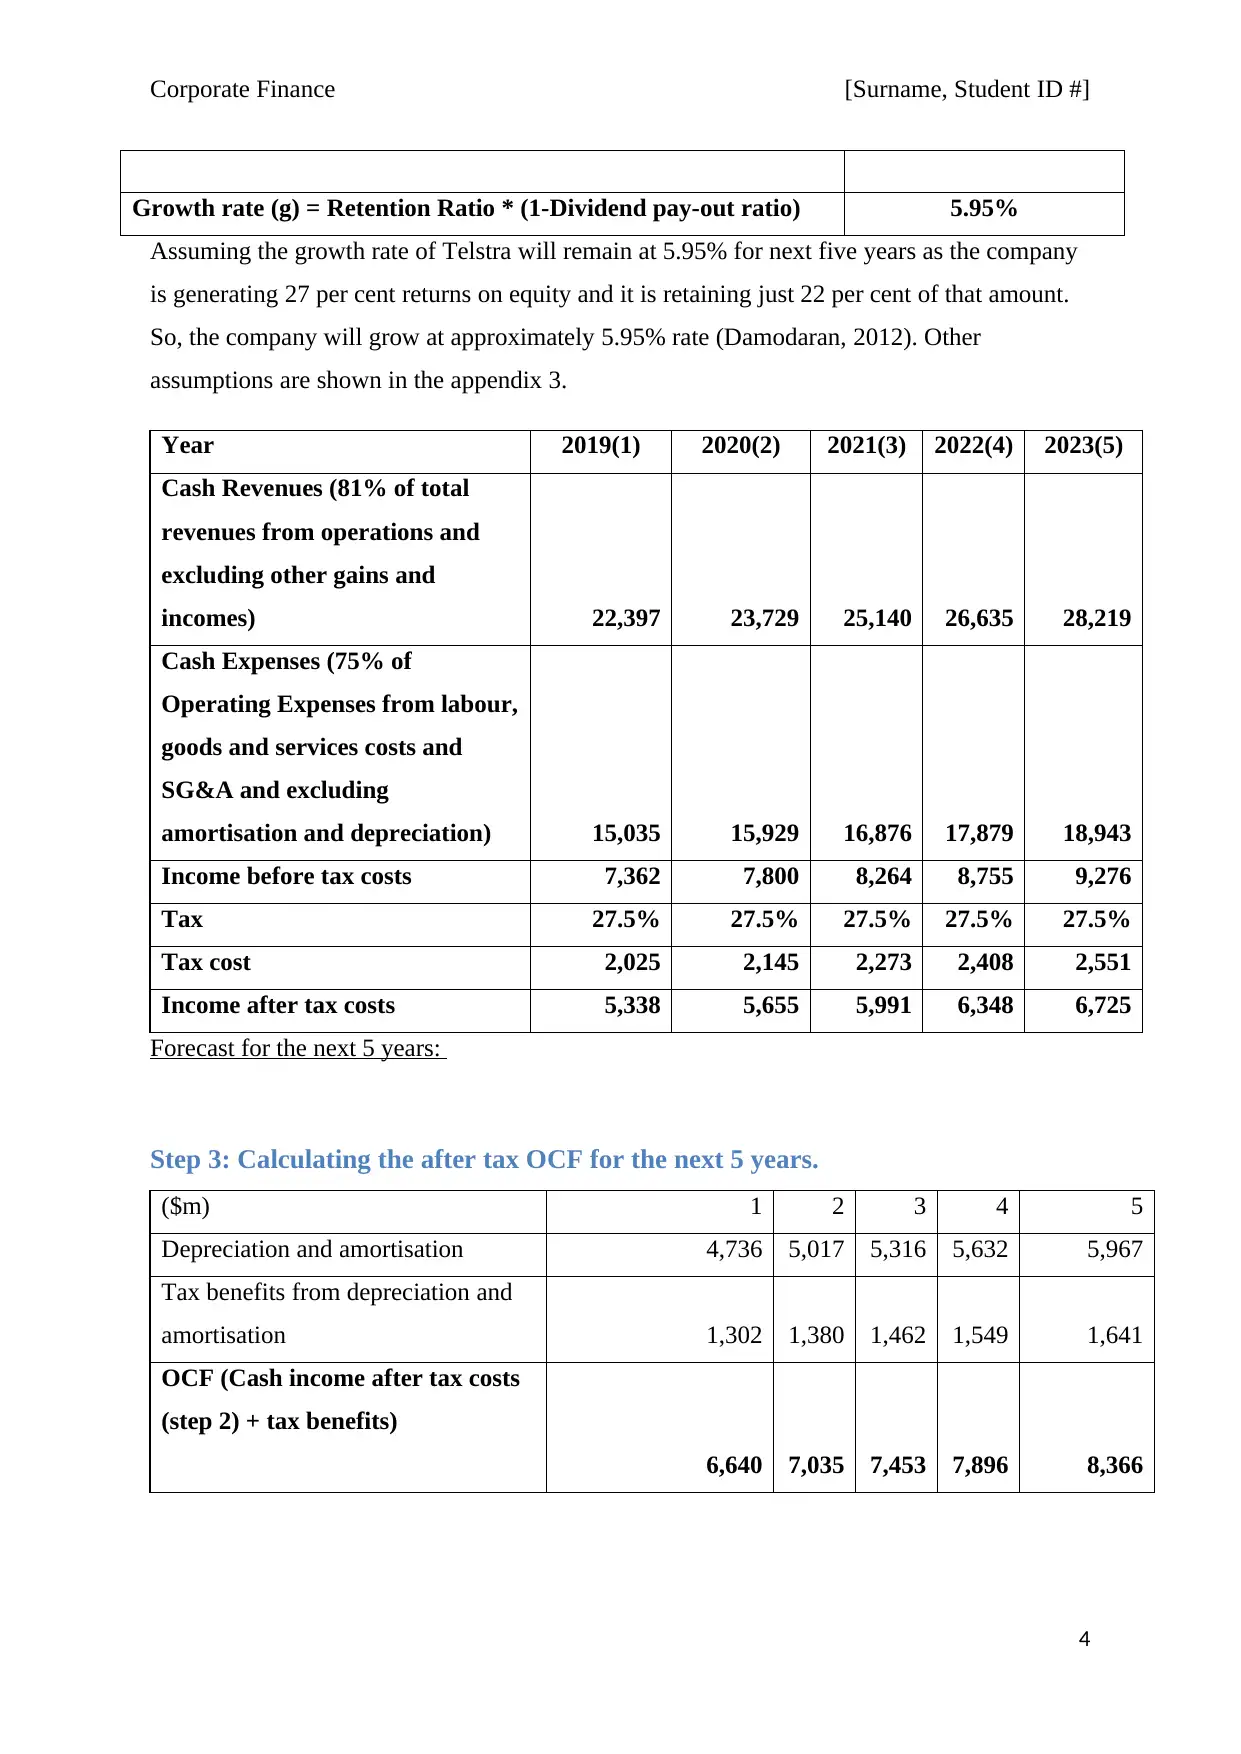
Growth rate (g) = Retention Ratio * (1-Dividend pay-out ratio) 5.95%
Assuming the growth rate of Telstra will remain at 5.95% for next five years as the company
is generating 27 per cent returns on equity and it is retaining just 22 per cent of that amount.
So, the company will grow at approximately 5.95% rate (Damodaran, 2012). Other
assumptions are shown in the appendix 3.
Year 2019(1) 2020(2) 2021(3) 2022(4) 2023(5)
Cash Revenues (81% of total
revenues from operations and
excluding other gains and
incomes) 22,397 23,729 25,140 26,635 28,219
Cash Expenses (75% of
Operating Expenses from labour,
goods and services costs and
SG&A and excluding
amortisation and depreciation) 15,035 15,929 16,876 17,879 18,943
Income before tax costs 7,362 7,800 8,264 8,755 9,276
Tax 27.5% 27.5% 27.5% 27.5% 27.5%
Tax cost 2,025 2,145 2,273 2,408 2,551
Income after tax costs 5,338 5,655 5,991 6,348 6,725
Forecast for the next 5 years:
Step 3: Calculating the after tax OCF for the next 5 years.
($m) 1 2 3 4 5
Depreciation and amortisation 4,736 5,017 5,316 5,632 5,967
Tax benefits from depreciation and
amortisation 1,302 1,380 1,462 1,549 1,641
OCF (Cash income after tax costs
(step 2) + tax benefits)
6,640 7,035 7,453 7,896 8,366
4
Paraphrase This Document
Need a fresh take? Get an instant paraphrase of this document with our AI Paraphraser
Corporate Finance [Surname, Student ID #]
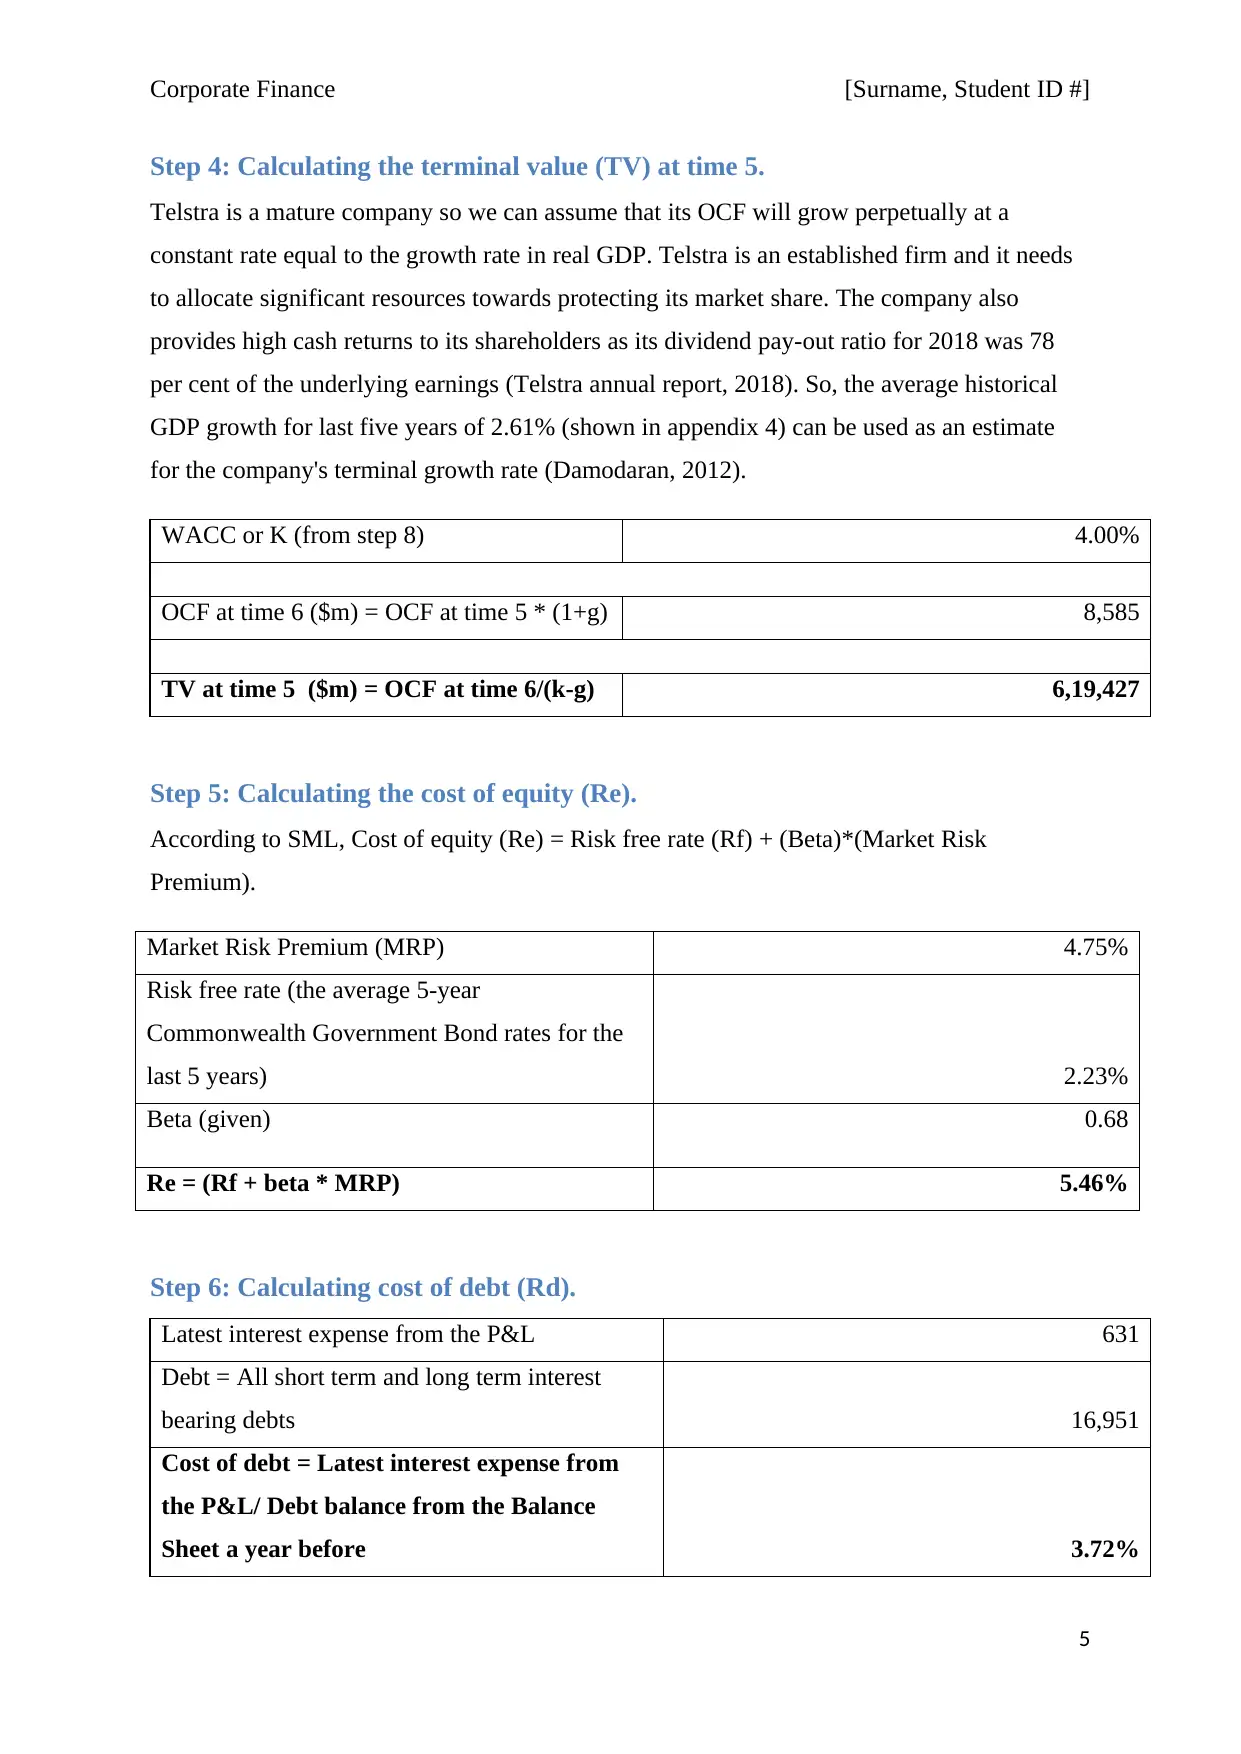
Step 4: Calculating the terminal value (TV) at time 5.
Telstra is a mature company so we can assume that its OCF will grow perpetually at a
constant rate equal to the growth rate in real GDP. Telstra is an established firm and it needs
to allocate significant resources towards protecting its market share. The company also
provides high cash returns to its shareholders as its dividend pay-out ratio for 2018 was 78
per cent of the underlying earnings (Telstra annual report, 2018). So, the average historical
GDP growth for last five years of 2.61% (shown in appendix 4) can be used as an estimate
for the company's terminal growth rate (Damodaran, 2012).
WACC or K (from step 8) 4.00%
OCF at time 6 ($m) = OCF at time 5 * (1+g) 8,585
TV at time 5 ($m) = OCF at time 6/(k-g) 6,19,427
Step 5: Calculating the cost of equity (Re).
According to SML, Cost of equity (Re) = Risk free rate (Rf) + (Beta)*(Market Risk
Premium).
Market Risk Premium (MRP) 4.75%
Risk free rate (the average 5-year
Commonwealth Government Bond rates for the
last 5 years) 2.23%
Beta (given) 0.68
Re = (Rf + beta * MRP) 5.46%
Step 6: Calculating cost of debt (Rd).
Latest interest expense from the P&L 631
Debt = All short term and long term interest
bearing debts 16,951
Cost of debt = Latest interest expense from
the P&L/ Debt balance from the Balance
Sheet a year before 3.72%
5
Corporate Finance [Surname, Student ID #]
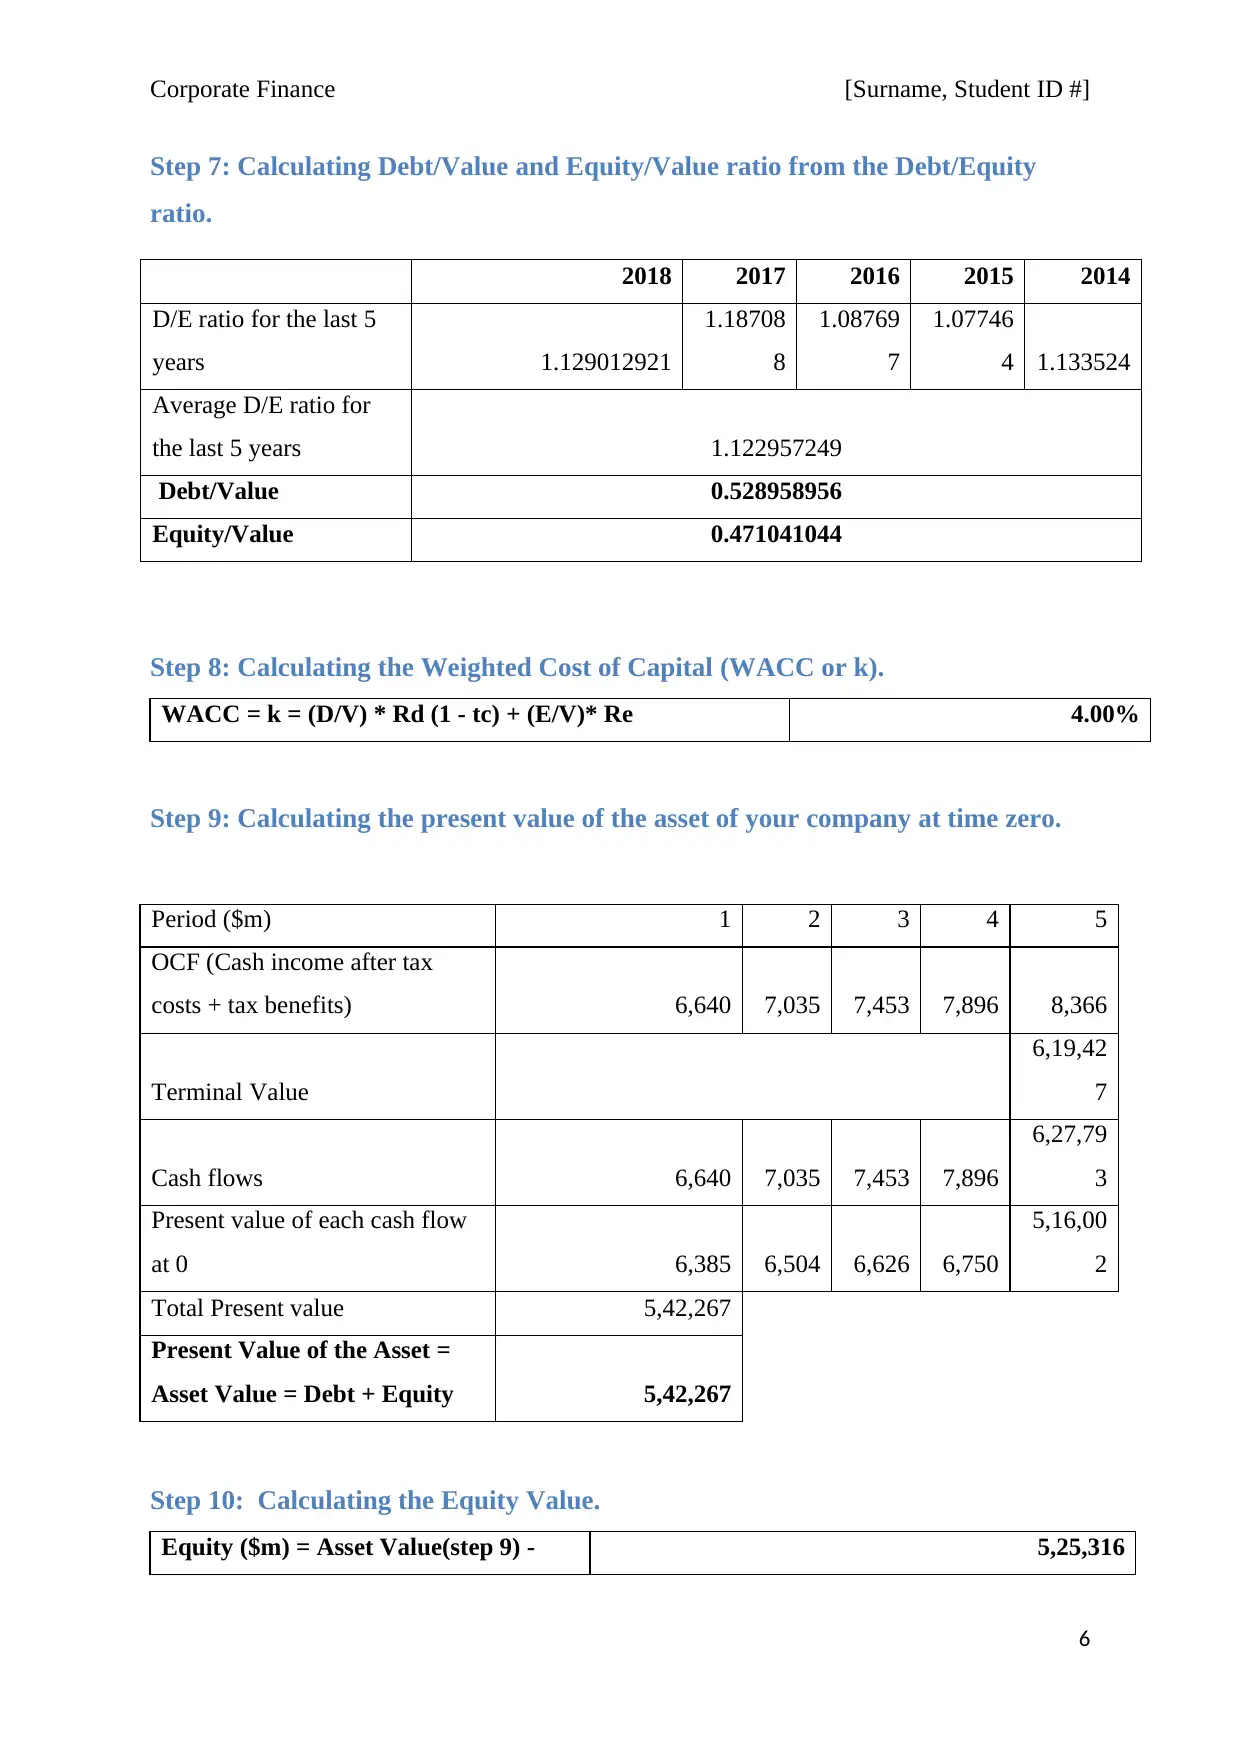
Step 7: Calculating Debt/Value and Equity/Value ratio from the Debt/Equity
ratio.
Step 8: Calculating the Weighted Cost of Capital (WACC or k).
WACC = k = (D/V) * Rd (1 - tc) + (E/V)* Re 4.00%
Step 9: Calculating the present value of the asset of your company at time zero.
Step 10: Calculating the Equity Value.
Equity ($m) = Asset Value(step 9) - 5,25,316
6
2018 2017 2016 2015 2014
D/E ratio for the last 5
years 1.129012921
1.18708
8
1.08769
7
1.07746
4 1.133524
Average D/E ratio for
the last 5 years 1.122957249
Debt/Value 0.528958956
Equity/Value 0.471041044
Period ($m) 1 2 3 4 5
OCF (Cash income after tax
costs + tax benefits) 6,640 7,035 7,453 7,896 8,366
Terminal Value
6,19,42
7
Cash flows 6,640 7,035 7,453 7,896
6,27,79
3
Present value of each cash flow
at 0 6,385 6,504 6,626 6,750
5,16,00
2
Total Present value 5,42,267
Present Value of the Asset =
Asset Value = Debt + Equity 5,42,267
⊘ This is a preview!⊘
Do you want full access?
Subscribe today to unlock all pages.
Trusted by 1+ million students worldwide
Corporate Finance [Surname, Student ID #]
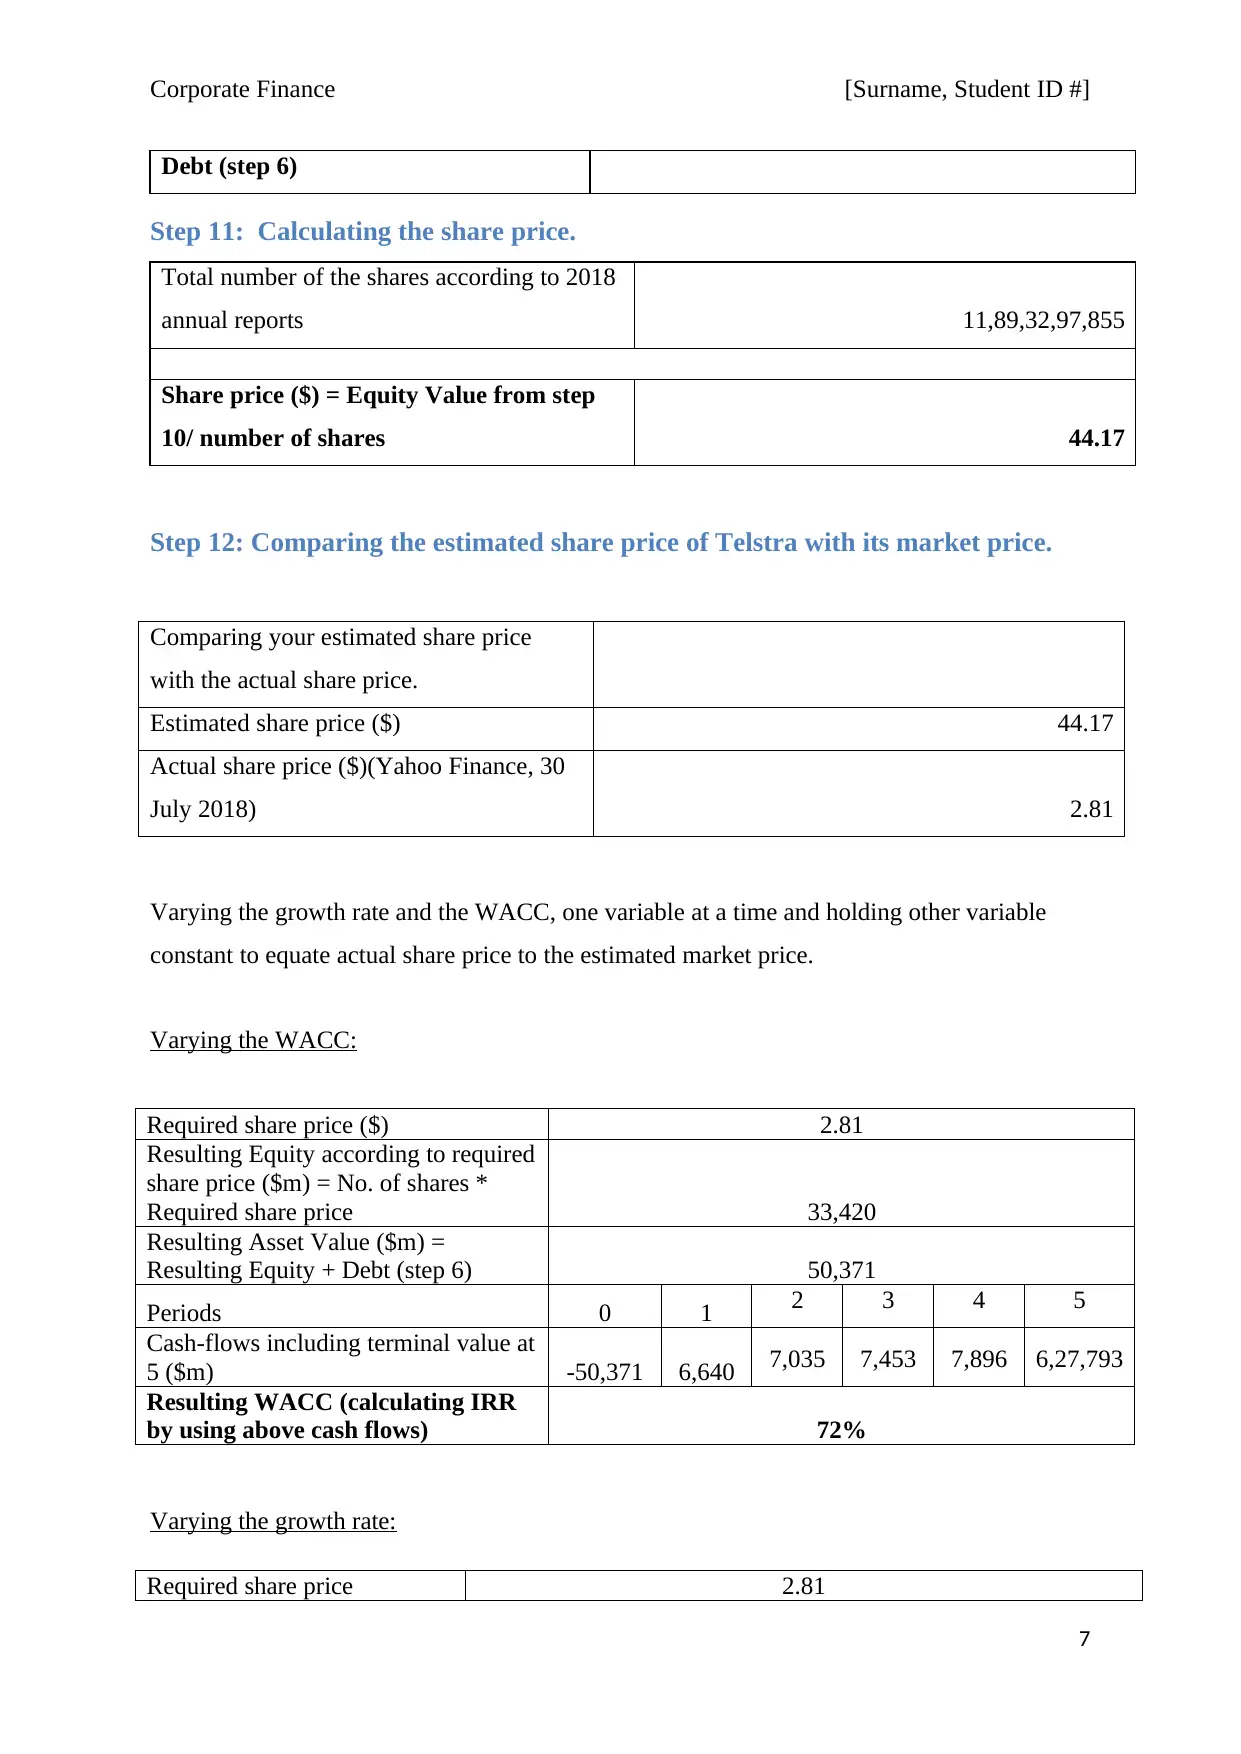
Debt (step 6)
Step 11: Calculating the share price.
Total number of the shares according to 2018
annual reports 11,89,32,97,855
Share price ($) = Equity Value from step
10/ number of shares 44.17
Step 12: Comparing the estimated share price of Telstra with its market price.
Comparing your estimated share price
with the actual share price.
Estimated share price ($) 44.17
Actual share price ($)(Yahoo Finance, 30
July 2018) 2.81
Varying the growth rate and the WACC, one variable at a time and holding other variable
constant to equate actual share price to the estimated market price.
Varying the WACC:
Required share price ($) 2.81
Resulting Equity according to required
share price ($m) = No. of shares *
Required share price 33,420
Resulting Asset Value ($m) =
Resulting Equity + Debt (step 6) 50,371
Periods 0 1 2 3 4 5
Cash-flows including terminal value at
5 ($m) -50,371 6,640 7,035 7,453 7,896 6,27,793
Resulting WACC (calculating IRR
by using above cash flows) 72%
Varying the growth rate:
Required share price 2.81
7
Paraphrase This Document
Need a fresh take? Get an instant paraphrase of this document with our AI Paraphraser
Corporate Finance [Surname, Student ID #]
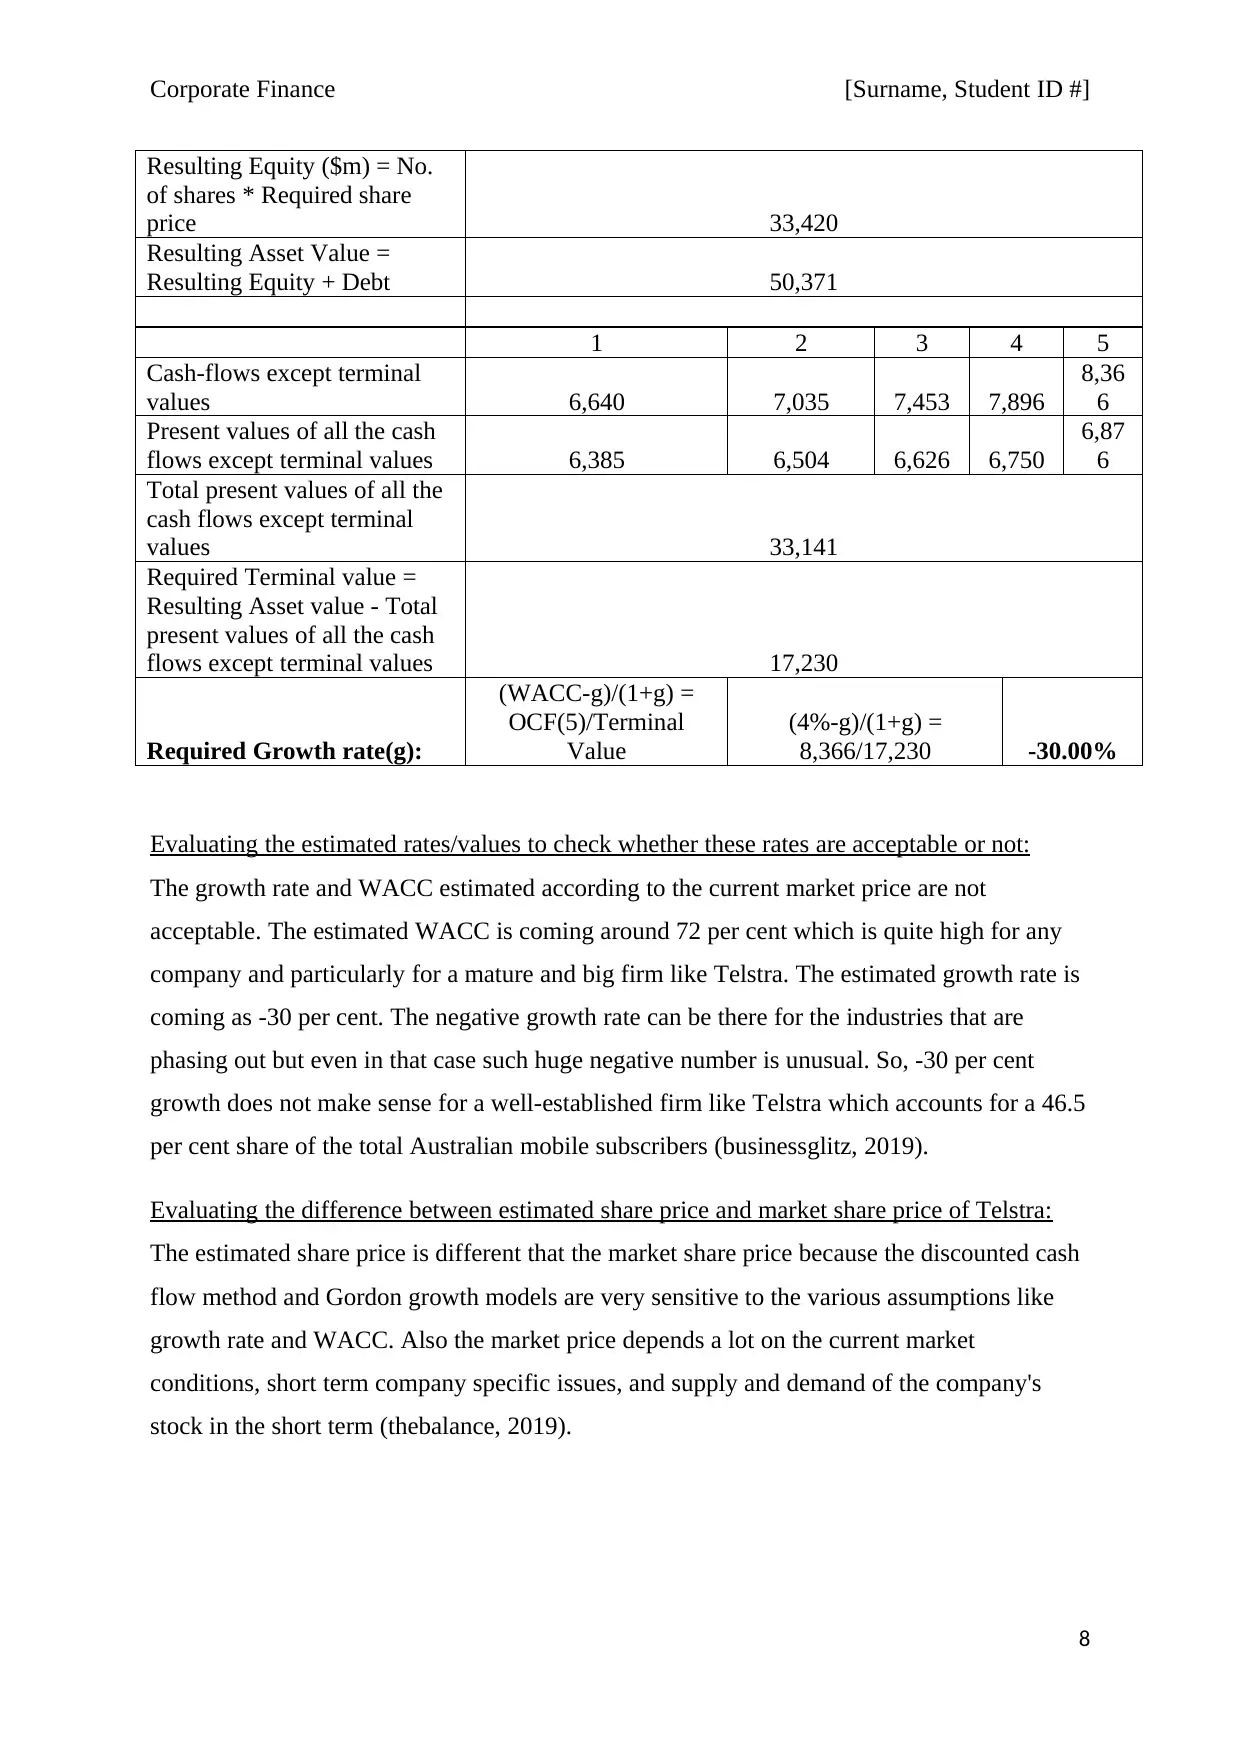
Resulting Equity ($m) = No.
of shares * Required share
price 33,420
Resulting Asset Value =
Resulting Equity + Debt 50,371
1 2 3 4 5
Cash-flows except terminal
values 6,640 7,035 7,453 7,896
8,36
6
Present values of all the cash
flows except terminal values 6,385 6,504 6,626 6,750
6,87
6
Total present values of all the
cash flows except terminal
values 33,141
Required Terminal value =
Resulting Asset value - Total
present values of all the cash
flows except terminal values 17,230
Required Growth rate(g):
(WACC-g)/(1+g) =
OCF(5)/Terminal
Value
(4%-g)/(1+g) =
8,366/17,230 -30.00%
Evaluating the estimated rates/values to check whether these rates are acceptable or not:
The growth rate and WACC estimated according to the current market price are not
acceptable. The estimated WACC is coming around 72 per cent which is quite high for any
company and particularly for a mature and big firm like Telstra. The estimated growth rate is
coming as -30 per cent. The negative growth rate can be there for the industries that are
phasing out but even in that case such huge negative number is unusual. So, -30 per cent
growth does not make sense for a well-established firm like Telstra which accounts for a 46.5
per cent share of the total Australian mobile subscribers (businessglitz, 2019).
Evaluating the difference between estimated share price and market share price of Telstra:
The estimated share price is different that the market share price because the discounted cash
flow method and Gordon growth models are very sensitive to the various assumptions like
growth rate and WACC. Also the market price depends a lot on the current market
conditions, short term company specific issues, and supply and demand of the company's
stock in the short term (thebalance, 2019).
8
Corporate Finance [Surname, Student ID #]
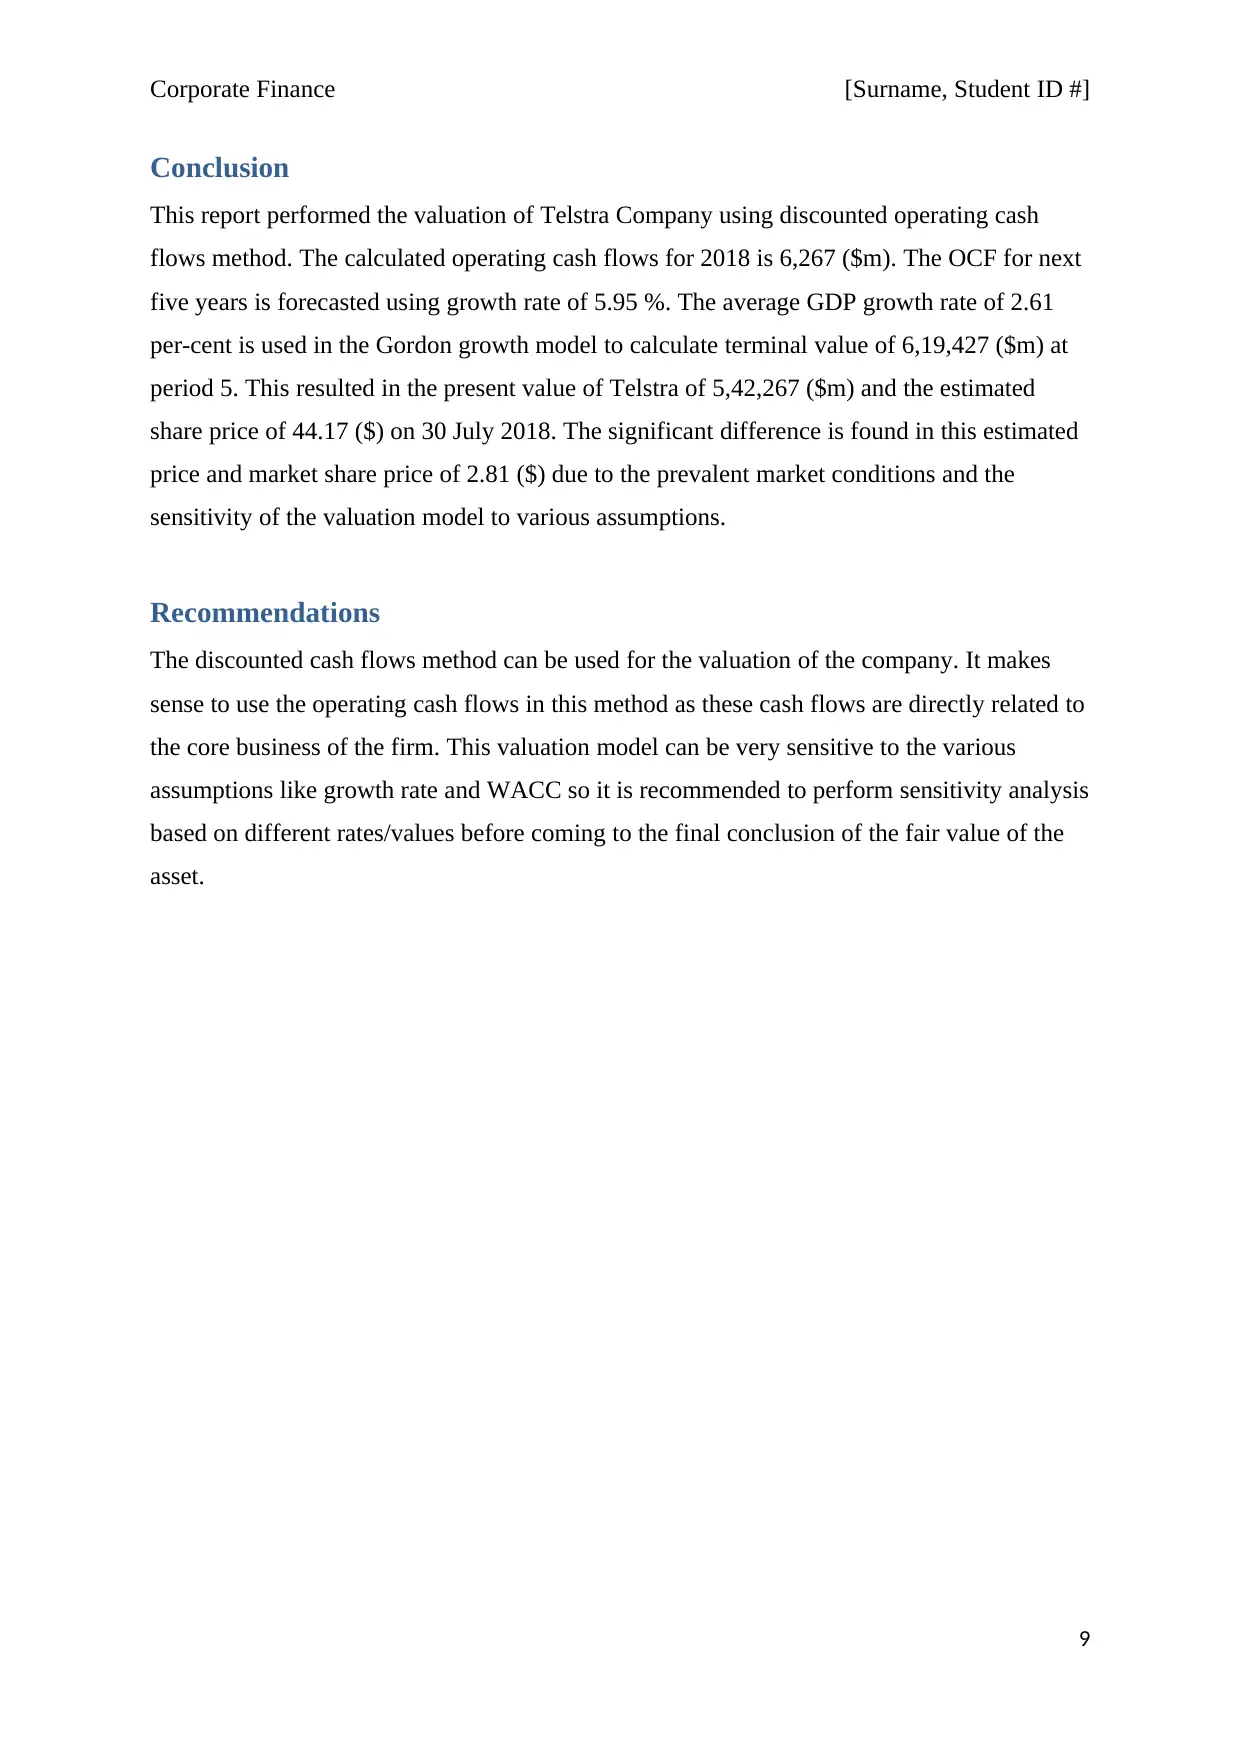
Conclusion
This report performed the valuation of Telstra Company using discounted operating cash
flows method. The calculated operating cash flows for 2018 is 6,267 ($m). The OCF for next
five years is forecasted using growth rate of 5.95 %. The average GDP growth rate of 2.61
per-cent is used in the Gordon growth model to calculate terminal value of 6,19,427 ($m) at
period 5. This resulted in the present value of Telstra of 5,42,267 ($m) and the estimated
share price of 44.17 ($) on 30 July 2018. The significant difference is found in this estimated
price and market share price of 2.81 ($) due to the prevalent market conditions and the
sensitivity of the valuation model to various assumptions.
Recommendations
The discounted cash flows method can be used for the valuation of the company. It makes
sense to use the operating cash flows in this method as these cash flows are directly related to
the core business of the firm. This valuation model can be very sensitive to the various
assumptions like growth rate and WACC so it is recommended to perform sensitivity analysis
based on different rates/values before coming to the final conclusion of the fair value of the
asset.
9
⊘ This is a preview!⊘
Do you want full access?
Subscribe today to unlock all pages.
Trusted by 1+ million students worldwide
1 out of 20
Related Documents


Your All-in-One AI-Powered Toolkit for Academic Success.
+13062052269
info@desklib.com
Available 24*7 on WhatsApp / Email
![[object Object]](/_next/static/media/star-bottom.7253800d.svg)
Unlock your academic potential
Copyright © 2020–2026 A2Z Services. All Rights Reserved. Developed and managed by ZUCOL.