Economics: Theory of Demand and Supply - Factors & Elasticity Analysis
VerifiedAdded on 2021/07/28
|13
|3798
|329
Homework Assignment
AI Summary
This document is a comprehensive lecture note on the theory of demand and supply in economics. It begins by defining demand, distinguishing it from mere desire, and explaining the law of demand, which describes the inverse relationship between price and quantity demanded. The document then explores demand schedules, curves, and functions, as well as the determinants of demand, including price, consumer preferences, income, prices of related goods, expectations, and the number of buyers. It also discusses the concept of elasticity of demand, covering price, income, and cross elasticity, and explains how to calculate point and arc price elasticity. The document further delves into the determinants of price elasticity of demand, such as the availability of substitutes, time, income proportion, and the importance of the commodity. Finally, it introduces the theory of supply, the law of supply, and related concepts like supply schedules, curves, and functions. The document is intended for economics students and provides detailed explanations and examples to enhance understanding of these core economic principles.
Introduction to Economics, By: Mohammed Ibrahim (MSc.)
E-mail:- imu2019g@gmail.com
(Introduction to Economics Lecturer Note), for Natural students
~ 1 ~
Chapter Two
Theory of Demand and Supply
2.1 Theory of demand
Demand is one of the forces determining prices. The theory of demand is related to the economic
activities of consumers-consumption. Hence, the purpose of the theory of demand is to determine
the various factors that affect demand. In our day-to-day life we use the word demand‘in a loose
sense to mean a desire of a person to purchase a commodity or service. But in economics it has a
specific meaning, which is different from what we use it in our day to day activities. Demand
implies more than a mere desire to purchase a commodity. It states that the consumer must be
willing and able to purchase the commodity, which he/she desires. His/her desire should be
backed by his/her purchasing power. A poor person is willing to buy a car; it has no significance,
since he/she has no ability to pay for it. On the other hand, if his/her desire to buy the car is
backed by the purchasing power then this constitutes demand. Demand, thus, means the desire of
the consumer for a commodity backed by purchasing power. These two factors are essential. If a
consumer is willing to buy but is not able to pay, his/her desire will not become demand.
Similarly, if the consumer has the ability to pay but is not willing to pay, his/her desire will not
be called demand.
More specifically, demand refers to various quantities of a commodity or service that a
consumer would purchase at a given time in a market at various prices, given other things
unchanged (ceteris paribus). The quantity demanded of a particular commodity depends on the
price of that commodity. Law of demand: This is the principle of demand, which states that ,
price of a commodity and its quantity demanded are inversely related i.e., as price of a
commodity increases (decreases) quantity demanded for that commodity decreases (increases),
ceteris paribus.
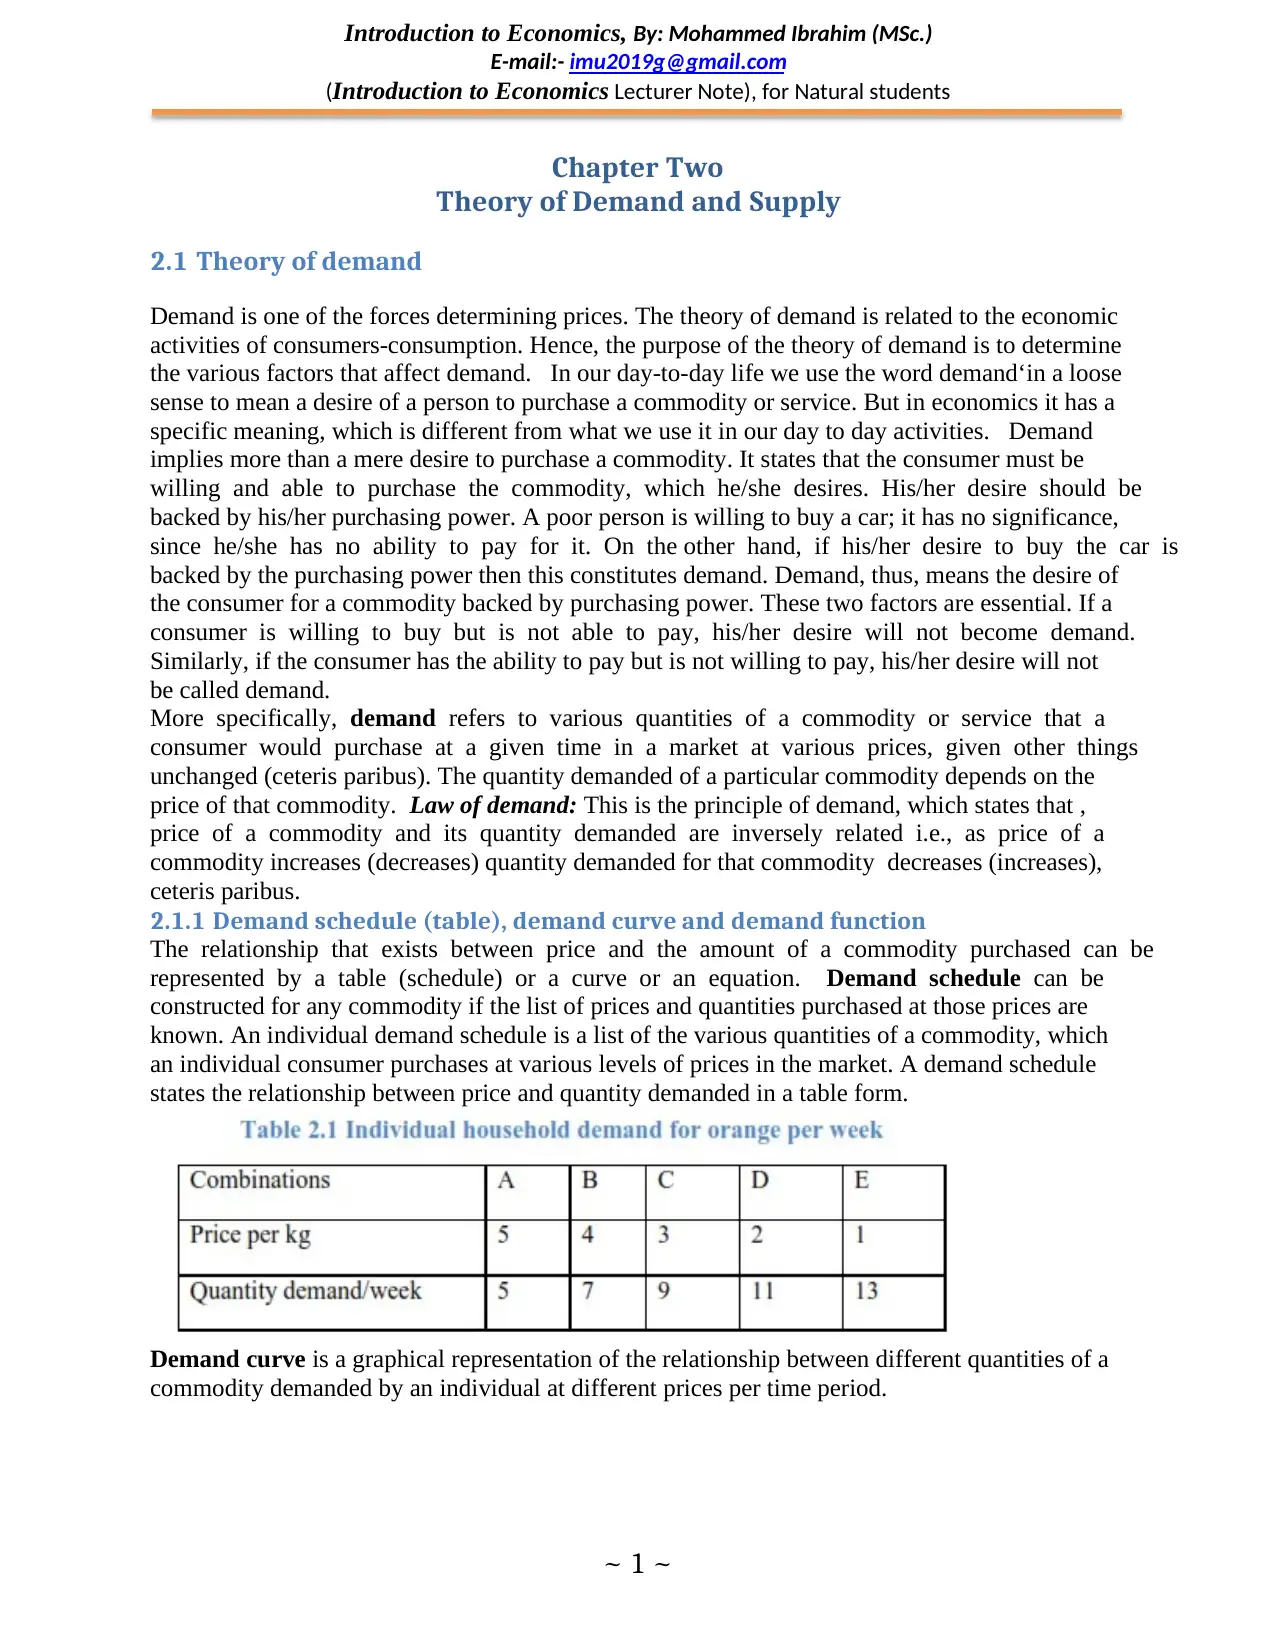
2.1.1 Demand schedule (table), demand curve and demand function
The relationship that exists between price and the amount of a commodity purchased can be
represented by a table (schedule) or a curve or an equation. Demand schedule can be
constructed for any commodity if the list of prices and quantities purchased at those prices are
known. An individual demand schedule is a list of the various quantities of a commodity, which
an individual consumer purchases at various levels of prices in the market. A demand schedule
states the relationship between price and quantity demanded in a table form.
Demand curve is a graphical representation of the relationship between different quantities of a
commodity demanded by an individual at different prices per time period.
E-mail:- imu2019g@gmail.com
(Introduction to Economics Lecturer Note), for Natural students
~ 1 ~
Chapter Two
Theory of Demand and Supply
2.1 Theory of demand
Demand is one of the forces determining prices. The theory of demand is related to the economic
activities of consumers-consumption. Hence, the purpose of the theory of demand is to determine
the various factors that affect demand. In our day-to-day life we use the word demand‘in a loose
sense to mean a desire of a person to purchase a commodity or service. But in economics it has a
specific meaning, which is different from what we use it in our day to day activities. Demand
implies more than a mere desire to purchase a commodity. It states that the consumer must be
willing and able to purchase the commodity, which he/she desires. His/her desire should be
backed by his/her purchasing power. A poor person is willing to buy a car; it has no significance,
since he/she has no ability to pay for it. On the other hand, if his/her desire to buy the car is
backed by the purchasing power then this constitutes demand. Demand, thus, means the desire of
the consumer for a commodity backed by purchasing power. These two factors are essential. If a
consumer is willing to buy but is not able to pay, his/her desire will not become demand.
Similarly, if the consumer has the ability to pay but is not willing to pay, his/her desire will not
be called demand.
More specifically, demand refers to various quantities of a commodity or service that a
consumer would purchase at a given time in a market at various prices, given other things
unchanged (ceteris paribus). The quantity demanded of a particular commodity depends on the
price of that commodity. Law of demand: This is the principle of demand, which states that ,
price of a commodity and its quantity demanded are inversely related i.e., as price of a
commodity increases (decreases) quantity demanded for that commodity decreases (increases),
ceteris paribus.
2.1.1 Demand schedule (table), demand curve and demand function
The relationship that exists between price and the amount of a commodity purchased can be
represented by a table (schedule) or a curve or an equation. Demand schedule can be
constructed for any commodity if the list of prices and quantities purchased at those prices are
known. An individual demand schedule is a list of the various quantities of a commodity, which
an individual consumer purchases at various levels of prices in the market. A demand schedule
states the relationship between price and quantity demanded in a table form.
Demand curve is a graphical representation of the relationship between different quantities of a
commodity demanded by an individual at different prices per time period.
Paraphrase This Document
Need a fresh take? Get an instant paraphrase of this document with our AI Paraphraser
Introduction to Economics, By: Mohammed Ibrahim (MSc.)
E-mail:- imu2019g@gmail.com
(Introduction to Economics Lecturer Note), for Natural students
~ 2 ~
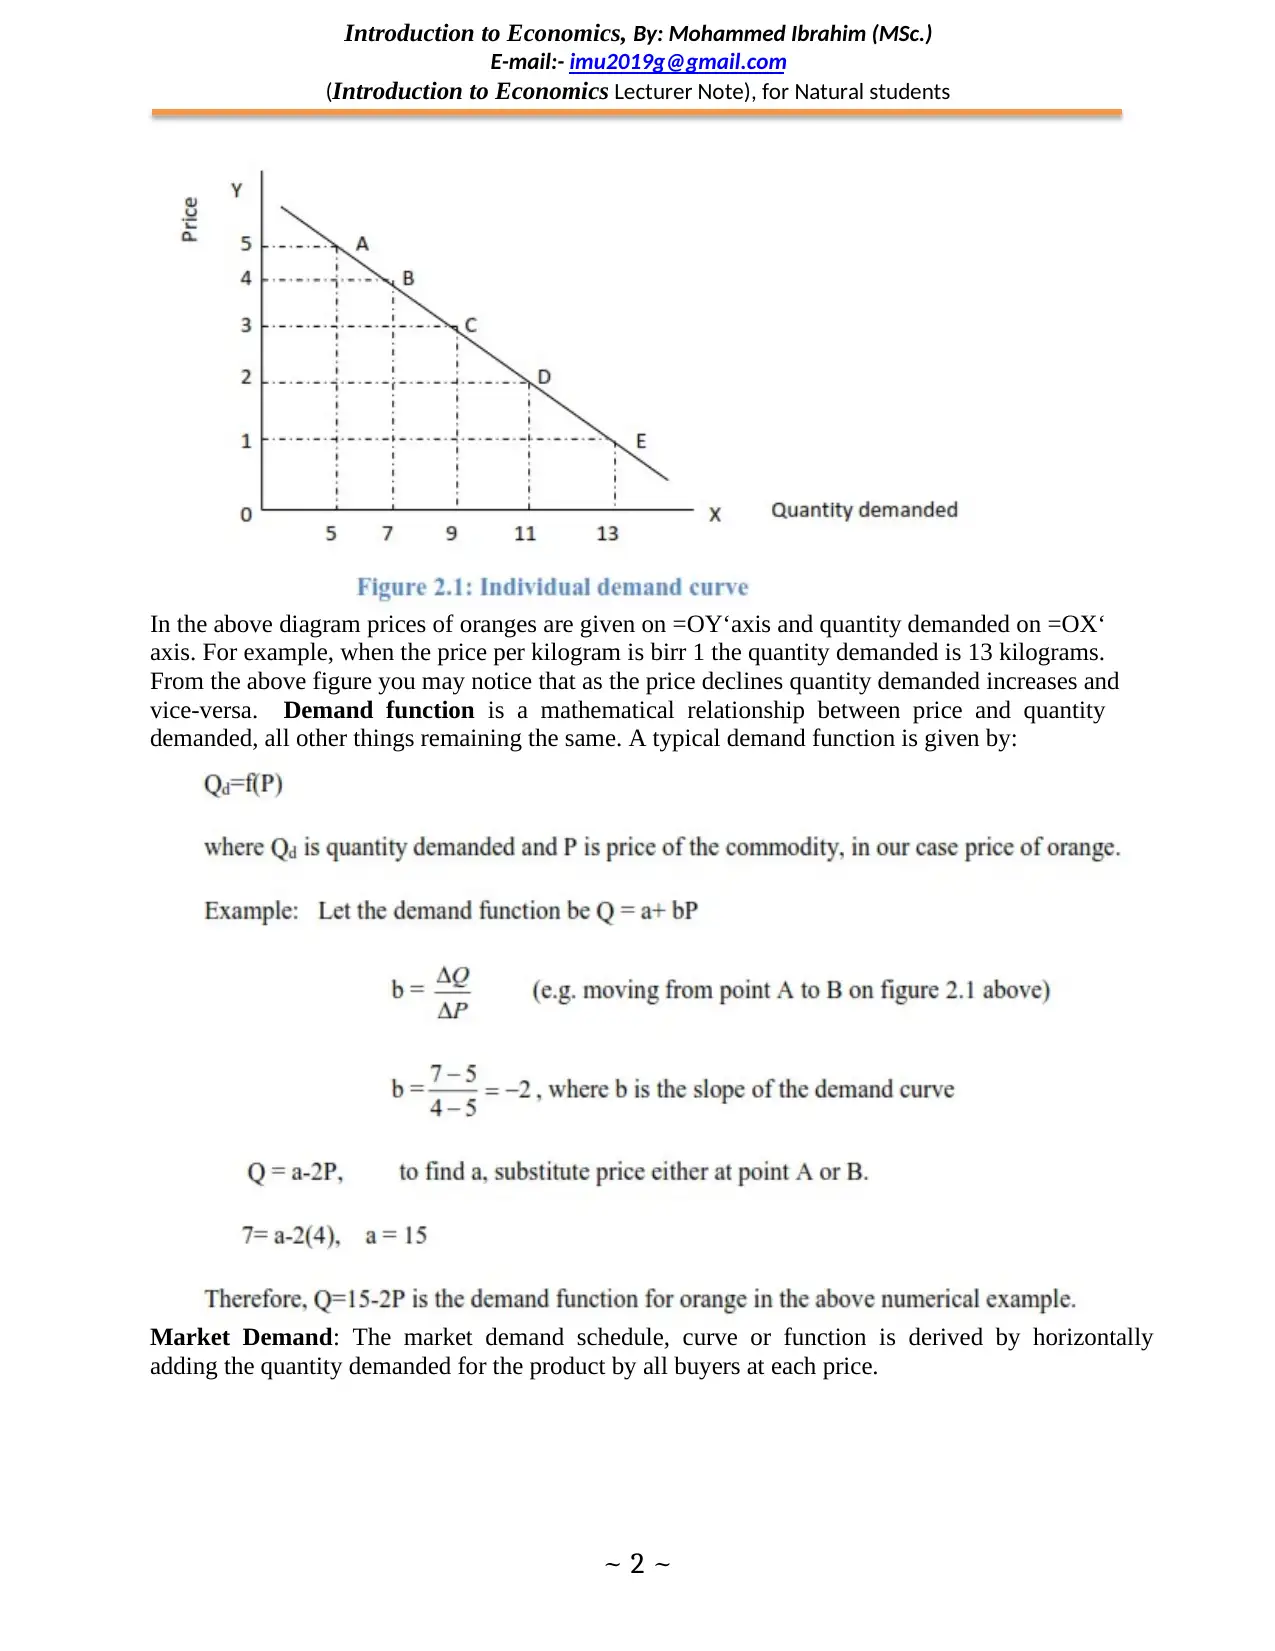
In the above diagram prices of oranges are given on =OY‘axis and quantity demanded on =OX‘
axis. For example, when the price per kilogram is birr 1 the quantity demanded is 13 kilograms.
From the above figure you may notice that as the price declines quantity demanded increases and
vice-versa. Demand function is a mathematical relationship between price and quantity
demanded, all other things remaining the same. A typical demand function is given by:
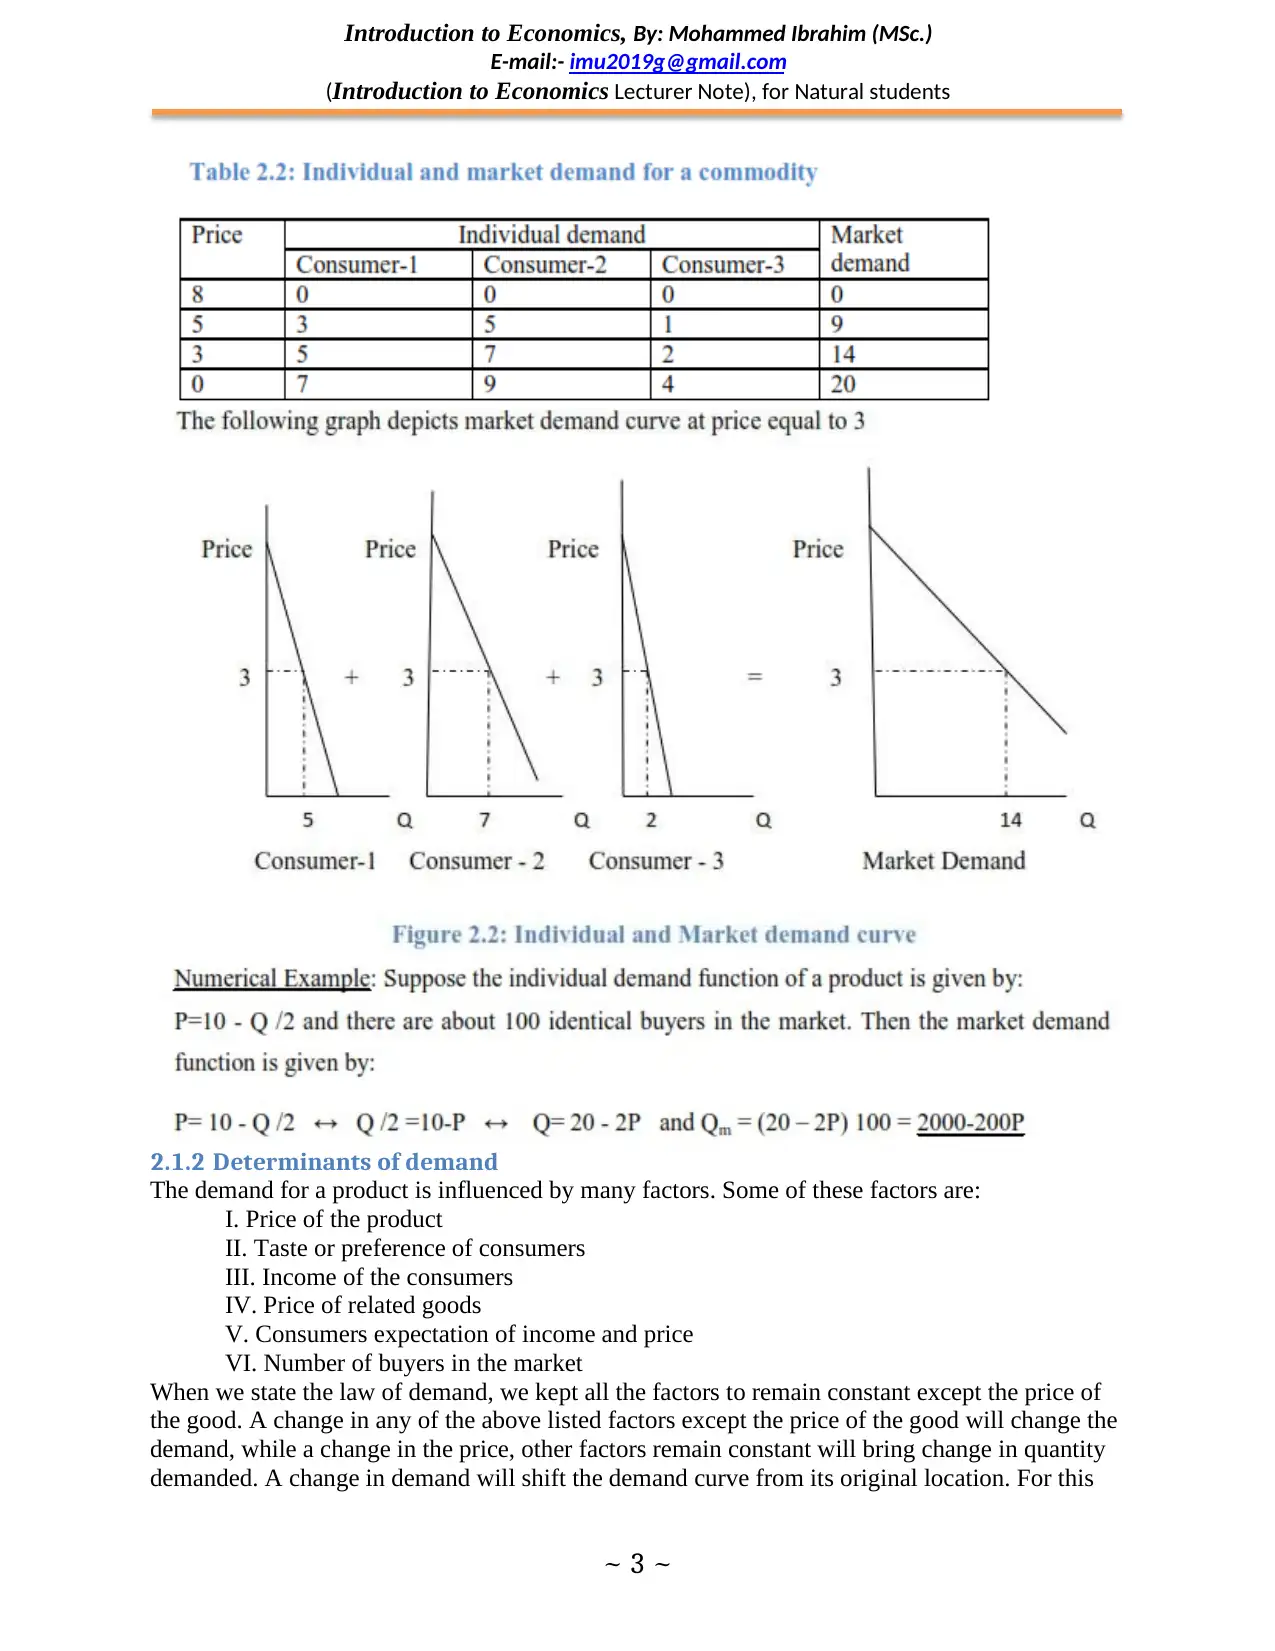
Market Demand: The market demand schedule, curve or function is derived by horizontally
adding the quantity demanded for the product by all buyers at each price.
E-mail:- imu2019g@gmail.com
(Introduction to Economics Lecturer Note), for Natural students
~ 2 ~
In the above diagram prices of oranges are given on =OY‘axis and quantity demanded on =OX‘
axis. For example, when the price per kilogram is birr 1 the quantity demanded is 13 kilograms.
From the above figure you may notice that as the price declines quantity demanded increases and
vice-versa. Demand function is a mathematical relationship between price and quantity
demanded, all other things remaining the same. A typical demand function is given by:
Market Demand: The market demand schedule, curve or function is derived by horizontally
adding the quantity demanded for the product by all buyers at each price.
Introduction to Economics, By: Mohammed Ibrahim (MSc.)
E-mail:- imu2019g@gmail.com
(Introduction to Economics Lecturer Note), for Natural students
~ 3 ~
2.1.2 Determinants of demand
The demand for a product is influenced by many factors. Some of these factors are:
I. Price of the product
II. Taste or preference of consumers
III. Income of the consumers
IV. Price of related goods
V. Consumers expectation of income and price
VI. Number of buyers in the market
When we state the law of demand, we kept all the factors to remain constant except the price of
the good. A change in any of the above listed factors except the price of the good will change the
demand, while a change in the price, other factors remain constant will bring change in quantity
demanded. A change in demand will shift the demand curve from its original location. For this
⊘ This is a preview!⊘
Do you want full access?
Subscribe today to unlock all pages.
Trusted by 1+ million students worldwide
Introduction to Economics, By: Mohammed Ibrahim (MSc.)
E-mail:- imu2019g@gmail.com
(Introduction to Economics Lecturer Note), for Natural students
~ 4 ~
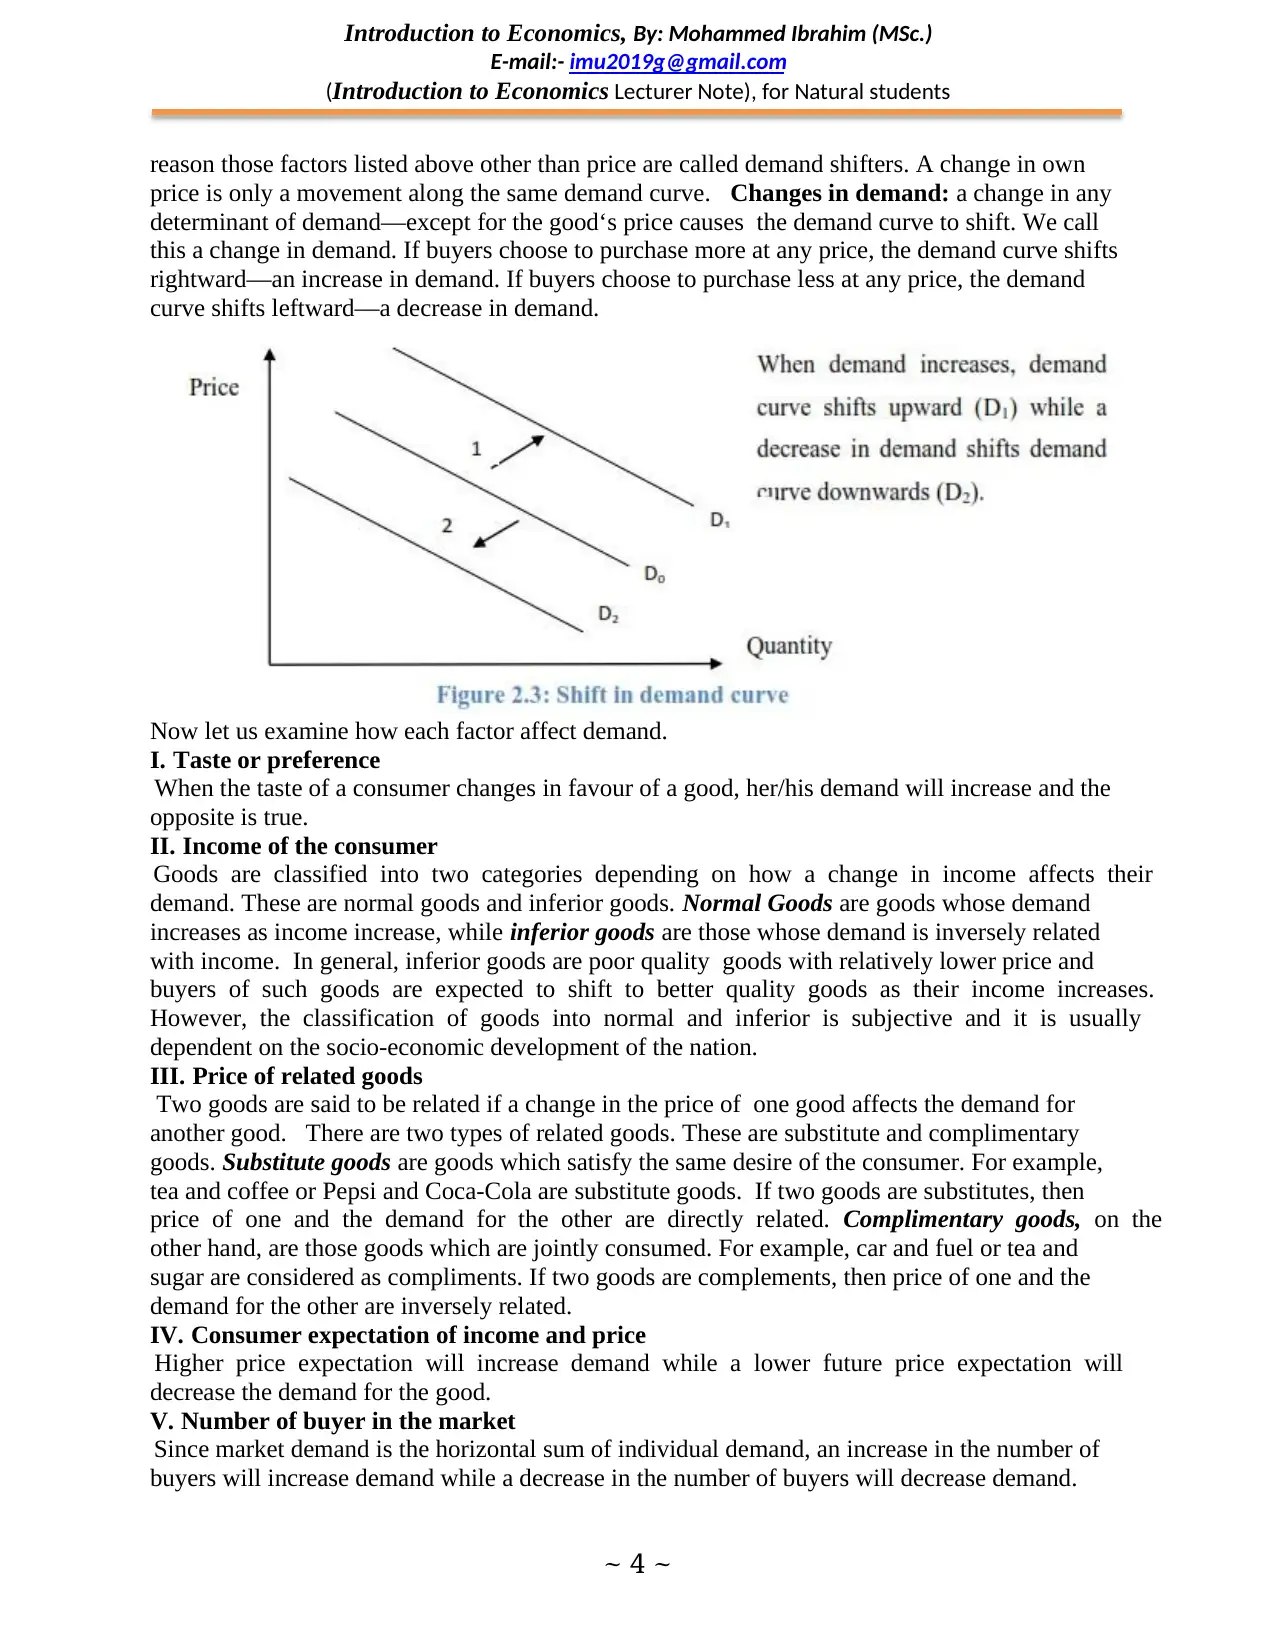
reason those factors listed above other than price are called demand shifters. A change in own
price is only a movement along the same demand curve. Changes in demand: a change in any
determinant of demand—except for the good‘s price causes the demand curve to shift. We call
this a change in demand. If buyers choose to purchase more at any price, the demand curve shifts
rightward—an increase in demand. If buyers choose to purchase less at any price, the demand
curve shifts leftward—a decrease in demand.
Now let us examine how each factor affect demand.
I. Taste or preference
When the taste of a consumer changes in favour of a good, her/his demand will increase and the
opposite is true.
II. Income of the consumer
Goods are classified into two categories depending on how a change in income affects their
demand. These are normal goods and inferior goods. Normal Goods are goods whose demand
increases as income increase, while inferior goods are those whose demand is inversely related
with income. In general, inferior goods are poor quality goods with relatively lower price and
buyers of such goods are expected to shift to better quality goods as their income increases.
However, the classification of goods into normal and inferior is subjective and it is usually
dependent on the socio-economic development of the nation.
III. Price of related goods
Two goods are said to be related if a change in the price of one good affects the demand for
another good. There are two types of related goods. These are substitute and complimentary
goods. Substitute goods are goods which satisfy the same desire of the consumer. For example,
tea and coffee or Pepsi and Coca-Cola are substitute goods. If two goods are substitutes, then
price of one and the demand for the other are directly related. Complimentary goods, on the
other hand, are those goods which are jointly consumed. For example, car and fuel or tea and
sugar are considered as compliments. If two goods are complements, then price of one and the
demand for the other are inversely related.
IV. Consumer expectation of income and price
Higher price expectation will increase demand while a lower future price expectation will
decrease the demand for the good.
V. Number of buyer in the market
Since market demand is the horizontal sum of individual demand, an increase in the number of
buyers will increase demand while a decrease in the number of buyers will decrease demand.
E-mail:- imu2019g@gmail.com
(Introduction to Economics Lecturer Note), for Natural students
~ 4 ~
reason those factors listed above other than price are called demand shifters. A change in own
price is only a movement along the same demand curve. Changes in demand: a change in any
determinant of demand—except for the good‘s price causes the demand curve to shift. We call
this a change in demand. If buyers choose to purchase more at any price, the demand curve shifts
rightward—an increase in demand. If buyers choose to purchase less at any price, the demand
curve shifts leftward—a decrease in demand.
Now let us examine how each factor affect demand.
I. Taste or preference
When the taste of a consumer changes in favour of a good, her/his demand will increase and the
opposite is true.
II. Income of the consumer
Goods are classified into two categories depending on how a change in income affects their
demand. These are normal goods and inferior goods. Normal Goods are goods whose demand
increases as income increase, while inferior goods are those whose demand is inversely related
with income. In general, inferior goods are poor quality goods with relatively lower price and
buyers of such goods are expected to shift to better quality goods as their income increases.
However, the classification of goods into normal and inferior is subjective and it is usually
dependent on the socio-economic development of the nation.
III. Price of related goods
Two goods are said to be related if a change in the price of one good affects the demand for
another good. There are two types of related goods. These are substitute and complimentary
goods. Substitute goods are goods which satisfy the same desire of the consumer. For example,
tea and coffee or Pepsi and Coca-Cola are substitute goods. If two goods are substitutes, then
price of one and the demand for the other are directly related. Complimentary goods, on the
other hand, are those goods which are jointly consumed. For example, car and fuel or tea and
sugar are considered as compliments. If two goods are complements, then price of one and the
demand for the other are inversely related.
IV. Consumer expectation of income and price
Higher price expectation will increase demand while a lower future price expectation will
decrease the demand for the good.
V. Number of buyer in the market
Since market demand is the horizontal sum of individual demand, an increase in the number of
buyers will increase demand while a decrease in the number of buyers will decrease demand.
Paraphrase This Document
Need a fresh take? Get an instant paraphrase of this document with our AI Paraphraser
Introduction to Economics, By: Mohammed Ibrahim (MSc.)
E-mail:- imu2019g@gmail.com
(Introduction to Economics Lecturer Note), for Natural students
~ 5 ~
2.1.3 Elasticity of demand
In economics, the concept of elasticity is very crucial and is used to analyze the quantitative
relationship between price and quantity purchased or sold. Elasticity is a measure of
responsiveness of a dependent variable to changes in an independent variable. Accordingly, we
have the concepts of elasticity of demand and elasticity of supply. Elasticity of demand refers
to the degree of responsiveness of quantity demanded of a good to a change in its price, or
change in income, or change in prices of related goods. Commonly, there are three kinds of
demand elasticity: price elasticity, income elasticity, and cross elasticity.
i. Price Elasticity of Demand
Price elasticity of demand means degree of responsiveness of demand to change in price. It
indicates how consumers react to changes in price. The greater the reaction the greater will be
the elasticity, and the lesser the reaction, the smaller will be the elasticity. Price elasticity of
demand is a measure of how much the quantity demanded of a good responds to a change in the
price of that good, computed as the percentage change in quantity demanded divided by the
percentage change in price. Demand for commodities like clothes, fruit etc. changes when there
is even a small change in their price, whereas demand for commodities which are basic
necessities of life, like salt, food grains etc., may not change even if price changes, or it may
change, but not in proportion to the change in price. Price elasticity demand can be measured in
two ways. These are point and arc elasticity.
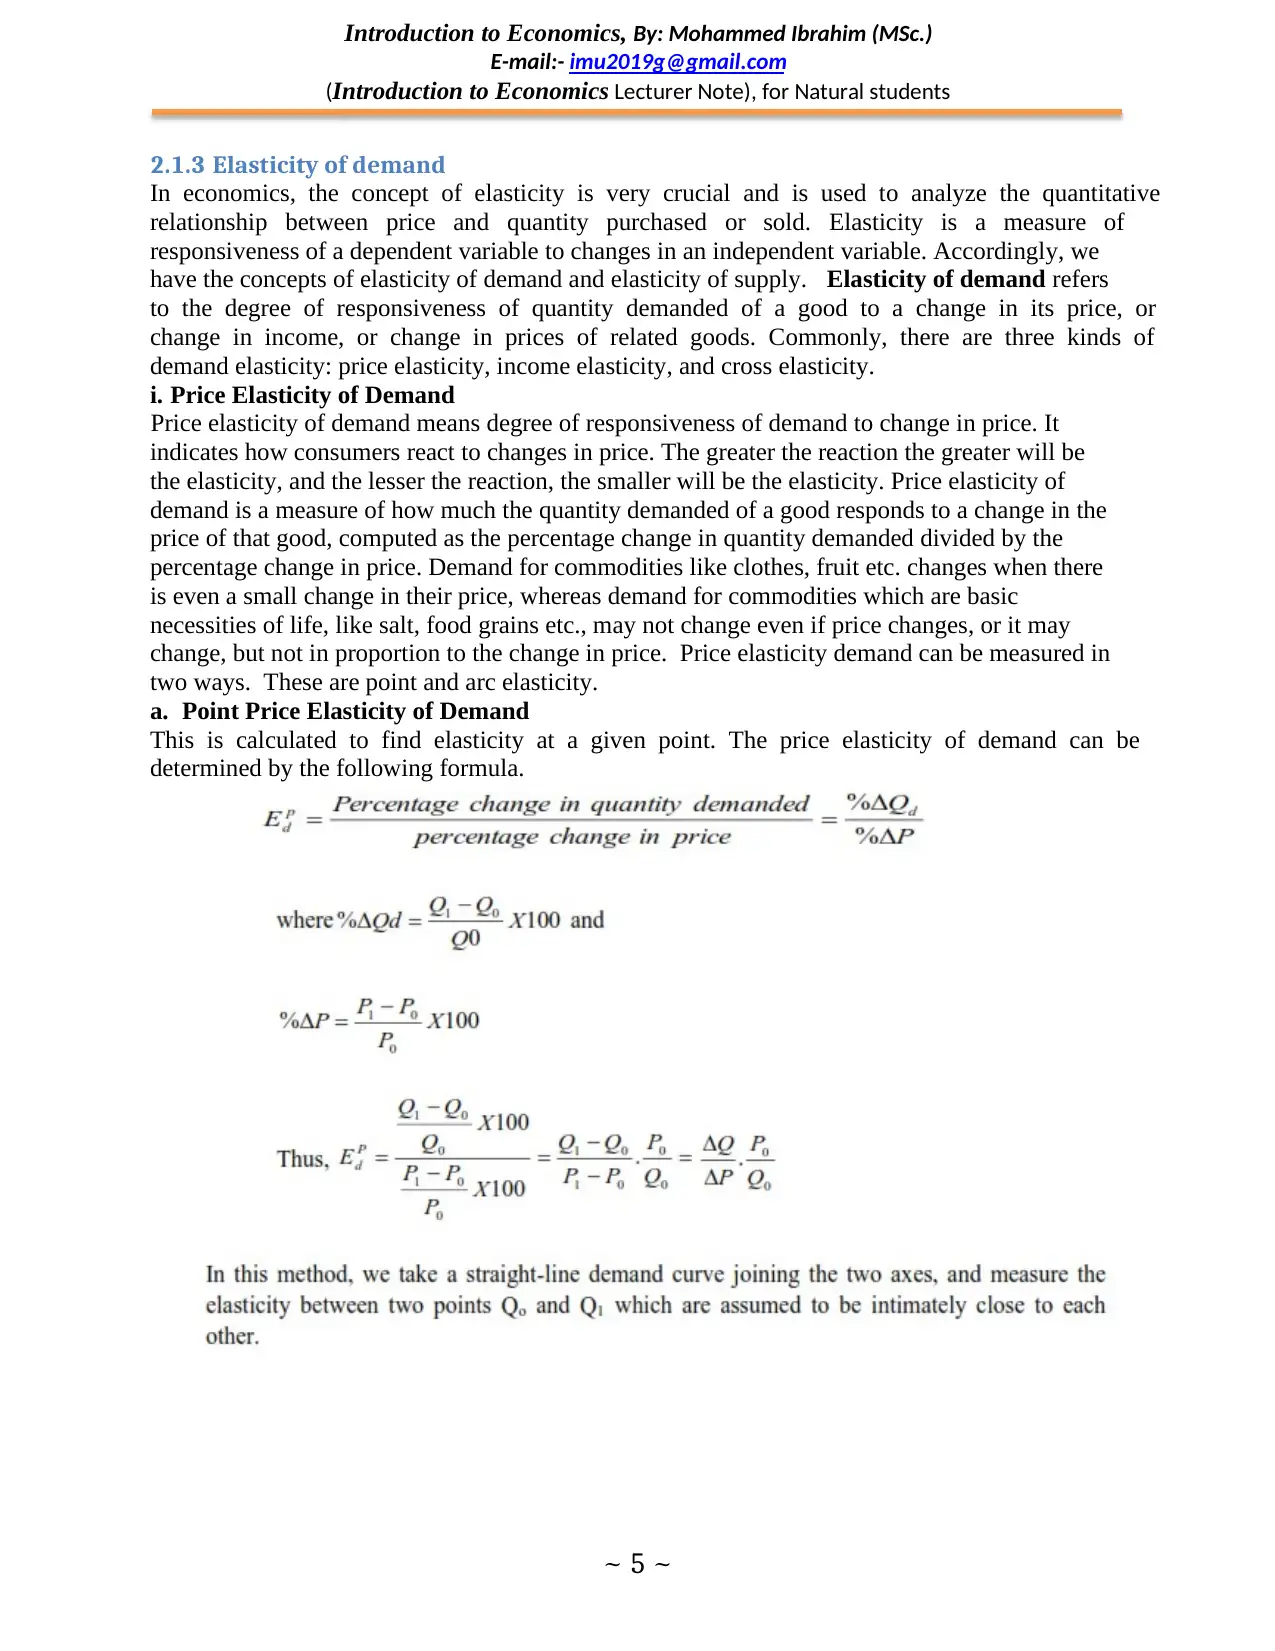
a. Point Price Elasticity of Demand
This is calculated to find elasticity at a given point. The price elasticity of demand can be
determined by the following formula.
E-mail:- imu2019g@gmail.com
(Introduction to Economics Lecturer Note), for Natural students
~ 5 ~
2.1.3 Elasticity of demand
In economics, the concept of elasticity is very crucial and is used to analyze the quantitative
relationship between price and quantity purchased or sold. Elasticity is a measure of
responsiveness of a dependent variable to changes in an independent variable. Accordingly, we
have the concepts of elasticity of demand and elasticity of supply. Elasticity of demand refers
to the degree of responsiveness of quantity demanded of a good to a change in its price, or
change in income, or change in prices of related goods. Commonly, there are three kinds of
demand elasticity: price elasticity, income elasticity, and cross elasticity.
i. Price Elasticity of Demand
Price elasticity of demand means degree of responsiveness of demand to change in price. It
indicates how consumers react to changes in price. The greater the reaction the greater will be
the elasticity, and the lesser the reaction, the smaller will be the elasticity. Price elasticity of
demand is a measure of how much the quantity demanded of a good responds to a change in the
price of that good, computed as the percentage change in quantity demanded divided by the
percentage change in price. Demand for commodities like clothes, fruit etc. changes when there
is even a small change in their price, whereas demand for commodities which are basic
necessities of life, like salt, food grains etc., may not change even if price changes, or it may
change, but not in proportion to the change in price. Price elasticity demand can be measured in
two ways. These are point and arc elasticity.
a. Point Price Elasticity of Demand
This is calculated to find elasticity at a given point. The price elasticity of demand can be
determined by the following formula.
Introduction to Economics, By: Mohammed Ibrahim (MSc.)
E-mail:- imu2019g@gmail.com
(Introduction to Economics Lecturer Note), for Natural students
~ 6 ~
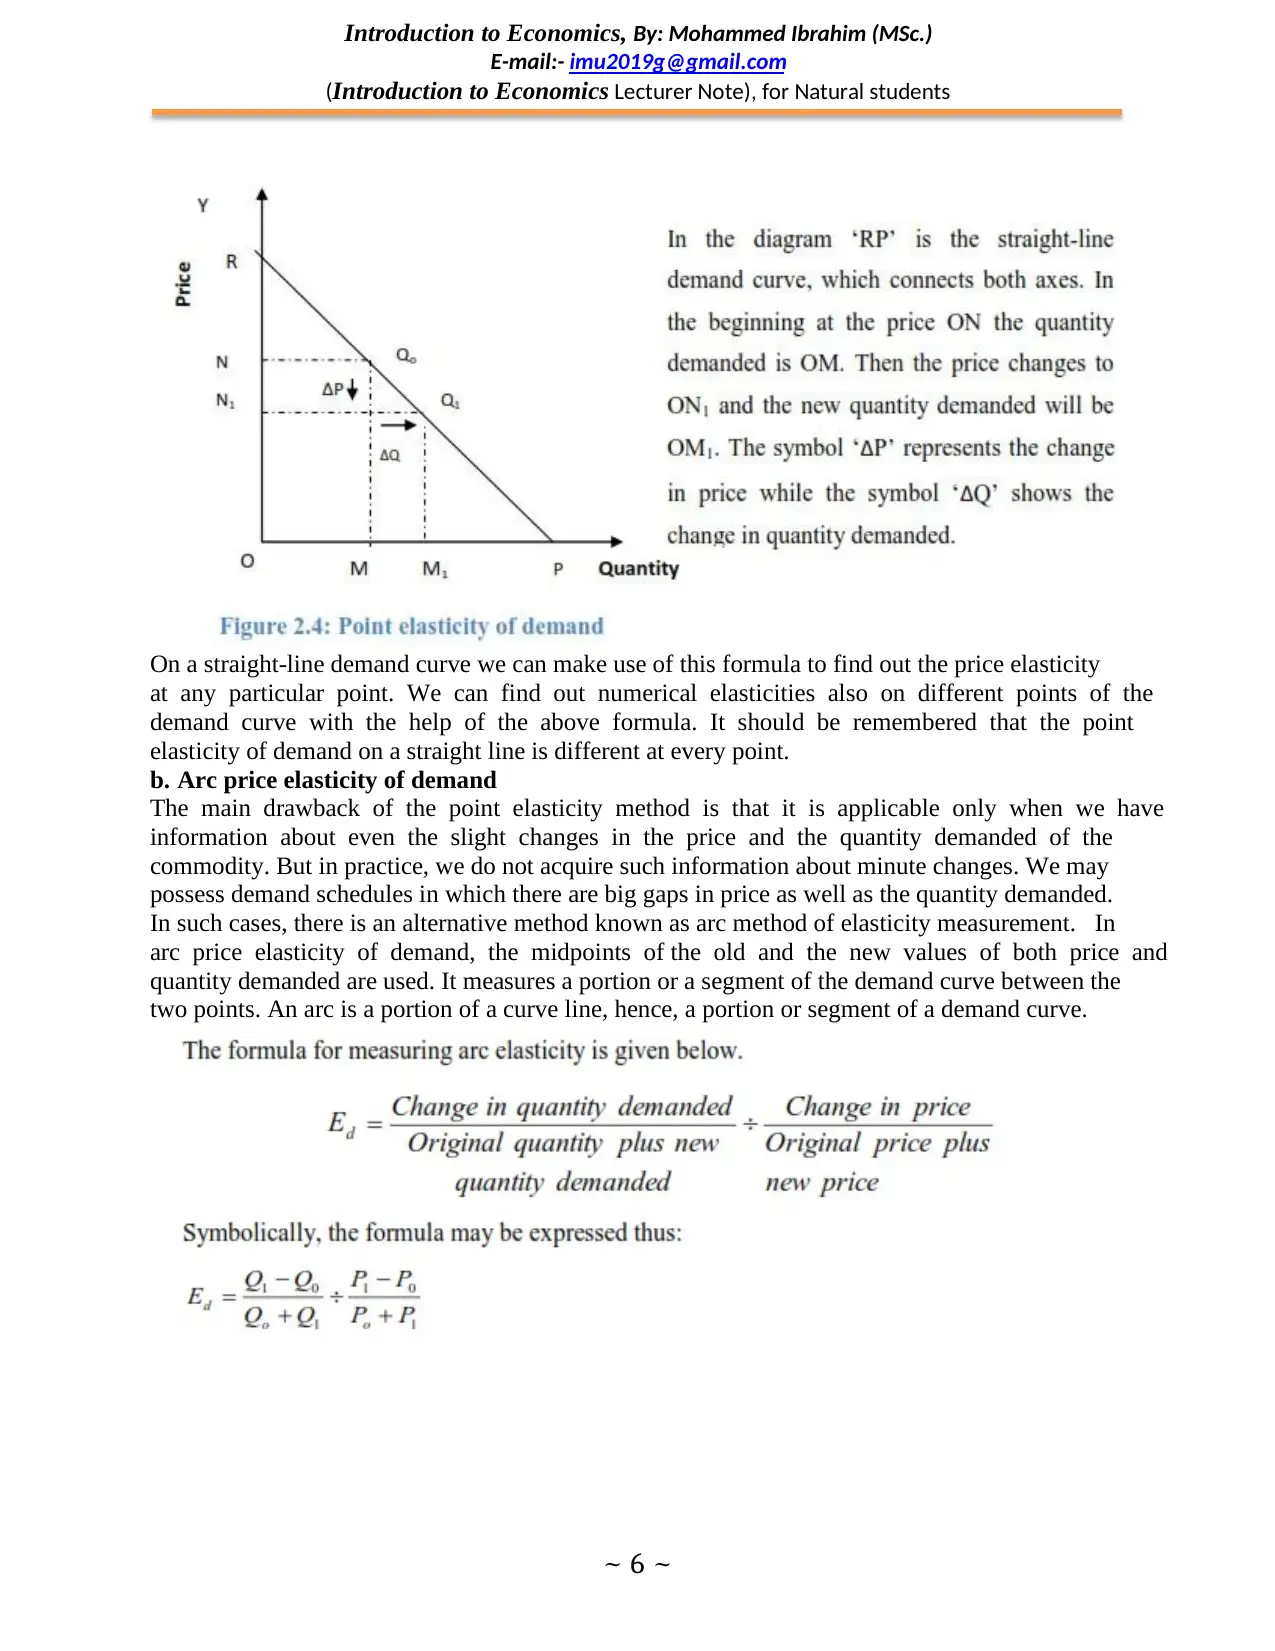
On a straight-line demand curve we can make use of this formula to find out the price elasticity
at any particular point. We can find out numerical elasticities also on different points of the
demand curve with the help of the above formula. It should be remembered that the point
elasticity of demand on a straight line is different at every point.
b. Arc price elasticity of demand
The main drawback of the point elasticity method is that it is applicable only when we have
information about even the slight changes in the price and the quantity demanded of the
commodity. But in practice, we do not acquire such information about minute changes. We may
possess demand schedules in which there are big gaps in price as well as the quantity demanded.
In such cases, there is an alternative method known as arc method of elasticity measurement. In
arc price elasticity of demand, the midpoints of the old and the new values of both price and
quantity demanded are used. It measures a portion or a segment of the demand curve between the
two points. An arc is a portion of a curve line, hence, a portion or segment of a demand curve.
E-mail:- imu2019g@gmail.com
(Introduction to Economics Lecturer Note), for Natural students
~ 6 ~
On a straight-line demand curve we can make use of this formula to find out the price elasticity
at any particular point. We can find out numerical elasticities also on different points of the
demand curve with the help of the above formula. It should be remembered that the point
elasticity of demand on a straight line is different at every point.
b. Arc price elasticity of demand
The main drawback of the point elasticity method is that it is applicable only when we have
information about even the slight changes in the price and the quantity demanded of the
commodity. But in practice, we do not acquire such information about minute changes. We may
possess demand schedules in which there are big gaps in price as well as the quantity demanded.
In such cases, there is an alternative method known as arc method of elasticity measurement. In
arc price elasticity of demand, the midpoints of the old and the new values of both price and
quantity demanded are used. It measures a portion or a segment of the demand curve between the
two points. An arc is a portion of a curve line, hence, a portion or segment of a demand curve.
⊘ This is a preview!⊘
Do you want full access?
Subscribe today to unlock all pages.
Trusted by 1+ million students worldwide
Introduction to Economics, By: Mohammed Ibrahim (MSc.)
E-mail:- imu2019g@gmail.com
(Introduction to Economics Lecturer Note), for Natural students
~ 7 ~
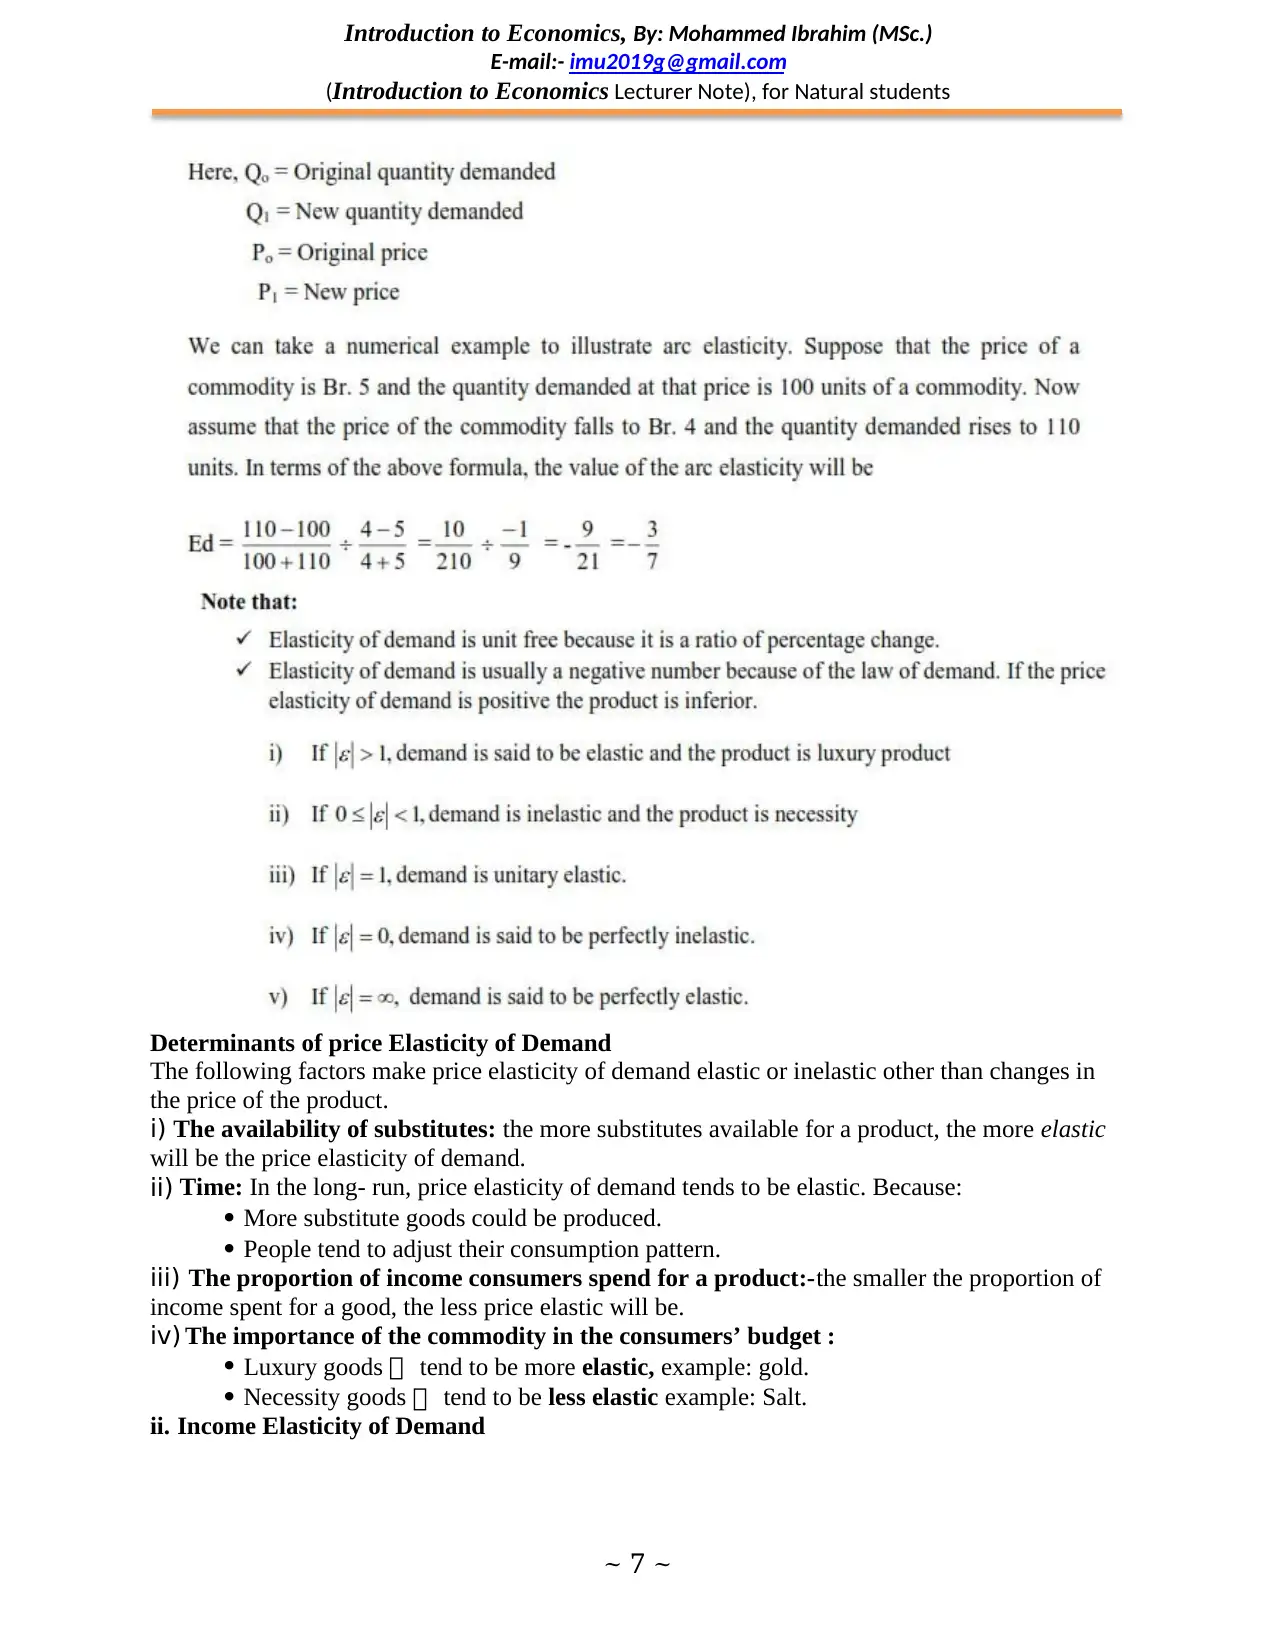
Determinants of price Elasticity of Demand
The following factors make price elasticity of demand elastic or inelastic other than changes in
the price of the product.
i) The availability of substitutes: the more substitutes available for a product, the more elastic
will be the price elasticity of demand.
ii) Time: In the long- run, price elasticity of demand tends to be elastic. Because:
More substitute goods could be produced.
People tend to adjust their consumption pattern.
iii) The proportion of income consumers spend for a product:-the smaller the proportion of
income spent for a good, the less price elastic will be.
iv) The importance of the commodity in the consumers’ budget :
Luxury goods tend to be more elastic, example: gold.
Necessity goods tend to be less elastic example: Salt.
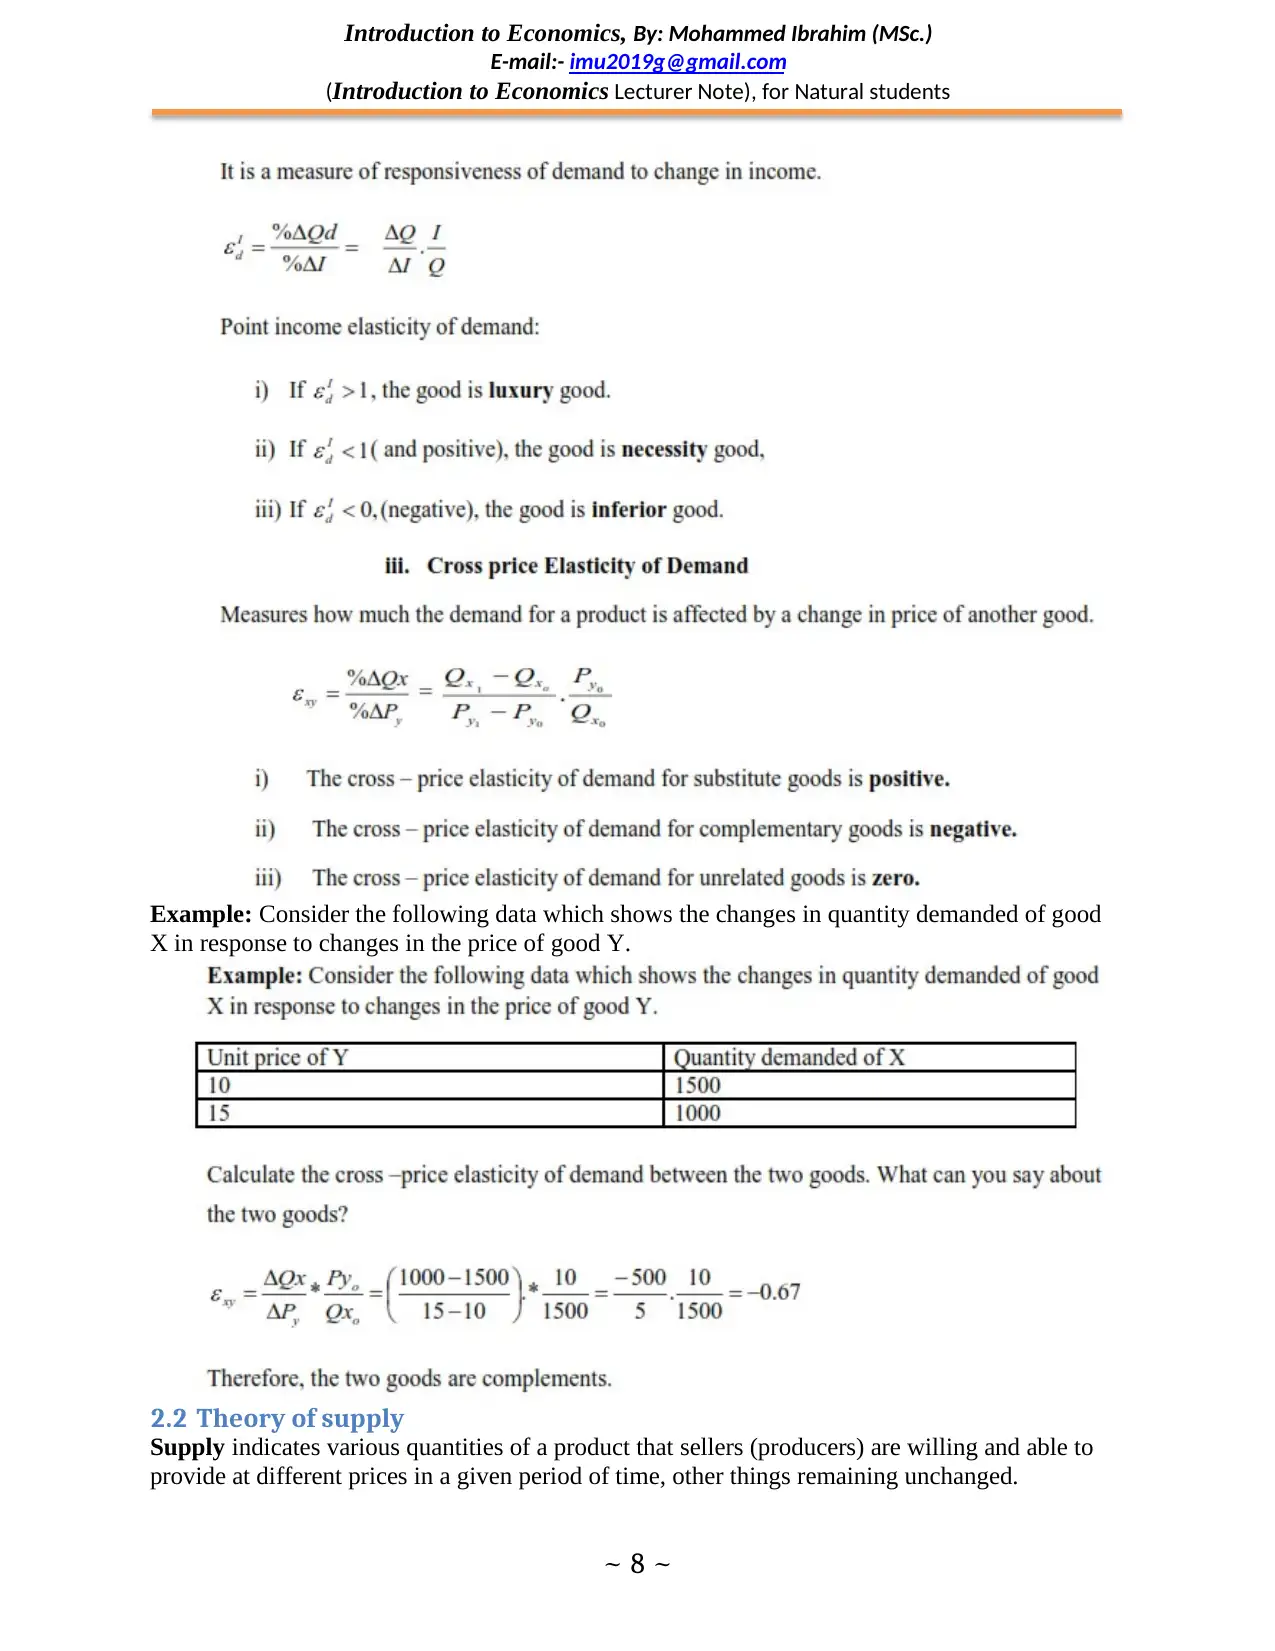
ii. Income Elasticity of Demand
E-mail:- imu2019g@gmail.com
(Introduction to Economics Lecturer Note), for Natural students
~ 7 ~
Determinants of price Elasticity of Demand
The following factors make price elasticity of demand elastic or inelastic other than changes in
the price of the product.
i) The availability of substitutes: the more substitutes available for a product, the more elastic
will be the price elasticity of demand.
ii) Time: In the long- run, price elasticity of demand tends to be elastic. Because:
More substitute goods could be produced.
People tend to adjust their consumption pattern.
iii) The proportion of income consumers spend for a product:-the smaller the proportion of
income spent for a good, the less price elastic will be.
iv) The importance of the commodity in the consumers’ budget :
Luxury goods tend to be more elastic, example: gold.
Necessity goods tend to be less elastic example: Salt.
ii. Income Elasticity of Demand
Paraphrase This Document
Need a fresh take? Get an instant paraphrase of this document with our AI Paraphraser
Introduction to Economics, By: Mohammed Ibrahim (MSc.)
E-mail:- imu2019g@gmail.com
(Introduction to Economics Lecturer Note), for Natural students
~ 8 ~
Example: Consider the following data which shows the changes in quantity demanded of good
X in response to changes in the price of good Y.
2.2 Theory of supply
Supply indicates various quantities of a product that sellers (producers) are willing and able to
provide at different prices in a given period of time, other things remaining unchanged.
Introduction to Economics, By: Mohammed Ibrahim (MSc.)
E-mail:- imu2019g@gmail.com
(Introduction to Economics Lecturer Note), for Natural students
~ 9 ~
The law of supply: states that, ceteris paribus, as price of a product increase, quantity supplied
of the product increases, and as price decreases, quantity supplied decreases. It tells us there is a
positive relationship between price and quantity supplied.
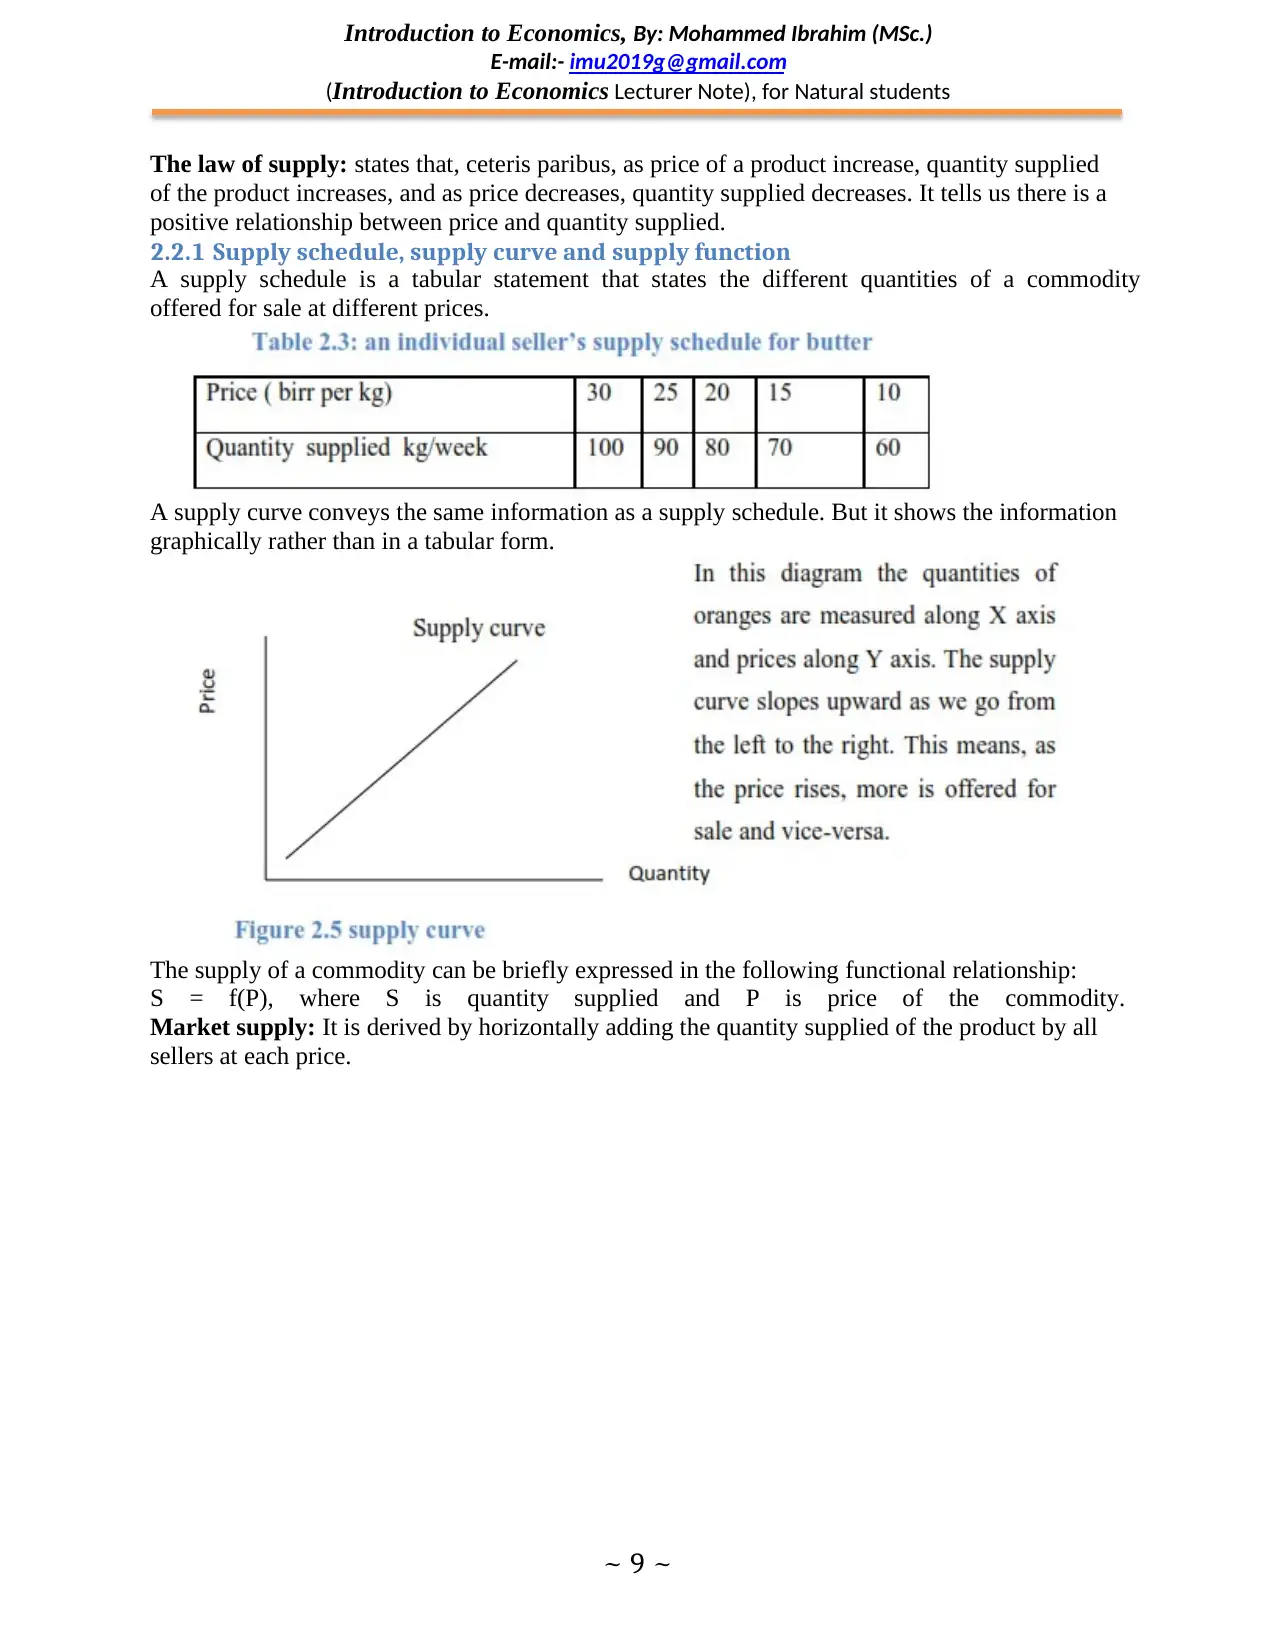
2.2.1 Supply schedule, supply curve and supply function
A supply schedule is a tabular statement that states the different quantities of a commodity
offered for sale at different prices.
A supply curve conveys the same information as a supply schedule. But it shows the information
graphically rather than in a tabular form.
The supply of a commodity can be briefly expressed in the following functional relationship:
S = f(P), where S is quantity supplied and P is price of the commodity.
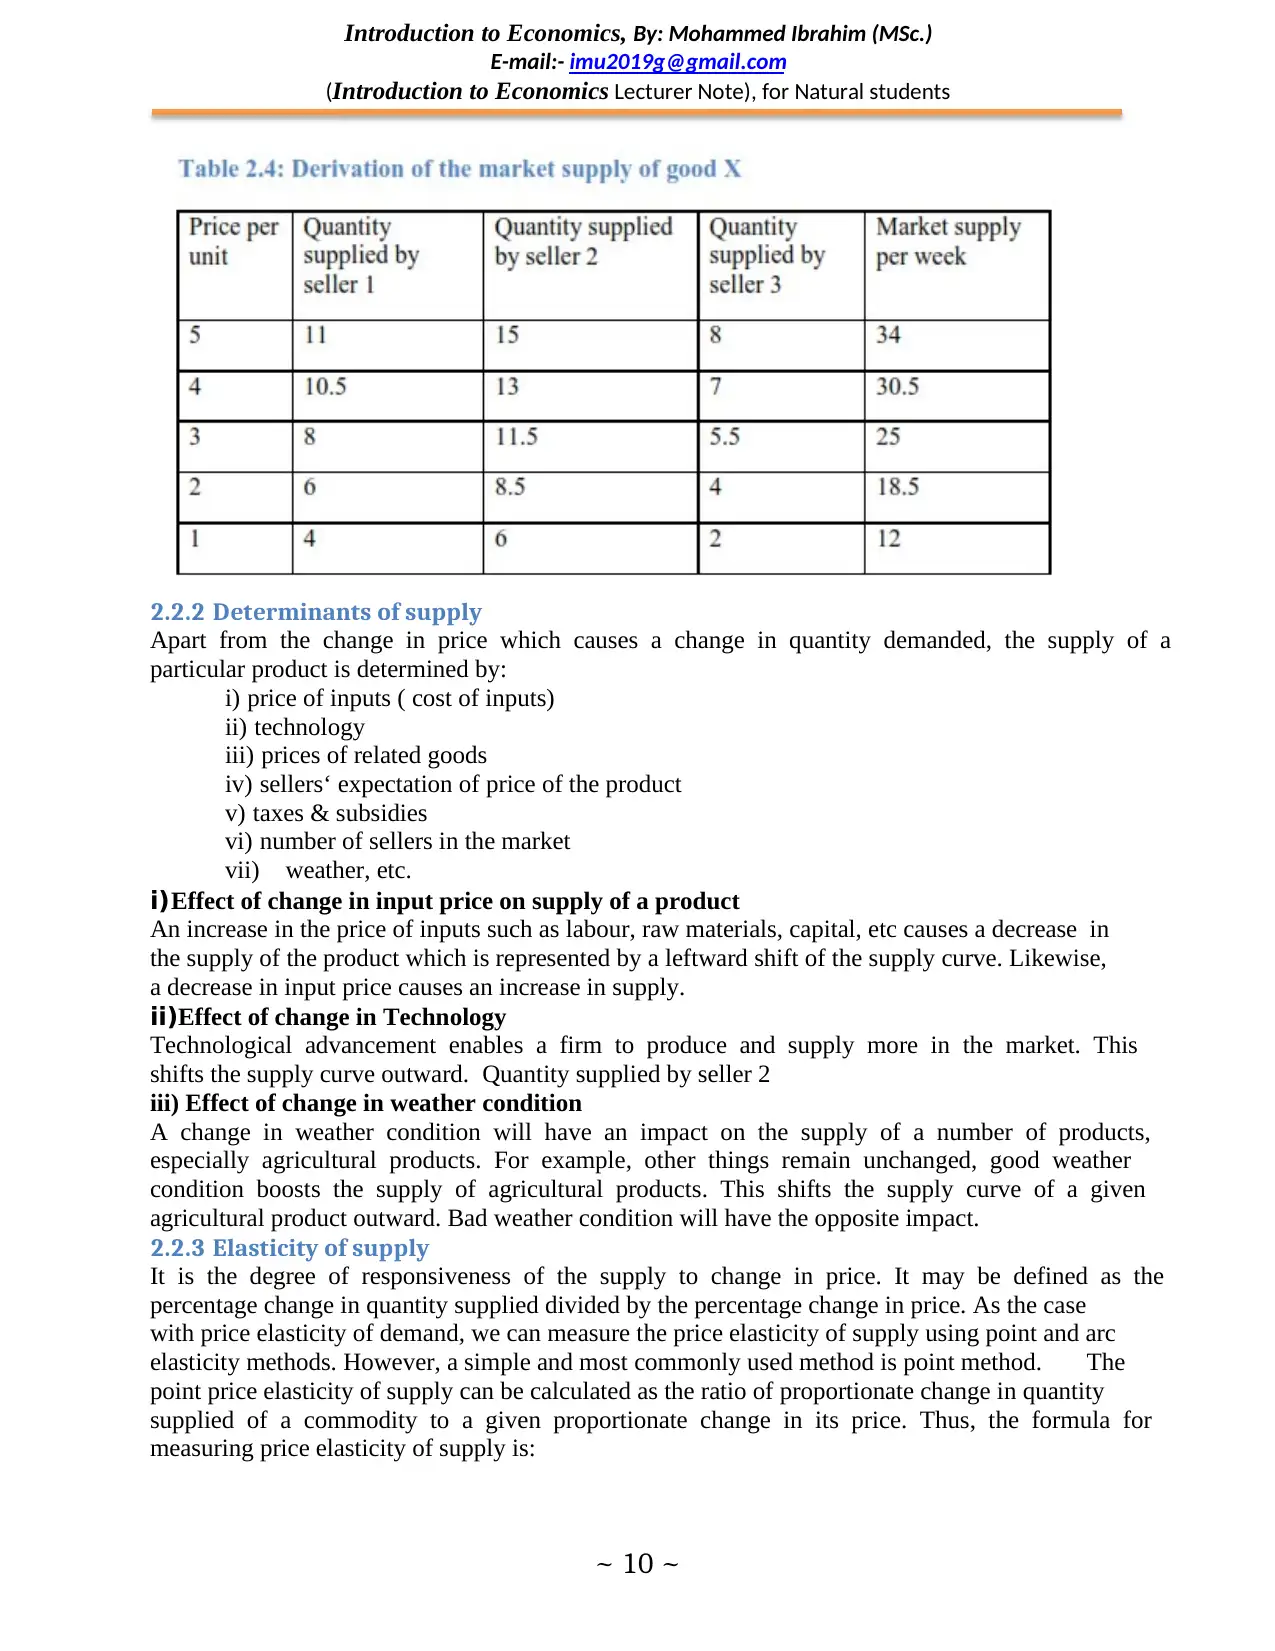
Market supply: It is derived by horizontally adding the quantity supplied of the product by all
sellers at each price.
E-mail:- imu2019g@gmail.com
(Introduction to Economics Lecturer Note), for Natural students
~ 9 ~
The law of supply: states that, ceteris paribus, as price of a product increase, quantity supplied
of the product increases, and as price decreases, quantity supplied decreases. It tells us there is a
positive relationship between price and quantity supplied.
2.2.1 Supply schedule, supply curve and supply function
A supply schedule is a tabular statement that states the different quantities of a commodity
offered for sale at different prices.
A supply curve conveys the same information as a supply schedule. But it shows the information
graphically rather than in a tabular form.
The supply of a commodity can be briefly expressed in the following functional relationship:
S = f(P), where S is quantity supplied and P is price of the commodity.
Market supply: It is derived by horizontally adding the quantity supplied of the product by all
sellers at each price.
⊘ This is a preview!⊘
Do you want full access?
Subscribe today to unlock all pages.
Trusted by 1+ million students worldwide
Introduction to Economics, By: Mohammed Ibrahim (MSc.)
E-mail:- imu2019g@gmail.com
(Introduction to Economics Lecturer Note), for Natural students
~ 10 ~
2.2.2 Determinants of supply
Apart from the change in price which causes a change in quantity demanded, the supply of a
particular product is determined by:
i) price of inputs ( cost of inputs)
ii) technology
iii) prices of related goods
iv) sellers‘ expectation of price of the product
v) taxes & subsidies
vi) number of sellers in the market
vii) weather, etc.
i) Effect of change in input price on supply of a product
An increase in the price of inputs such as labour, raw materials, capital, etc causes a decrease in
the supply of the product which is represented by a leftward shift of the supply curve. Likewise,
a decrease in input price causes an increase in supply.
ii)Effect of change in Technology
Technological advancement enables a firm to produce and supply more in the market. This
shifts the supply curve outward. Quantity supplied by seller 2
iii) Effect of change in weather condition
A change in weather condition will have an impact on the supply of a number of products,
especially agricultural products. For example, other things remain unchanged, good weather
condition boosts the supply of agricultural products. This shifts the supply curve of a given
agricultural product outward. Bad weather condition will have the opposite impact.
2.2.3 Elasticity of supply
It is the degree of responsiveness of the supply to change in price. It may be defined as the
percentage change in quantity supplied divided by the percentage change in price. As the case
with price elasticity of demand, we can measure the price elasticity of supply using point and arc
elasticity methods. However, a simple and most commonly used method is point method. The
point price elasticity of supply can be calculated as the ratio of proportionate change in quantity
supplied of a commodity to a given proportionate change in its price. Thus, the formula for
measuring price elasticity of supply is:
Paraphrase This Document
Need a fresh take? Get an instant paraphrase of this document with our AI Paraphraser
Introduction to Economics, By: Mohammed Ibrahim (MSc.)
E-mail:- imu2019g@gmail.com
(Introduction to Economics Lecturer Note), for Natural students
~ 11 ~
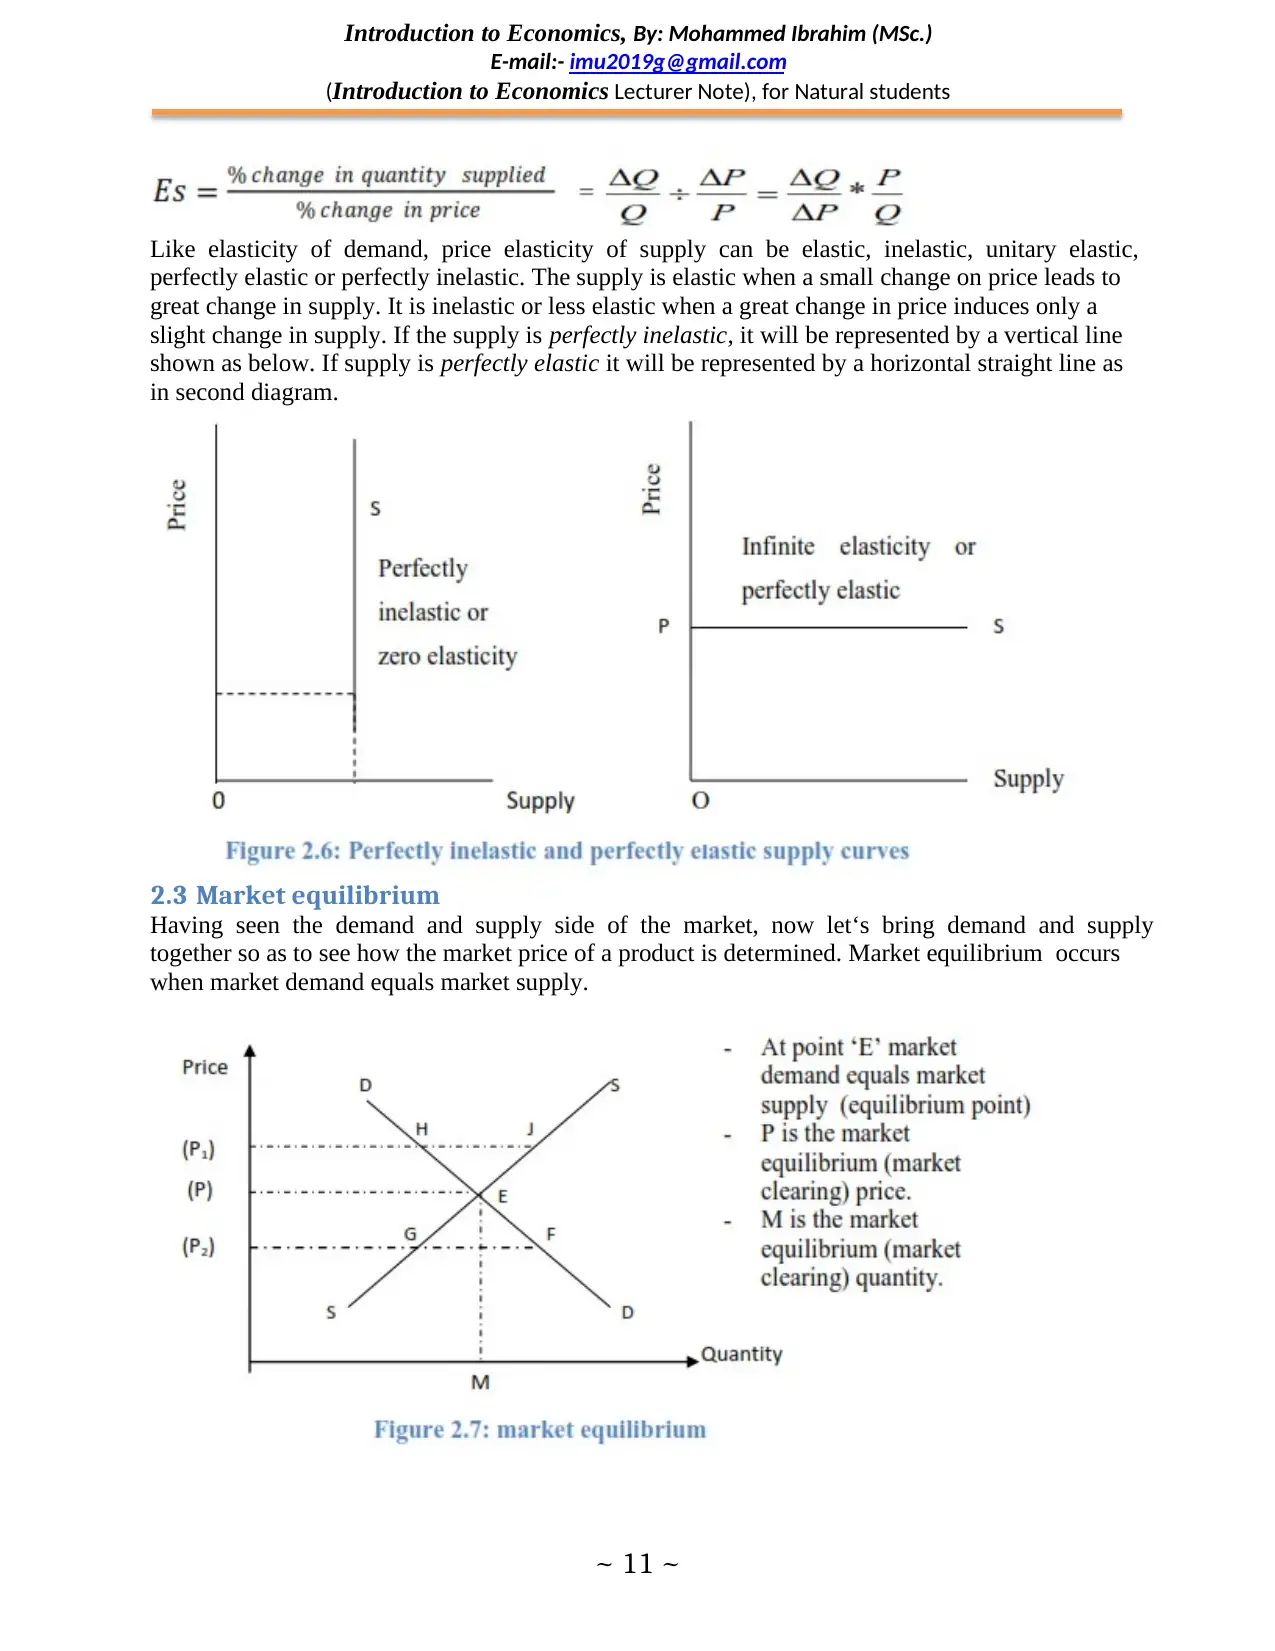
Like elasticity of demand, price elasticity of supply can be elastic, inelastic, unitary elastic,
perfectly elastic or perfectly inelastic. The supply is elastic when a small change on price leads to
great change in supply. It is inelastic or less elastic when a great change in price induces only a
slight change in supply. If the supply is perfectly inelastic, it will be represented by a vertical line
shown as below. If supply is perfectly elastic it will be represented by a horizontal straight line as
in second diagram.
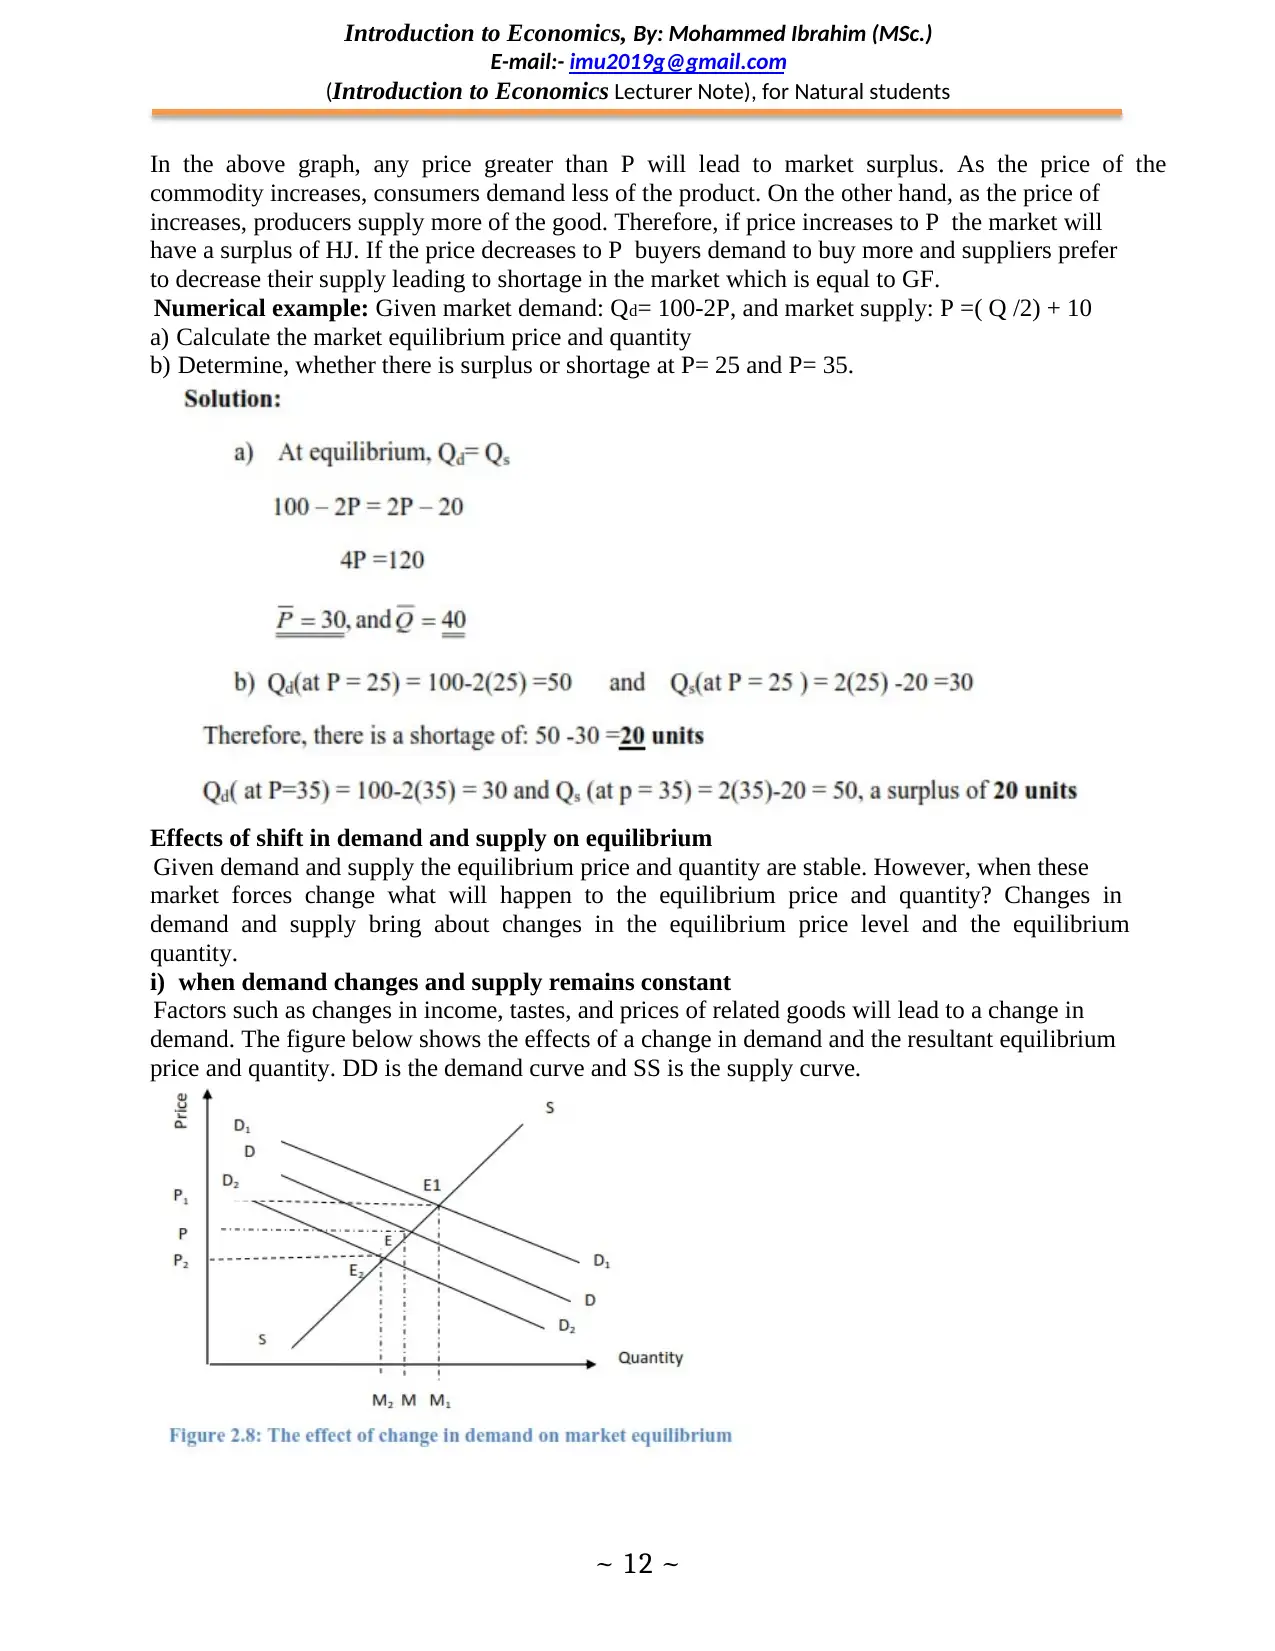
2.3 Market equilibrium
Having seen the demand and supply side of the market, now let‘s bring demand and supply
together so as to see how the market price of a product is determined. Market equilibrium occurs
when market demand equals market supply.
E-mail:- imu2019g@gmail.com
(Introduction to Economics Lecturer Note), for Natural students
~ 11 ~
Like elasticity of demand, price elasticity of supply can be elastic, inelastic, unitary elastic,
perfectly elastic or perfectly inelastic. The supply is elastic when a small change on price leads to
great change in supply. It is inelastic or less elastic when a great change in price induces only a
slight change in supply. If the supply is perfectly inelastic, it will be represented by a vertical line
shown as below. If supply is perfectly elastic it will be represented by a horizontal straight line as
in second diagram.
2.3 Market equilibrium
Having seen the demand and supply side of the market, now let‘s bring demand and supply
together so as to see how the market price of a product is determined. Market equilibrium occurs
when market demand equals market supply.
Introduction to Economics, By: Mohammed Ibrahim (MSc.)
E-mail:- imu2019g@gmail.com
(Introduction to Economics Lecturer Note), for Natural students
~ 12 ~
In the above graph, any price greater than P will lead to market surplus. As the price of the
commodity increases, consumers demand less of the product. On the other hand, as the price of
increases, producers supply more of the good. Therefore, if price increases to P the market will
have a surplus of HJ. If the price decreases to P buyers demand to buy more and suppliers prefer
to decrease their supply leading to shortage in the market which is equal to GF.
Numerical example: Given market demand: Qd= 100-2P, and market supply: P =( Q /2) + 10
a) Calculate the market equilibrium price and quantity
b) Determine, whether there is surplus or shortage at P= 25 and P= 35.
Effects of shift in demand and supply on equilibrium
Given demand and supply the equilibrium price and quantity are stable. However, when these
market forces change what will happen to the equilibrium price and quantity? Changes in
demand and supply bring about changes in the equilibrium price level and the equilibrium
quantity.
i) when demand changes and supply remains constant
Factors such as changes in income, tastes, and prices of related goods will lead to a change in
demand. The figure below shows the effects of a change in demand and the resultant equilibrium
price and quantity. DD is the demand curve and SS is the supply curve.
⊘ This is a preview!⊘
Do you want full access?
Subscribe today to unlock all pages.
Trusted by 1+ million students worldwide
1 out of 13
Related Documents


Your All-in-One AI-Powered Toolkit for Academic Success.
+13062052269
info@desklib.com
Available 24*7 on WhatsApp / Email
![[object Object]](/_next/static/media/star-bottom.7253800d.svg)
Unlock your academic potential
Copyright © 2020–2026 A2Z Services. All Rights Reserved. Developed and managed by ZUCOL.