ENEM20003 Project: Aluminum Refining Flow Process Design, Term 1, 2020
VerifiedAdded on 2022/07/28
|38
|3817
|19
Project
AI Summary
This project focuses on designing a flow processing system for an aluminum refining plant, covering key aspects of thermofluids engineering. The project begins with an executive summary outlining the Bayer and Hall-Heroult processes for aluminum production. It includes detailed pump system design and calculations, incorporating system schematics, friction loss calculations, and duty point analysis. The design extends to the precipitation tank, addressing scaling and agitation. The project also involves cavitation checks, power cost analysis, and an exploration of alternative transportation systems. The report provides a comprehensive analysis of the flow process, including calculations, design schematics, and literature review. The project aims to understand industrial processes and factors to consider when designing flow processes within the aluminum refining plant.
ENEM20003: Thermofluids Engineering Applications
Term 1, 2020
Project Choose an item. Report
Title: Choose an item.
Submitted on Click or tap to enter a date. in Choose an item.
by
Team ID: Choose an item.
Student ID Full Name
School of Engineering and Technology
Central Queensland University
Australia
Term 1, 2020
Project Choose an item. Report
Title: Choose an item.
Submitted on Click or tap to enter a date. in Choose an item.
by
Team ID: Choose an item.
Student ID Full Name
School of Engineering and Technology
Central Queensland University
Australia
Paraphrase This Document
Need a fresh take? Get an instant paraphrase of this document with our AI Paraphraser
Executive Summary
It is essentially important to understand the processes of aluminum production from
its ore, Bauxite. This is achieved by two processes, Bayer and Hall-Heroult, developed in the
late ’80s by Josef Bayer and Hall in Austria. The Bayer process involves three processes to
produce alumina oxide. These processes are; digestion, clarification, precipitation, and
calcination. During digestion, the ore is crushed into small powder particles and dissolved in
sodium hydroxide solution at around 175 degrees Celsius. In clarification, the solids settle
and are removed. In the precipitation stage, the alkaline slurry is cooled to around 32 degrees
Celsius where alumina hydroxide precipitates out. This process involves agitation, cooling,
and seeding. In the final stage, calcination, the solution is heated to give off moisture to
produce aluminum oxide powder which is transported to the Hall-Heroult plant or other uses.
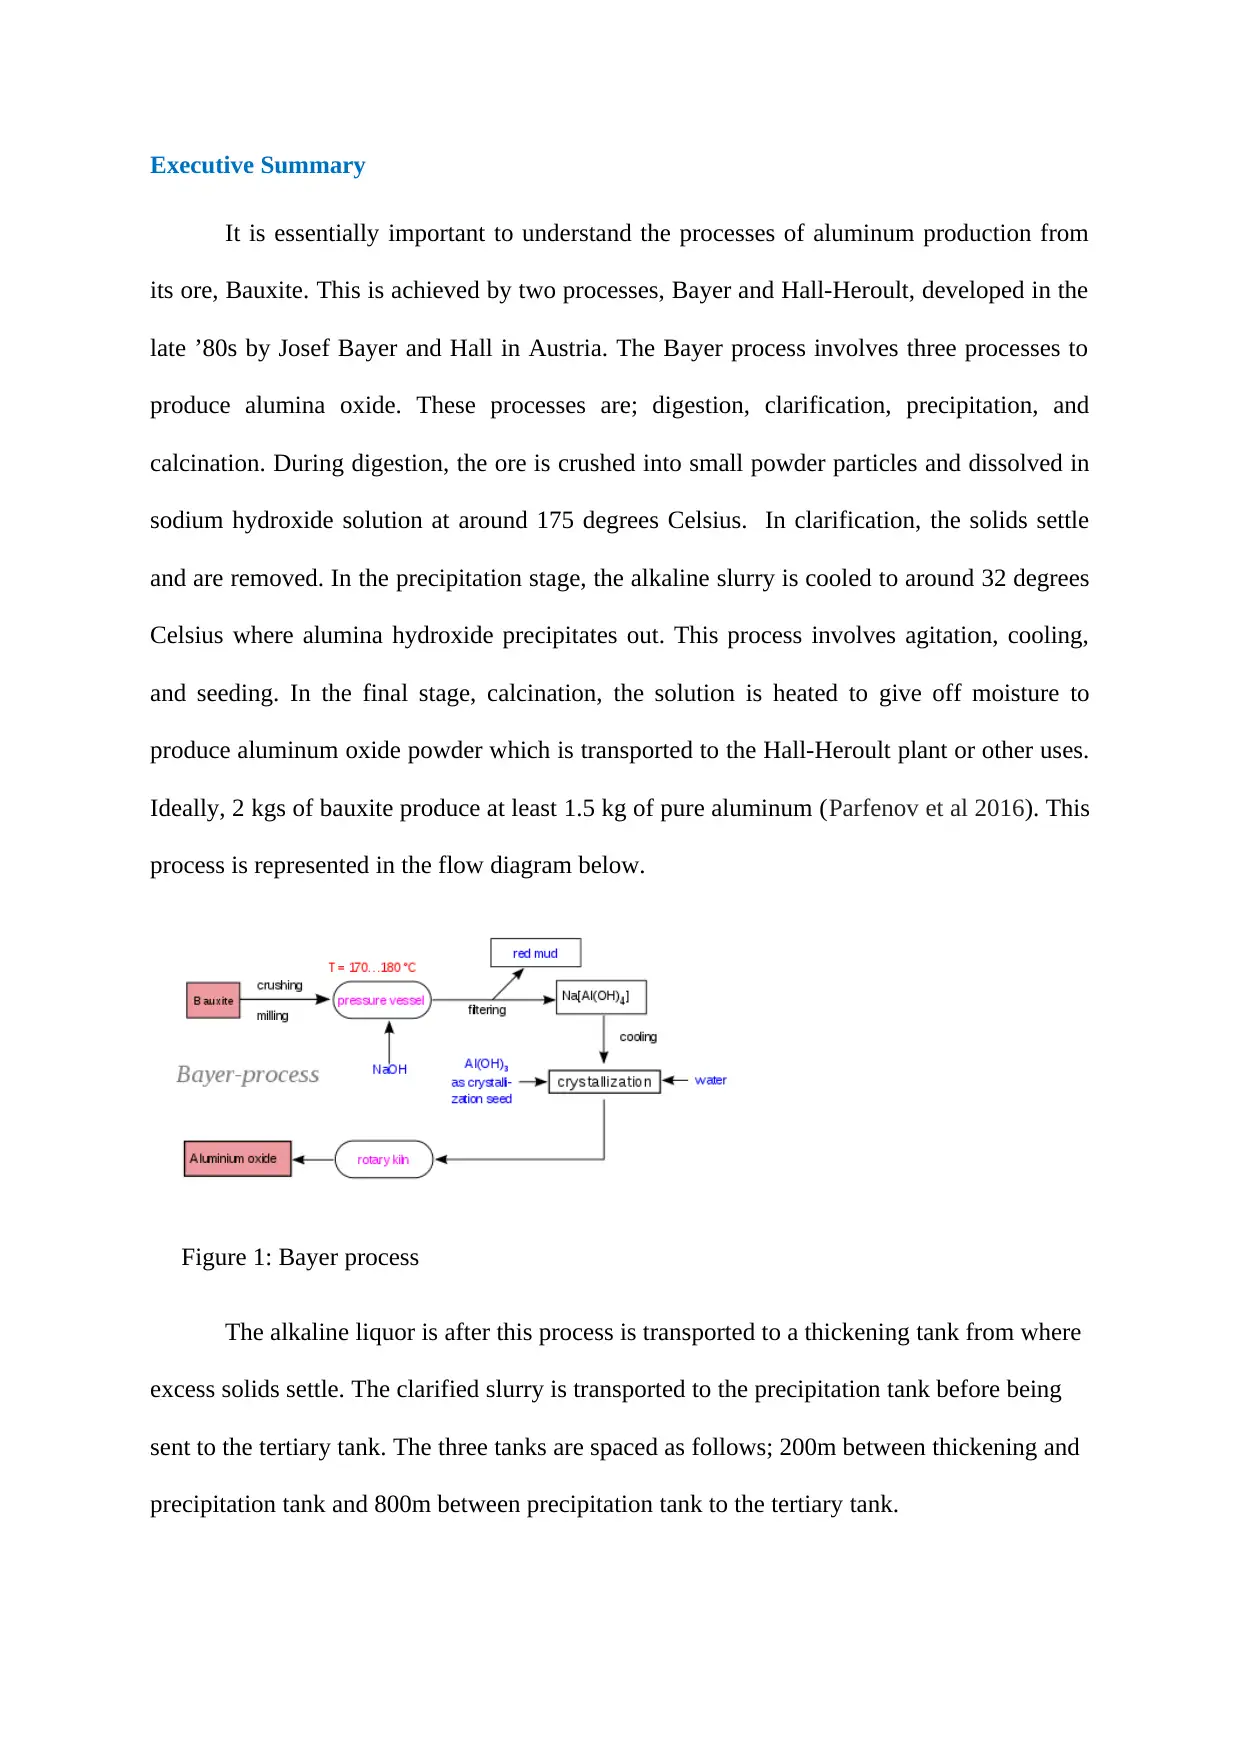
Ideally, 2 kgs of bauxite produce at least 1.5 kg of pure aluminum (Parfenov et al 2016). This
process is represented in the flow diagram below.
Figure 1: Bayer process
The alkaline liquor is after this process is transported to a thickening tank from where
excess solids settle. The clarified slurry is transported to the precipitation tank before being
sent to the tertiary tank. The three tanks are spaced as follows; 200m between thickening and
precipitation tank and 800m between precipitation tank to the tertiary tank.
It is essentially important to understand the processes of aluminum production from
its ore, Bauxite. This is achieved by two processes, Bayer and Hall-Heroult, developed in the
late ’80s by Josef Bayer and Hall in Austria. The Bayer process involves three processes to
produce alumina oxide. These processes are; digestion, clarification, precipitation, and
calcination. During digestion, the ore is crushed into small powder particles and dissolved in
sodium hydroxide solution at around 175 degrees Celsius. In clarification, the solids settle
and are removed. In the precipitation stage, the alkaline slurry is cooled to around 32 degrees
Celsius where alumina hydroxide precipitates out. This process involves agitation, cooling,
and seeding. In the final stage, calcination, the solution is heated to give off moisture to
produce aluminum oxide powder which is transported to the Hall-Heroult plant or other uses.
Ideally, 2 kgs of bauxite produce at least 1.5 kg of pure aluminum (Parfenov et al 2016). This
process is represented in the flow diagram below.
Figure 1: Bayer process
The alkaline liquor is after this process is transported to a thickening tank from where
excess solids settle. The clarified slurry is transported to the precipitation tank before being
sent to the tertiary tank. The three tanks are spaced as follows; 200m between thickening and
precipitation tank and 800m between precipitation tank to the tertiary tank.

Declaration of Contribution
(Insert the signed document here)
(Insert the signed document here)
⊘ This is a preview!⊘
Do you want full access?
Subscribe today to unlock all pages.
Trusted by 1+ million students worldwide
Table of Contents
Executive Summary...................................................................................................................2
Declaration of Contribution.......................................................................................................3
Table of Contents.......................................................................................................................4
List of Figures............................................................................................................................5
List of Tables..............................................................................................................................6
List of Abbreviations and Acronyms.........................................................................................7
PART A: General (10 marks)......................................8
A.1 Introduction, aim, and objectives of the project..............................................................8
A.2 Brief literature review relevant to this project................................................................9
A.3 Brief description of related systems..............................................................................10
A.4 Assumptions and data presentation...............................................................................11
A.5 Academic writing and Referencing...............................................................................11
PART B: Pump system design and calculation (50 marks).......................................12
B.1 Project schematic showing relevant components (front and top use CAD)..................12
B.2 Fittings ∑KL values Tables for the full plant pipeline..................................................13
B.3 Pipe material, diameter (I/O), busting pressure, friction factor (f) for entire system
including precipitation tank C.2...........................................................................................14
B.4 System equation (static head, dynamic head, and head loss) for Thickening Tank pump
P-101....................................................................................................................................15
B.5 Duty point (DP) of the feed pump for Thickening Tank P101......................................16
B.6 Pump characteristics at DP (head, power, efficiency, specific speed, etc.)..................17
B.7 Draw velocity triangles for inlet and outlet of the pump impeller................................18
B.8 Calculate theoretical head (H), power and compare with DP values............................19
B.9 Cavitation check (NPSHA) for feed pump P-101.........................................................20
B.10 Apply similarity laws for Precipitation & Tertiary pumps P102, P103......................21
B.11 Analyse CH, CP vs CQ at a fixed speed for P-102, P-103 separately........................22
B.12 Cavitation check (NPSHA) for all Tank pumps..........................................................23
B.13 Calculate total power cost per day for running all pumps (show in a Table)..............25
PART C: Precipitation tank design (scaling & agitation system) (15 marks)..........26
C.1 Brief literature on scaling and scale mitigation.............................................................26
C.2 Detail design of a simplified agitator system in the precipitation tank.........................27
C.3 Analysis of velocity and power required for scale suppression....................................29
Paraphrase This Document
Need a fresh take? Get an instant paraphrase of this document with our AI Paraphraser
D.1 General description and assumption for rheometer design...........................................30
D.2 Design/schematics and theory.......................................................................................31
D.3 Location of installation and soundness of the operation)..............................................32
PART E: Alternate transportation system design (5 marks).........................................33
E.1 General discussion on the type of transportation...........................................................33
E.2 Schematics and operating principles.............................................................................34
E.3 Justification/comparative assessment with the existing method...................................35
PART F: Others (10 marks).....................................36
F.1 Conclusion and recommendations.................................................................................36
References............................................................................................................................37
List of Figures
Figure 1: Process Flow Schematic...........................................................................................13
Figure 2: K-Factors (Source: Janna, 2014)..............................................................................14
Figure 3: Duty Points (Source, Grundfos.com).......................................................................17
Figure 4:Pump Curves (Source: Grundfos.com)......................................................................18
Figure 5: Velocity Diagram.....................................................................................................19
Figure 6:Pump Curves (Source: Grundfos.com)......................................................................20
Figure 7: Pump Curves (Source: Grundfos.com).....................................................................21
Figure 8: Pump Schematic.......................................................................................................23
Figure 9:Pump Curves (Source: Grundfos.com)......................................................................24
Figure 10:Pump Curves (Source: Grundfos.com)....................................................................25
Figure 11:Swirl agitator...........................................................................................................28
Figure 12:Agitation schematic.................................................................................................28
Figure 13:Rheometer Schematic..............................................................................................32
Figure 14: Alternative schematic.............................................................................................35
⊘ This is a preview!⊘
Do you want full access?
Subscribe today to unlock all pages.
Trusted by 1+ million students worldwide

List of Tables
Table 1: K-Factors for Various Fittings...................................................................................16
Table 1: K-Factors for Various Fittings...................................................................................16
Paraphrase This Document
Need a fresh take? Get an instant paraphrase of this document with our AI Paraphraser

List of Abbreviations and Acronyms
PVC- Poly Vinyl Chloride
NPSH-Net Positive Suction Pressure
V-Velocity
g-Gravity
D-Diameter
H-Head
Q-Flow rate
f-Friction factor
PVC- Poly Vinyl Chloride
NPSH-Net Positive Suction Pressure
V-Velocity
g-Gravity
D-Diameter
H-Head
Q-Flow rate
f-Friction factor
PART A: General (10 marks)
A.1 Introduction, aim, and objectives of the project
In this project, Thermal fluids Engineering Applications are put in place in the study
of Aluminium production. This project aims to develop a flow process for the slurry in the
Aluminium refining plant. The importance of this design is to help understand the industrial
processes as well as factors to consider when designing flow processes. Bayer and Hall-
Heroult processes shall be explored as they are the main modern processes for pure aluminum
metal production.
⊘ This is a preview!⊘
Do you want full access?
Subscribe today to unlock all pages.
Trusted by 1+ million students worldwide
A.2 Brief literature review relevant to this project
Since ancient times when man discovered mineral ores, processes have been developed since
then to suite different extractions from these ores. The mineral ores are as a result of
processes within the earth interiors that happened millions and billions of years ago. Final
metal products that people interact with daily are the end products of the processes. In this
case, aluminum is the end product under study. According to (Den Hond et al 2016),
Aluminum ore was refined using alkaline acids and thermal methods in the past decades.
However, this extraction method was deemed expensive and did not meet the standard for
pure aluminum. According to (Sun et al), in the middle east, lime and soda were used as
extraction solvents. Since the aluminum ore contains several impurities such as iron oxide
and silica, these extraction processes did not exhaust these impurities and hence the process
turned to be environmentally hazardous.
Paraphrase This Document
Need a fresh take? Get an instant paraphrase of this document with our AI Paraphraser
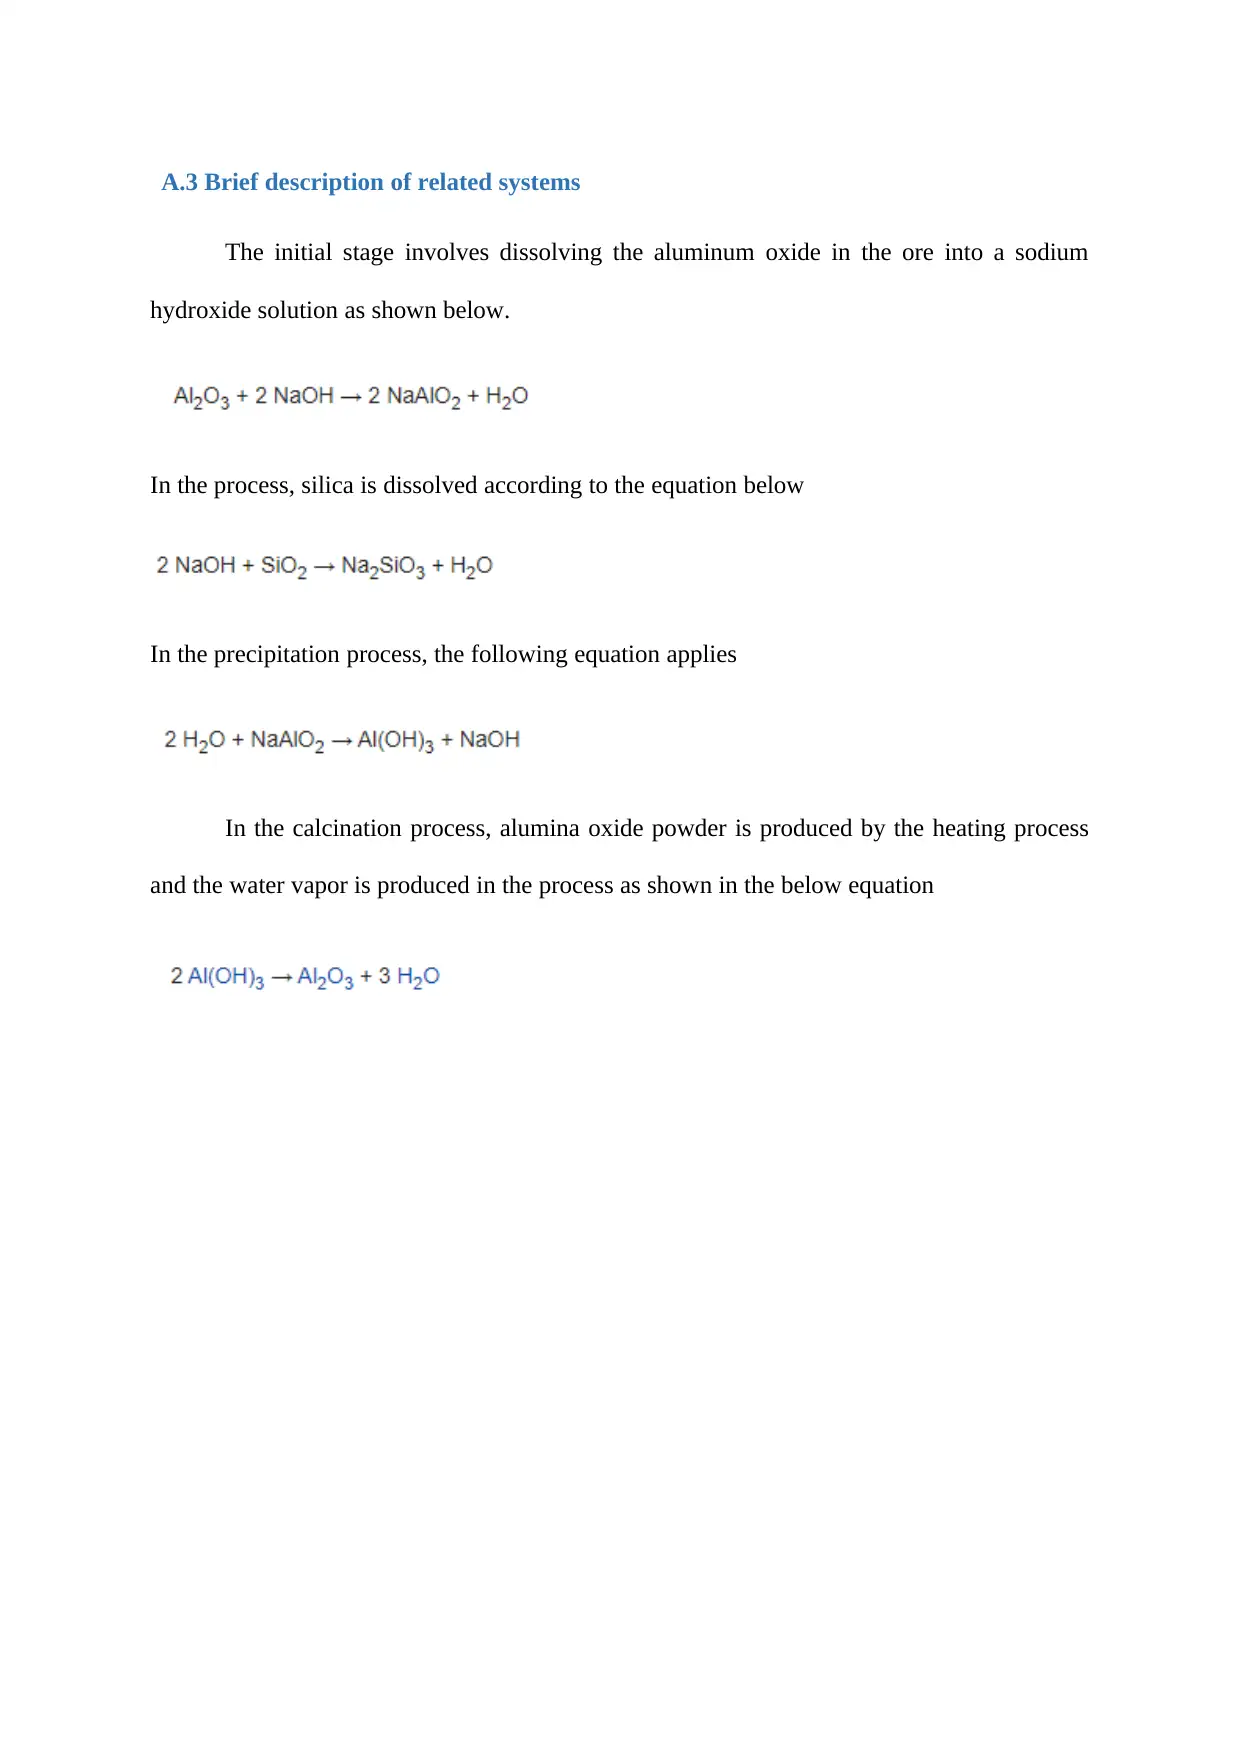
A.3 Brief description of related systems
The initial stage involves dissolving the aluminum oxide in the ore into a sodium
hydroxide solution as shown below.
In the process, silica is dissolved according to the equation below
In the precipitation process, the following equation applies
In the calcination process, alumina oxide powder is produced by the heating process
and the water vapor is produced in the process as shown in the below equation
A.4 Assumptions and data presentation
It is assumed that the Aluminum ore contains minimal impurities and that the Bayer
and Hall-Heroult processes produce a substantial amount of red mud. The red mud will be put
into ceramics production and the final waste shall be disposed of as per the statutes. It is also
assumed that no red mud dries shall be recycled to produce aluminum since this has proven
environmental hazards in the past. Finally, it is assumed that the end product from the process
is pure aluminum that is ready for further machining processes to produce usable products.
A.5 Academic writing and Referencing
(No need to address because it is on the overall report)
⊘ This is a preview!⊘
Do you want full access?
Subscribe today to unlock all pages.
Trusted by 1+ million students worldwide
1 out of 38
Your All-in-One AI-Powered Toolkit for Academic Success.
+13062052269
info@desklib.com
Available 24*7 on WhatsApp / Email
![[object Object]](/_next/static/media/star-bottom.7253800d.svg)
Unlock your academic potential
Copyright © 2020–2026 A2Z Services. All Rights Reserved. Developed and managed by ZUCOL.