Financial Performance Analysis of Thomas Cook Group PLC: An Evaluation
VerifiedAdded on 2020/02/14
|12
|2743
|58
Report
AI Summary
This report provides a comprehensive financial analysis of Thomas Cook Group PLC, a leading UK-based travel company. The analysis focuses on the company's performance over two consecutive years, examining key financial ratios to assess profitability, liquidity, efficiency, and solvency. The report delves into the impact of various market factors, including the influence of Brexit on the UK travel and tourism industry. It utilizes ratio analysis to evaluate the company's financial health and provides insights into its strengths and weaknesses. The study concludes with recommendations for potential investors, considering the risks and opportunities within the current market conditions. The report highlights the importance of understanding both internal and external factors influencing the company's performance to make informed financial decisions. The report draws on multiple sources, including academic journals, online resources, and company reports, to support its findings.
Analyse Financial Statement
1
1
Paraphrase This Document
Need a fresh take? Get an instant paraphrase of this document with our AI Paraphraser
EXECUTIVE SUMMARY
With the changing era, more of the people desire to make a trip at different popular and famous
places of the world. In UK, Thomas Cook is one of the world’s leading or famous tour operators
who design package holidays for the people. This study aimed at examining the external and
internal performance of the company through ratio analysis for the two consecutive years and
current trend and market conditions. Along with this, the report also emphasized the impact of
Brexit on UK travel and tourism industry to advice CFO appropriately who desires to invest money
in the company.
2
Table of Contents
Company Background.....................................................................................................................4
Industry specific and general market factors...................................................................................4
Financial analysis.............................................................................................................................5
Limitation of the analysis................................................................................................................7
Conclusion.......................................................................................................................................7
REFERENCES.....................................................................................................................................8
APPENDIX..........................................................................................................................................9
3
⊘ This is a preview!⊘
Do you want full access?
Subscribe today to unlock all pages.
Trusted by 1+ million students worldwide
Company Background
Thomas Cook Group Plc is one of the leading UK based global travel company and tour
operator who plans tour packages for the visitors at different attractive destinations of the world. It
is listed on London Stock Exchange (LSE) and constituents of FTSE 250 Index. It was established
by the merger of Thomas Cook AG, Thomas Cook & Sons and My Travel Group on 19th June,
2007. It owns number of tour operators and charters who deliver exceptional services to the tourists
to serve them in the best possible manner. Company operates across worldwide such as United
Kingdom, Belgium, Scandinavia, Central Europe, North Europe, Germany and others. Thomas
Cook Retail, Thomas Cook Airline, Condor, Hotels4u and Neckerman are its subsidiaries. It serves
more than 20 million customers by designing tour and holiday packages via online. Its core aim is
to adopt high-technology and high-touch approach to deliver inspiring and attractive personal
journeys to the travellers. Trust, personalization and innovations are the core values of the company
which believes in delivering trusted goods and growing brand portfolio and shape future through
timeless spirit of innovation (Smith, 2014). In the present time of exploring age of new adventures,
Thomas Cook aims at pioneering a trusted heritage and shaped the modern travel experiences by
rendering top-value to the visitors and inspires their dreams.
Industry specific and general market factors
With the changing era, large proportion of the world wishes to visit at attractive tourist
destinations to see the beauty of nature, historical sites, cultural heritage and other places. Thomas
Cook prepares online tour packages for the visitors comprising accommodation, charter airline, and
arrangement of necessary documents, meal, and entertainment and so on. Thus, Thomas Cook
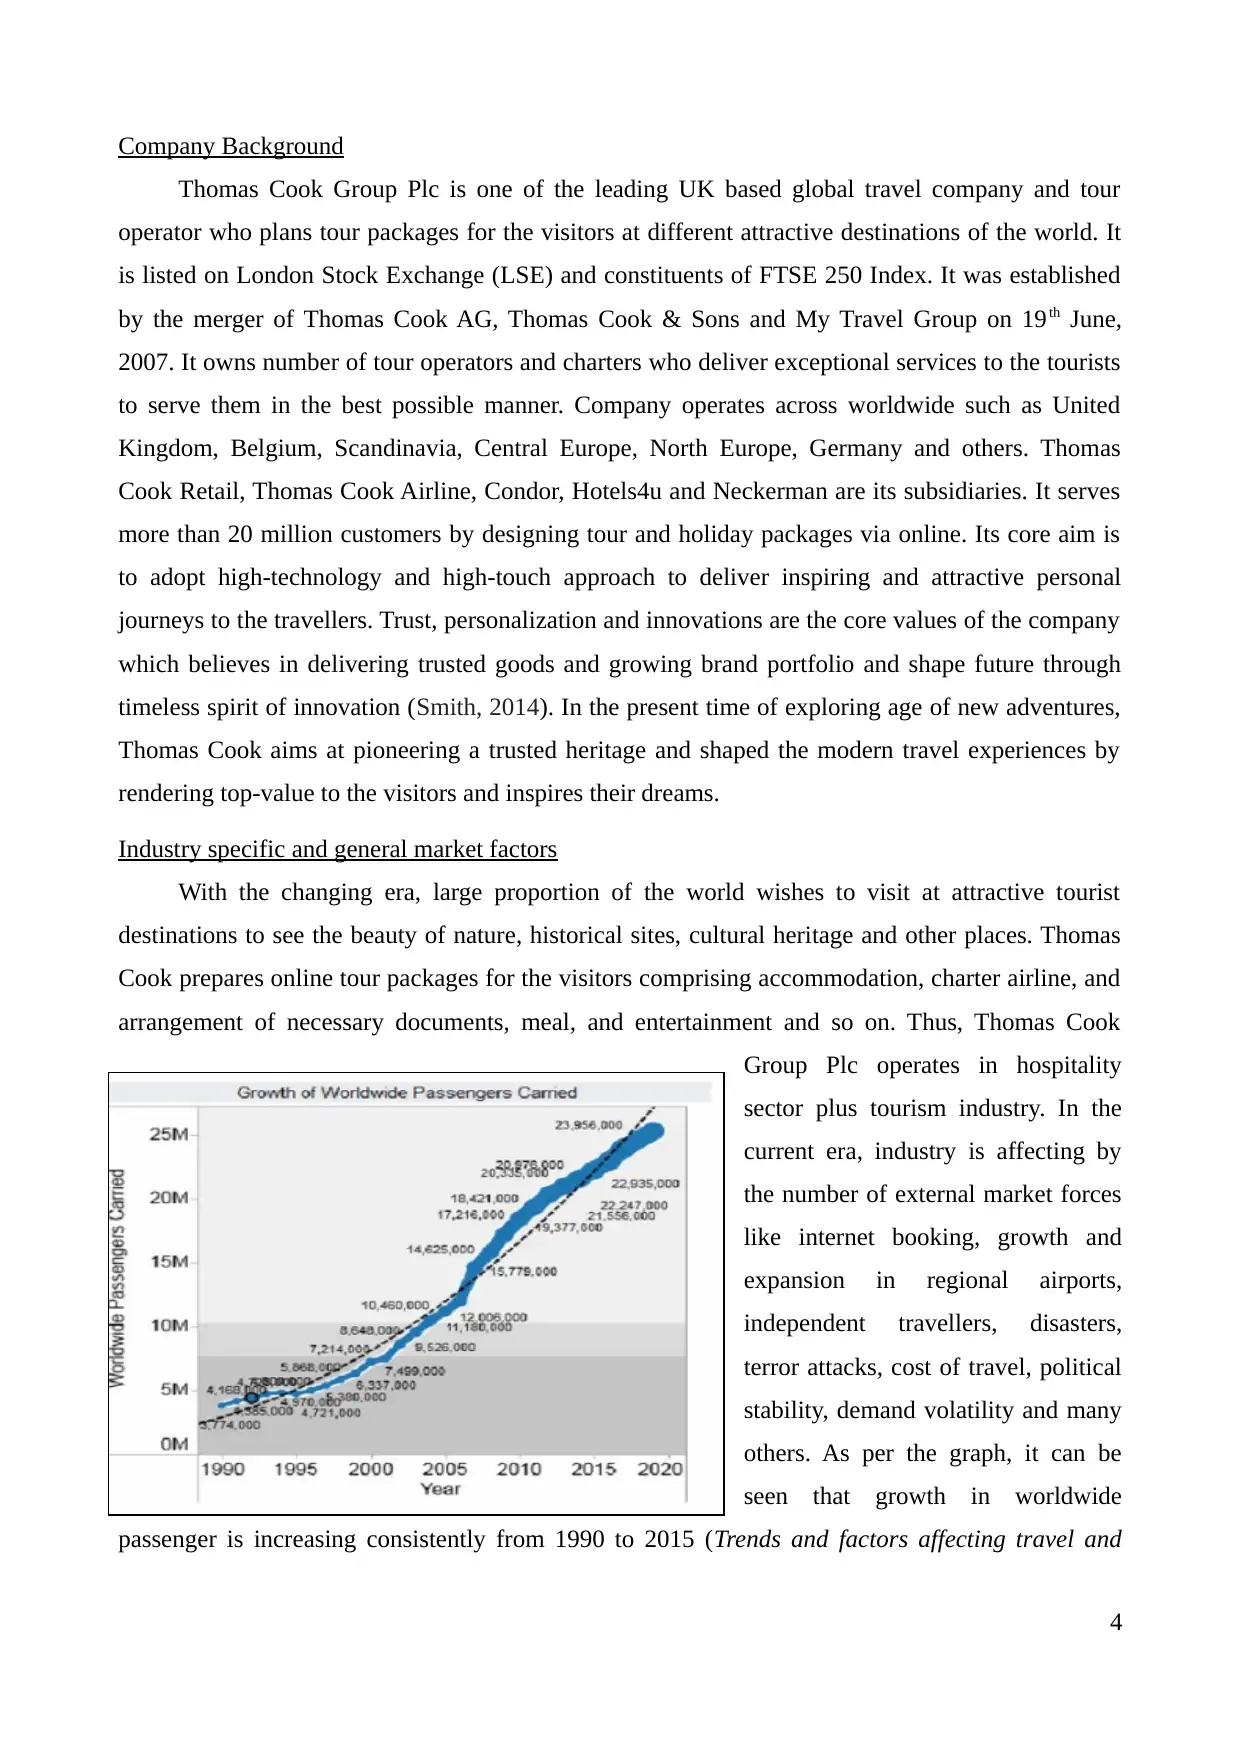
Group Plc operates in hospitality
sector plus tourism industry. In the
current era, industry is affecting by
the number of external market forces
like internet booking, growth and
expansion in regional airports,
independent travellers, disasters,
terror attacks, cost of travel, political
stability, demand volatility and many
others. As per the graph, it can be
seen that growth in worldwide
passenger is increasing consistently from 1990 to 2015 (Trends and factors affecting travel and
4
Thomas Cook Group Plc is one of the leading UK based global travel company and tour
operator who plans tour packages for the visitors at different attractive destinations of the world. It
is listed on London Stock Exchange (LSE) and constituents of FTSE 250 Index. It was established
by the merger of Thomas Cook AG, Thomas Cook & Sons and My Travel Group on 19th June,
2007. It owns number of tour operators and charters who deliver exceptional services to the tourists
to serve them in the best possible manner. Company operates across worldwide such as United
Kingdom, Belgium, Scandinavia, Central Europe, North Europe, Germany and others. Thomas
Cook Retail, Thomas Cook Airline, Condor, Hotels4u and Neckerman are its subsidiaries. It serves
more than 20 million customers by designing tour and holiday packages via online. Its core aim is
to adopt high-technology and high-touch approach to deliver inspiring and attractive personal
journeys to the travellers. Trust, personalization and innovations are the core values of the company
which believes in delivering trusted goods and growing brand portfolio and shape future through
timeless spirit of innovation (Smith, 2014). In the present time of exploring age of new adventures,
Thomas Cook aims at pioneering a trusted heritage and shaped the modern travel experiences by
rendering top-value to the visitors and inspires their dreams.
Industry specific and general market factors
With the changing era, large proportion of the world wishes to visit at attractive tourist
destinations to see the beauty of nature, historical sites, cultural heritage and other places. Thomas
Cook prepares online tour packages for the visitors comprising accommodation, charter airline, and
arrangement of necessary documents, meal, and entertainment and so on. Thus, Thomas Cook
Group Plc operates in hospitality
sector plus tourism industry. In the
current era, industry is affecting by
the number of external market forces
like internet booking, growth and
expansion in regional airports,
independent travellers, disasters,
terror attacks, cost of travel, political
stability, demand volatility and many
others. As per the graph, it can be
seen that growth in worldwide
passenger is increasing consistently from 1990 to 2015 (Trends and factors affecting travel and
4
Paraphrase This Document
Need a fresh take? Get an instant paraphrase of this document with our AI Paraphraser
tourism in UK, 2016). Moreover, the historical trend also depicts that in future period, number of
visitors will be increase. It drive necessity for the companies to enlarge their capacity,
diversification, building more ports, plan packages at more destinations, on-shore activities and
many others so as to meet consumer expectations. In the modern times, package holidays gains
wider popularity across worldwide. Better and cheaper deal as compare to booking a trip via tour
operators is one of the main reason which raises customer base to the industry.
Recently, UK left EU, called Brexit has unsettled the market at a time in the terms of safety
concern and terror attacks across world caused difficulties for Thomas Cook in recent turbulent
economic times due to the following reasons:
76% of the UK planned tourist packages are designed in EU countries and in UK, around
63% of the inbound visitors came from EU nations.
EU allows its member nations to trade freely without any tariff duties, henceforth, Brexit
will results in imposing taxation duties to the travel and tourism companies to trade with EU
countries (What Brexit might mean for UK travel, 2016).
Brexit can results in market uncertainty due to coming new legislations, trade policies and
regulations.
Brexit can also impact value of sterling, which in turn, has a direct impact on travelling cost.
At the time when UK vote to left EU, the value of sterling got hit by 20%, whereas, pound
drop down to $1.15 against dollar and €1.05 against Euro (What leaving the EU could cost
travellers?, 2016). It can affect industry in an adverse direction due to high airline charges,
arrangement for new airline service agreement and others.
Financial analysis
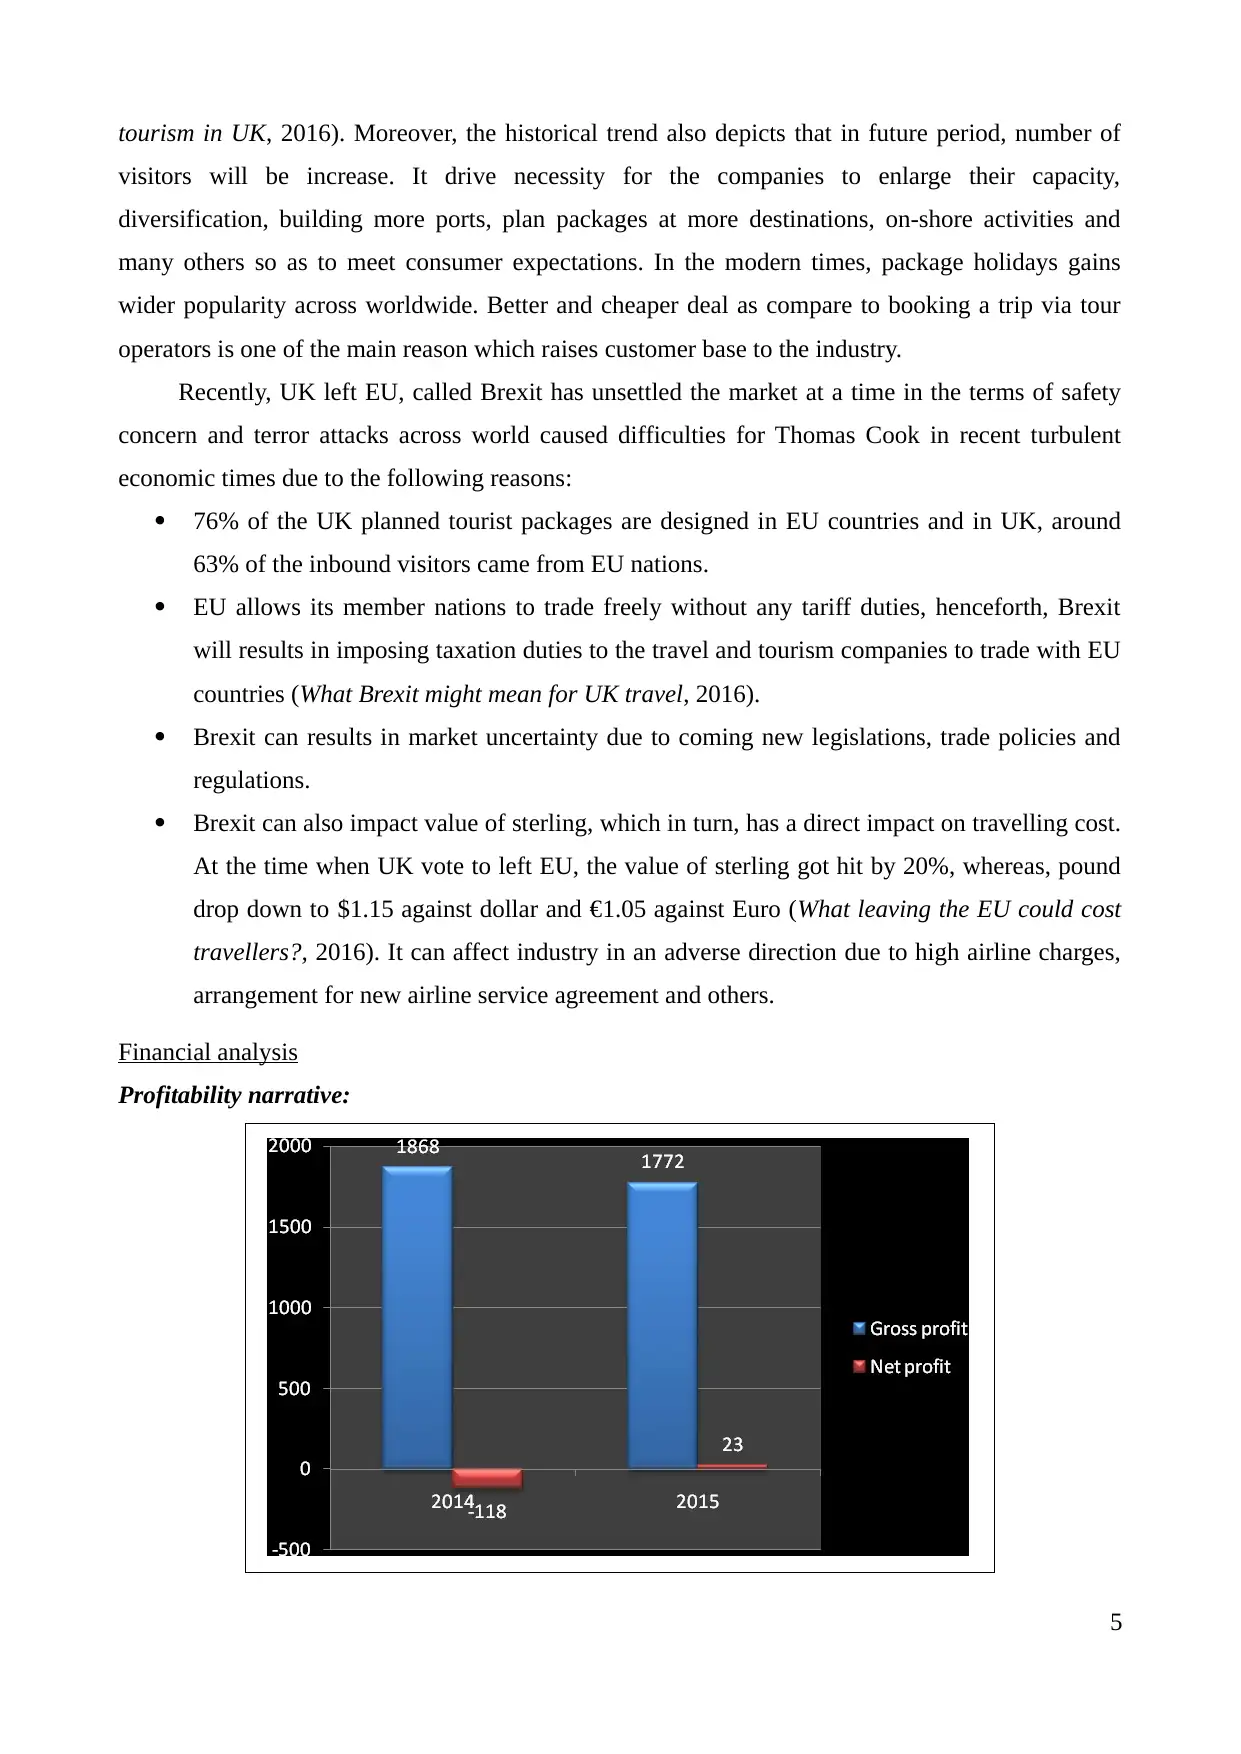
Profitability narrative:
5
visitors will be increase. It drive necessity for the companies to enlarge their capacity,
diversification, building more ports, plan packages at more destinations, on-shore activities and
many others so as to meet consumer expectations. In the modern times, package holidays gains
wider popularity across worldwide. Better and cheaper deal as compare to booking a trip via tour
operators is one of the main reason which raises customer base to the industry.
Recently, UK left EU, called Brexit has unsettled the market at a time in the terms of safety
concern and terror attacks across world caused difficulties for Thomas Cook in recent turbulent
economic times due to the following reasons:
76% of the UK planned tourist packages are designed in EU countries and in UK, around
63% of the inbound visitors came from EU nations.
EU allows its member nations to trade freely without any tariff duties, henceforth, Brexit
will results in imposing taxation duties to the travel and tourism companies to trade with EU
countries (What Brexit might mean for UK travel, 2016).
Brexit can results in market uncertainty due to coming new legislations, trade policies and
regulations.
Brexit can also impact value of sterling, which in turn, has a direct impact on travelling cost.
At the time when UK vote to left EU, the value of sterling got hit by 20%, whereas, pound
drop down to $1.15 against dollar and €1.05 against Euro (What leaving the EU could cost
travellers?, 2016). It can affect industry in an adverse direction due to high airline charges,
arrangement for new airline service agreement and others.
Financial analysis
Profitability narrative:
5

In 2015, Thomas Cook’s gross margin hit up from 21.75% to 22.62%, although, both the
revenue and gross profit got declined to 7834 (8.78%) and 1772 (5.14%) GBP million, but
still, GM rose up only because of strong managerial control over cost of sale as it got
decreased by higher percentage to 9.79% (Khidmat and Rehman, 2014).
However, net profit changed into positive direction from -118 to 23 GBP million by
119.49% resulted in favourable net margin to 121.37%. Effective control over operating
expenses from 1814 to 1561 GBP million by 13.94% and high operating income from 54 to
211 by 290.75% are the reason behind greater yield in this year (Innocent, Mary and
Matthew, 2013).
On the other side, return on equity came down to 7.84% whilst ROCE improved to 7.01%
indicating that this year, company generated greater return on total capital employed but less
return on equity capital invested.
Liquidity narrative:
It measure that how much company has available short-term resources (current assets) to
repay their short-upcoming liabilities, most importantly, creditors (Blankespoor, Miller and
White, 2013).
Growth in CR from 0.47 to 0.55 by 17.03% is good mainly because of high current assets
from 1829 to 2035 GBP million by 11.26%. More availability of cash and its equivalent
from 1087 to 1415 GBP million by 30.17% is the main reason behind improved liquidity
(Iyer and et.al., 2014). Contrary to this, CL shows downward movement from 3894 to 3702
GBP million by 4.93%. Ideal CR is considered 2:1 indicating that Thomas Cook not yet
achieved the target ratio.
Quick ratio/acid test ratio got improved 0.46:1 to 0.54:1 by 17.37% because of decreased
6
⊘ This is a preview!⊘
Do you want full access?
Subscribe today to unlock all pages.
Trusted by 1+ million students worldwide
inventory by 2 million and changes in CA and CL as well (Brida, Deidda and Pulina, 2014).
It reflects that company improved its liquid assets to repay timely to their suppliers and
payables, but still, ideal ratio of 1:1 is not yet achieved.
Efficiency/activity narrative:
Improved assets from 5794 to 5958 GBP million by 2.83% and declined turnover by 8.78%
are the reason behind decreased assets turnover ratio from 1.48 to 1.31 times by 11.29%. It
reflects that Thoams Cook’s managers, executives and departments are not utilizing their
assets in a proper way to generate better turnover (Jansen, Ramnath and Yohn, 2012).
High DTR from 32.84 to 34.59 times by 5.32% is good because it indicates that managers
took some step to maximize their cash position by generating promptly payment from the
receivables. It declined debtors’ days from 11.11 to 10.55 days and maximizes total cash
funds in the business (Vyas and Shah, 2013).
CTR came down from 5.24 to 4.54 times by 13.30% resulted in enhancing payment days
from 67.75 to 78.15 days. It indicates that Thomas Cook mangers have decided to make
delayed payments to the creditors by extending payment duration by 15.35 days helps to
raise cash & its equivalent.
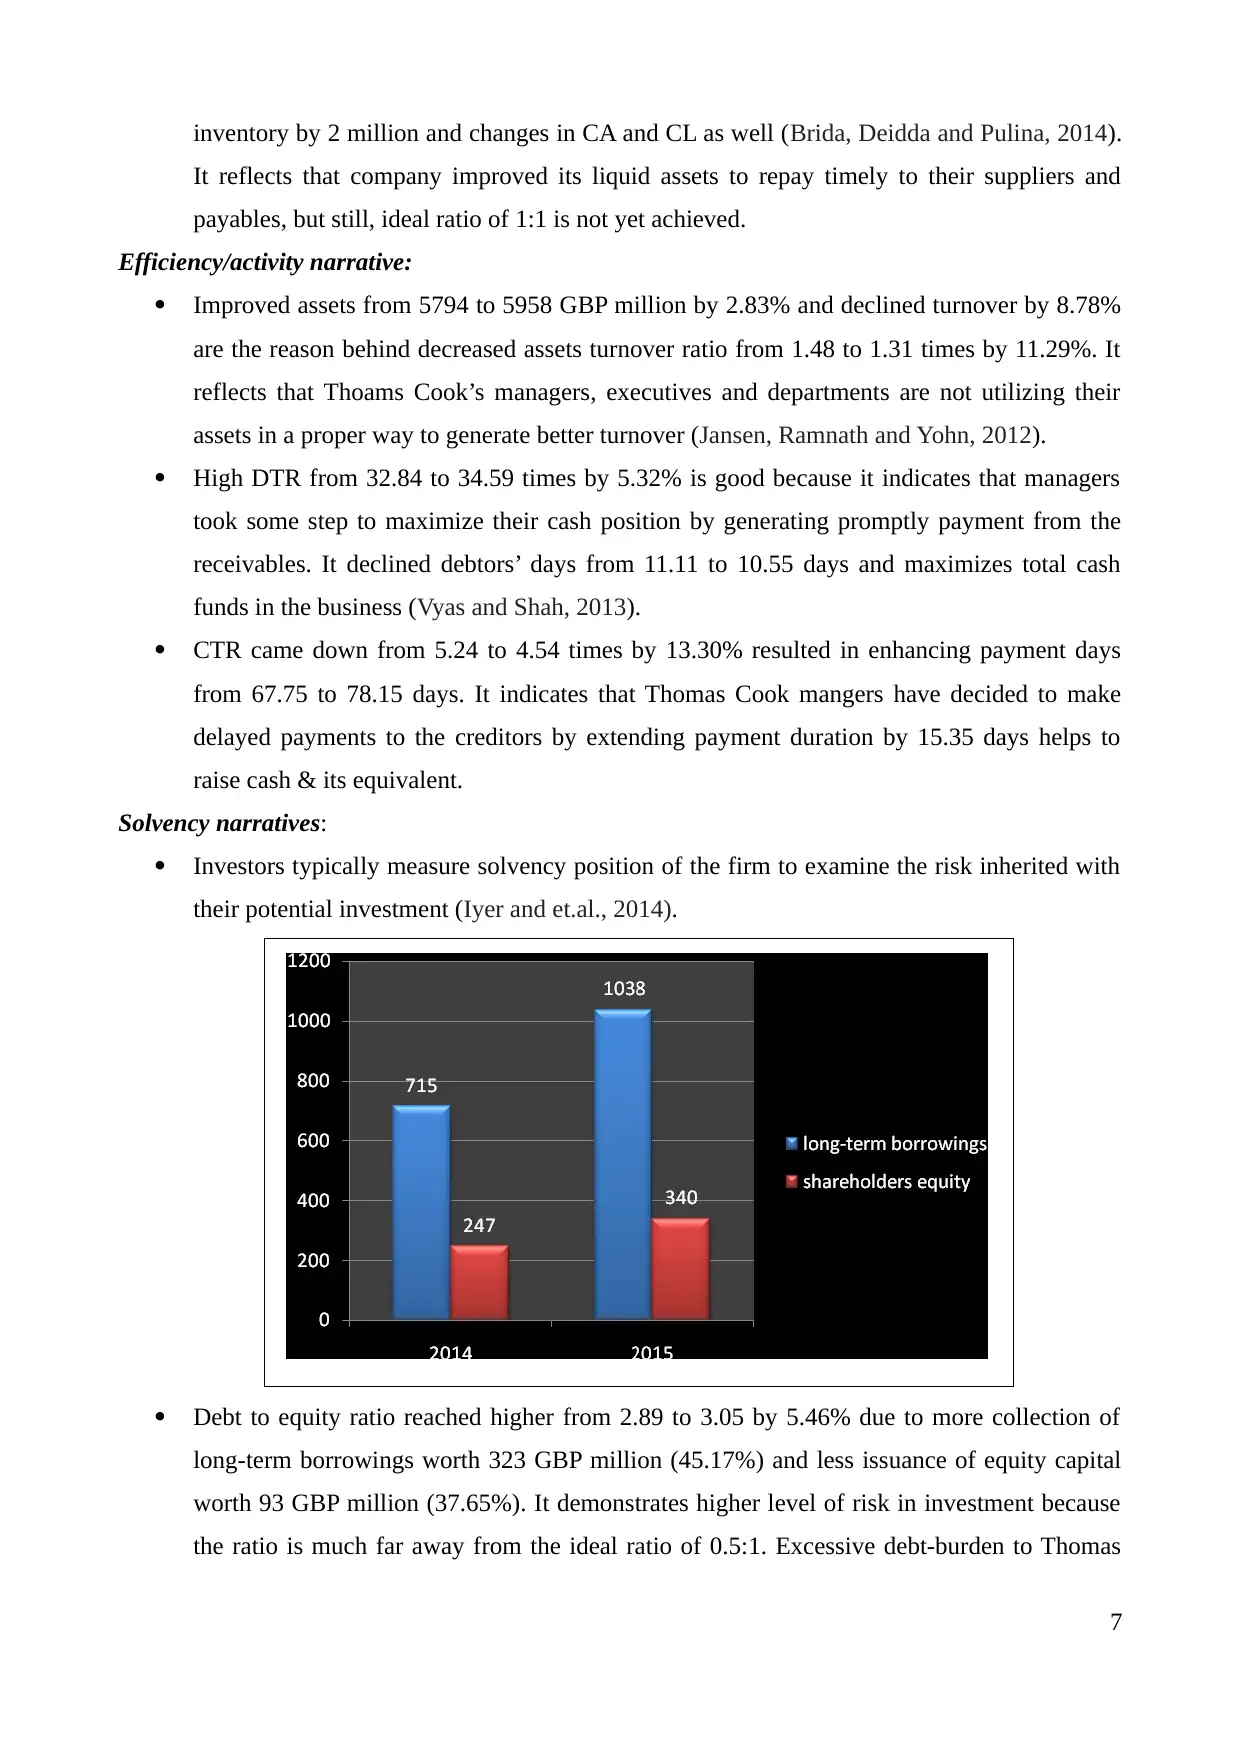
Solvency narratives:
Investors typically measure solvency position of the firm to examine the risk inherited with
their potential investment (Iyer and et.al., 2014).
Debt to equity ratio reached higher from 2.89 to 3.05 by 5.46% due to more collection of
long-term borrowings worth 323 GBP million (45.17%) and less issuance of equity capital
worth 93 GBP million (37.65%). It demonstrates higher level of risk in investment because
the ratio is much far away from the ideal ratio of 0.5:1. Excessive debt-burden to Thomas
7
It reflects that company improved its liquid assets to repay timely to their suppliers and
payables, but still, ideal ratio of 1:1 is not yet achieved.
Efficiency/activity narrative:
Improved assets from 5794 to 5958 GBP million by 2.83% and declined turnover by 8.78%
are the reason behind decreased assets turnover ratio from 1.48 to 1.31 times by 11.29%. It
reflects that Thoams Cook’s managers, executives and departments are not utilizing their
assets in a proper way to generate better turnover (Jansen, Ramnath and Yohn, 2012).
High DTR from 32.84 to 34.59 times by 5.32% is good because it indicates that managers
took some step to maximize their cash position by generating promptly payment from the
receivables. It declined debtors’ days from 11.11 to 10.55 days and maximizes total cash
funds in the business (Vyas and Shah, 2013).
CTR came down from 5.24 to 4.54 times by 13.30% resulted in enhancing payment days
from 67.75 to 78.15 days. It indicates that Thomas Cook mangers have decided to make
delayed payments to the creditors by extending payment duration by 15.35 days helps to
raise cash & its equivalent.
Solvency narratives:
Investors typically measure solvency position of the firm to examine the risk inherited with
their potential investment (Iyer and et.al., 2014).
Debt to equity ratio reached higher from 2.89 to 3.05 by 5.46% due to more collection of
long-term borrowings worth 323 GBP million (45.17%) and less issuance of equity capital
worth 93 GBP million (37.65%). It demonstrates higher level of risk in investment because
the ratio is much far away from the ideal ratio of 0.5:1. Excessive debt-burden to Thomas
7
Paraphrase This Document
Need a fresh take? Get an instant paraphrase of this document with our AI Paraphraser
Cook Group Plc makes company liable to pay instalments along with interest according to
repayment schedule (Rauch and Wende, 2015).
Earnings per share (EPS) converted from negative value of 0.08 to favourable 0.02 because
of positive net yield worth 23 GBP million in the year 2015. It indicates that in this year,
investors gain favourable return on their investment so as to meet their expectations.
Limitation of the analysis
Investors are more concerned about examining future occurrence which is not available
under the historical financial statements. Henceforth, time-outdated information is the main
limitation which does not assist CFO to make better investment decisions.
Annual accounts provide information only about numerical and quantitative data, whereas
potential investors also wish to examine market conditions, external forces and other
qualitative information to make strong decisions (Iyer and et.al., 2014).
There is no ideal or standard ratio in all the cases like profitability and activity ratios, which
is considered as a drawback to interpret Thomas Cook’s financial performance. In such
cases, it is difficult for the CFO to interpret ratio that whether it is good or poor.
It does not reflect changes in accounting policies, rules, conventions and standards applied
for the preparation of annual financial reports and may lead to take harmful decisions
(Brida, Deidda and Pulina, 2014).
Financial statements do not take into account market volatility, external fluctuations,
competition, political pressure and others and limits the purpose of investors’ decisions.
Conclusion
From the report, it can be concluded that in few areas, although Thomas Cook managers took
initiatives and decisions for the enhancement of performance such as liquidity and cash
management strategies by receiving earlier from debtors and pay delayed to suppliers. But still,
there are some lagging areas where executives and directors have to make strong decisions such as
delivering best travelling services and discounting offers to increase revenues, maximizing CA and
decreasing CL to achieve target liquidity ratios and repay debt and issue equity capital to manage
solvency capital. On the other hand, CFO can be suggested to not invest their money in the Thomas
Cook due to high risk involved, lower possibility of return and adverse fluctuations and uncertain
conditions in the market.
8
REFERENCES
Books and Journals
Blankespoor, E., Miller, G. S. and White, H. D., 2013. The role of dissemination in market liquidity:
Evidence from firms' use of Twitter™. The Accounting Review. 89(1). pp. 79-112.
Brida, J. G., Deidda, M. and Pulina, M., 2014. Tourism and transport systems in mountain
environments: analysis of the economic efficiency of cableways in South Tyrol. Journal of
Transport Geography. 36(3). pp. 1-11.
Innocent, E. C., Mary, O. I. and Matthew, O. M., 2013. Financial ratio analysis as a determinant of
profitability in Nigerian pharmaceutical industry.International journal of business and
management. 8(8). pp. 107-113.
Iyer, R. and et.al., 2014. Interbank liquidity crunch and the firm credit crunch: Evidence from the
2007–2009 crisis. Review of Financial studies. 27(1). pp. 347-372.
Jansen, I. P., Ramnath, S. and Yohn, T. L., 2012. A diagnostic for earnings management using
changes in asset turnover and profit margin.Contemporary Accounting Research. 29(1). pp.
221-251.
Khidmat, W. and Rehman, M., 2014. Impact of liquidity and solvency on profitability chemical
sector of Pakistan. Economics Management Innovation. 6(3). pp. 34-67.
Rauch, J. and Wende, S., 2015. Solvency prediction for property-liability insurance companies:
Evidence from the financial crisis. The Geneva Papers on Risk and Insurance Issues and
Practice. 40(1). pp. 47-65.
Smith, S. L., 2014. Tourism analysis: A handbook. Routledge.
Vyas, H. D. and Shah, V., 2013. An empirical study on receivables management in cement sector in
India. Asian Journal of Research in Business Economics and Management. 3(4). pp. 150-
187.
Online
Trends and factors affecting travel and tourism in UK. 2016. [Online]. Available through:
http://stravelandtourism.weebly.com/trends-and-factors.html. [Accessed on 15th November
2016].
What Brexit might mean for UK travel. 2016. [Online]. Available through:
https://www2.deloitte.com/uk/en/pages/consumer-business/articles/what-brexit-might-mean-
for-uk-travel.html. [Accessed on 15th November 2016].
What leaving the EU could cost travellers?. 2016. [Online]. Available through:
http://www.telegraph.co.uk/travel/comment/what-would-brexit-mean-for-travellers.
[Accessed on 15th November 2016].
9
⊘ This is a preview!⊘
Do you want full access?
Subscribe today to unlock all pages.
Trusted by 1+ million students worldwide
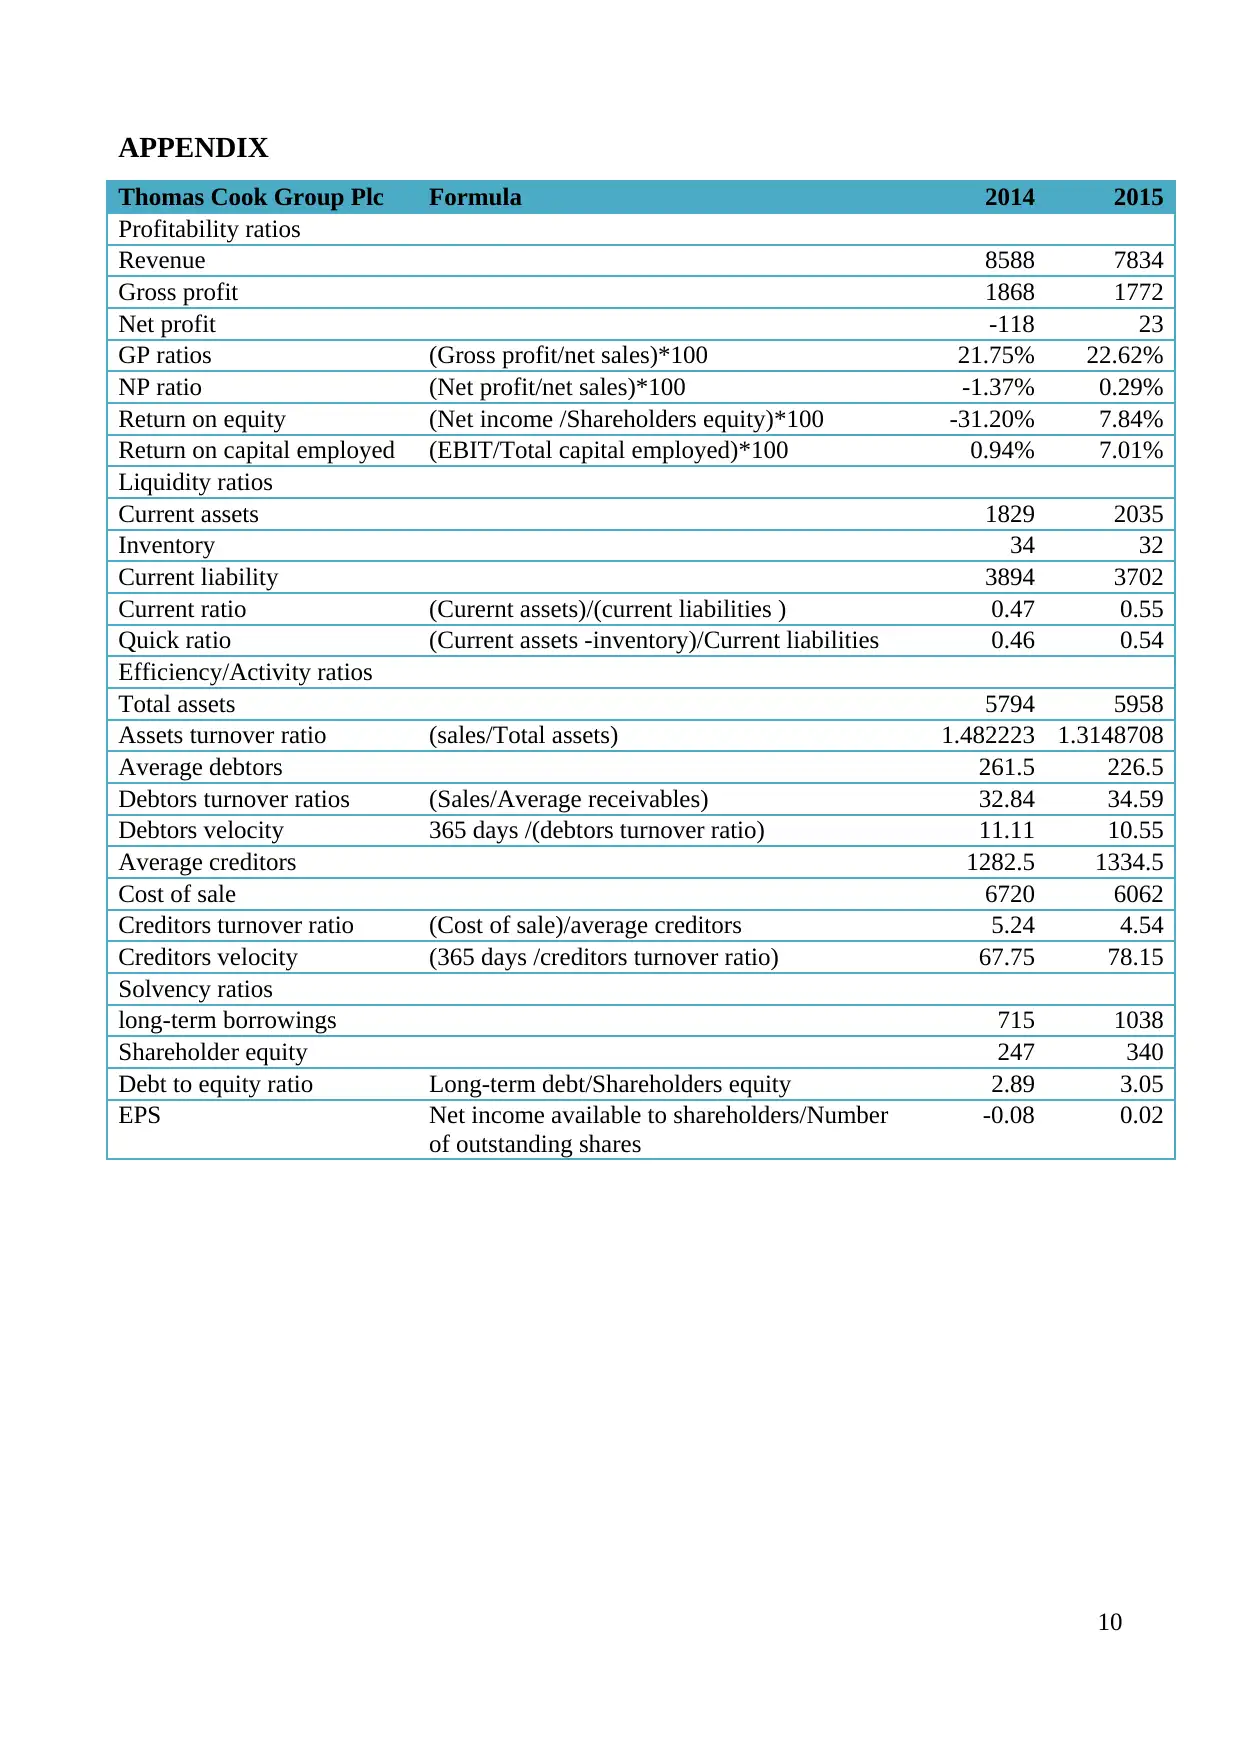
APPENDIX
Thomas Cook Group Plc Formula 2014 2015
Profitability ratios
Revenue 8588 7834
Gross profit 1868 1772
Net profit -118 23
GP ratios (Gross profit/net sales)*100 21.75% 22.62%
NP ratio (Net profit/net sales)*100 -1.37% 0.29%
Return on equity (Net income /Shareholders equity)*100 -31.20% 7.84%
Return on capital employed (EBIT/Total capital employed)*100 0.94% 7.01%
Liquidity ratios
Current assets 1829 2035
Inventory 34 32
Current liability 3894 3702
Current ratio (Curernt assets)/(current liabilities ) 0.47 0.55
Quick ratio (Current assets -inventory)/Current liabilities 0.46 0.54
Efficiency/Activity ratios
Total assets 5794 5958
Assets turnover ratio (sales/Total assets) 1.482223 1.3148708
Average debtors 261.5 226.5
Debtors turnover ratios (Sales/Average receivables) 32.84 34.59
Debtors velocity 365 days /(debtors turnover ratio) 11.11 10.55
Average creditors 1282.5 1334.5
Cost of sale 6720 6062
Creditors turnover ratio (Cost of sale)/average creditors 5.24 4.54
Creditors velocity (365 days /creditors turnover ratio) 67.75 78.15
Solvency ratios
long-term borrowings 715 1038
Shareholder equity 247 340
Debt to equity ratio Long-term debt/Shareholders equity 2.89 3.05
EPS Net income available to shareholders/Number
of outstanding shares
-0.08 0.02
10
Paraphrase This Document
Need a fresh take? Get an instant paraphrase of this document with our AI Paraphraser

11

12
⊘ This is a preview!⊘
Do you want full access?
Subscribe today to unlock all pages.
Trusted by 1+ million students worldwide
1 out of 12
Related Documents


Your All-in-One AI-Powered Toolkit for Academic Success.
+13062052269
info@desklib.com
Available 24*7 on WhatsApp / Email
![[object Object]](/_next/static/media/star-bottom.7253800d.svg)
Unlock your academic potential
Copyright © 2020–2026 A2Z Services. All Rights Reserved. Developed and managed by ZUCOL.