Business Analytics: Regression Analysis of Ticket Sales & Insurance

Verified

Added on  2023/06/15

|6
|864
|491
Homework Assignment
AI Summary
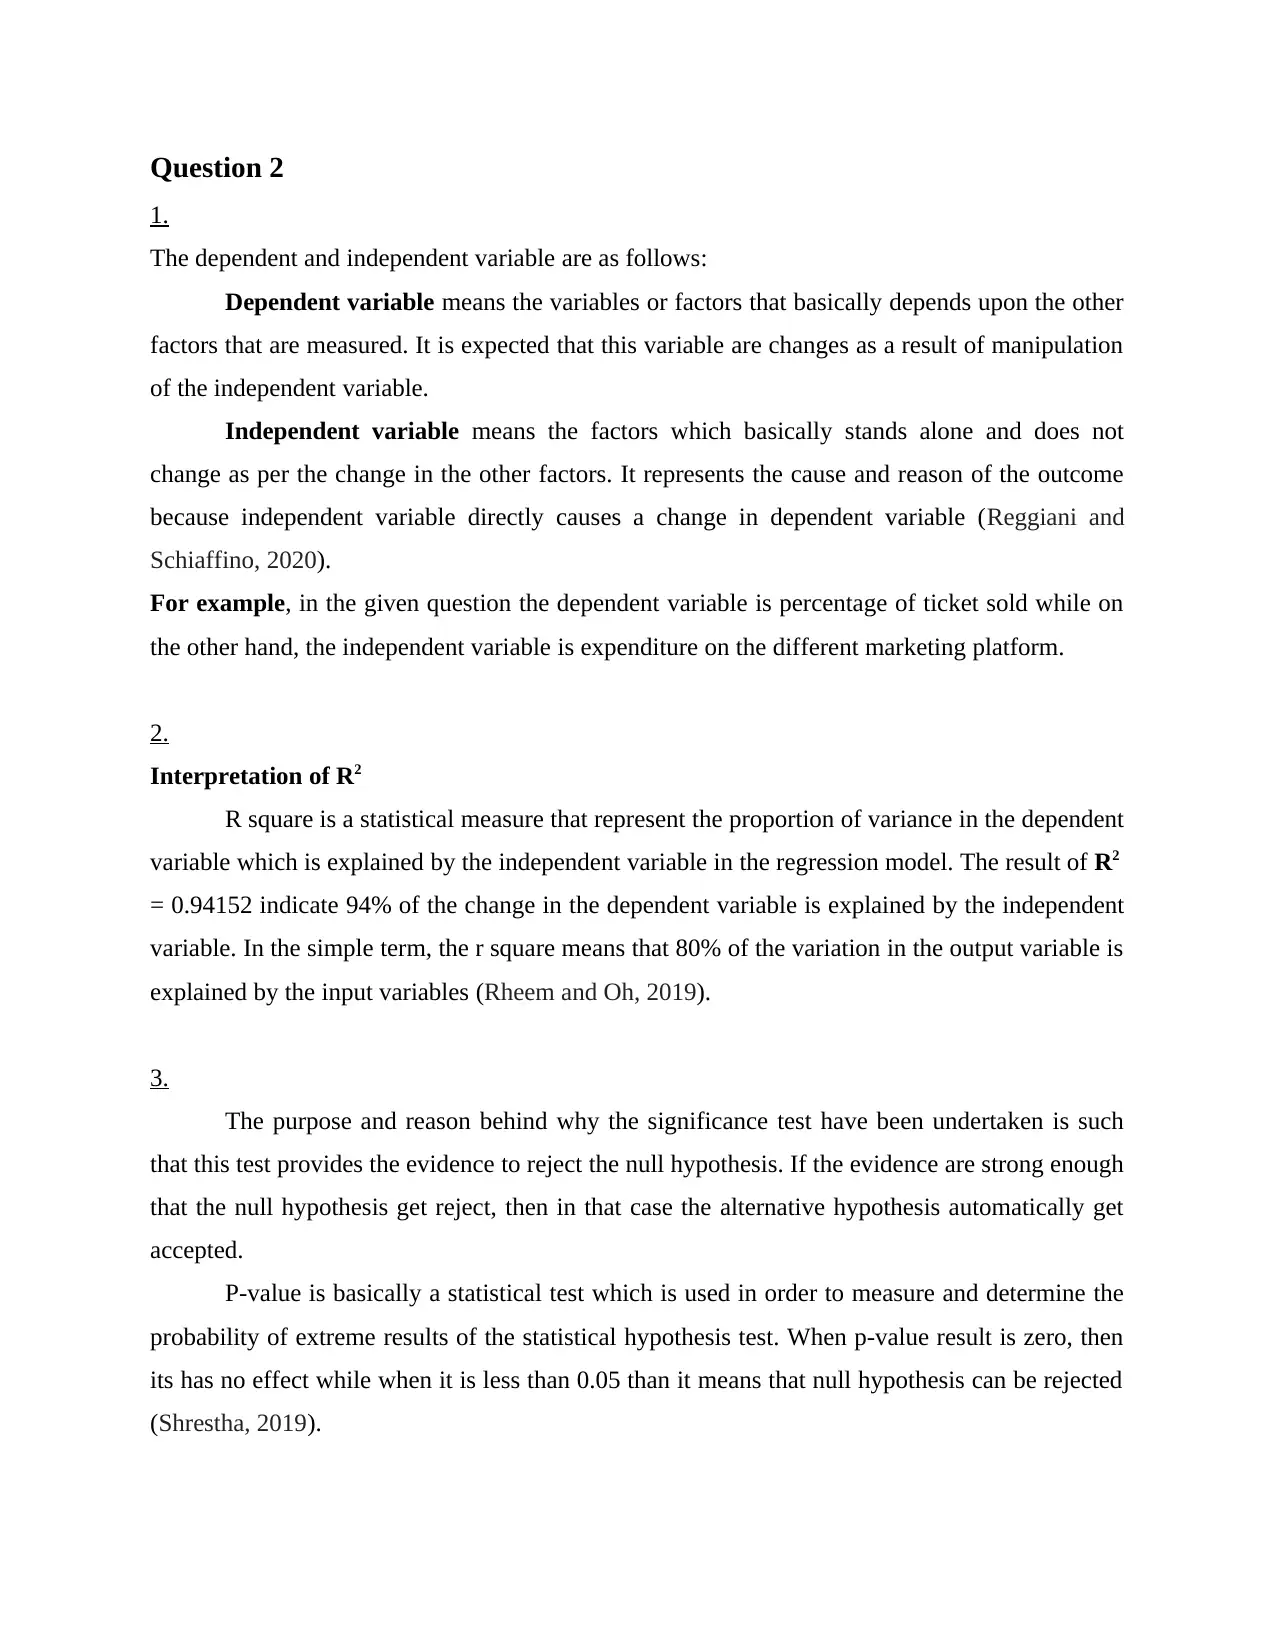
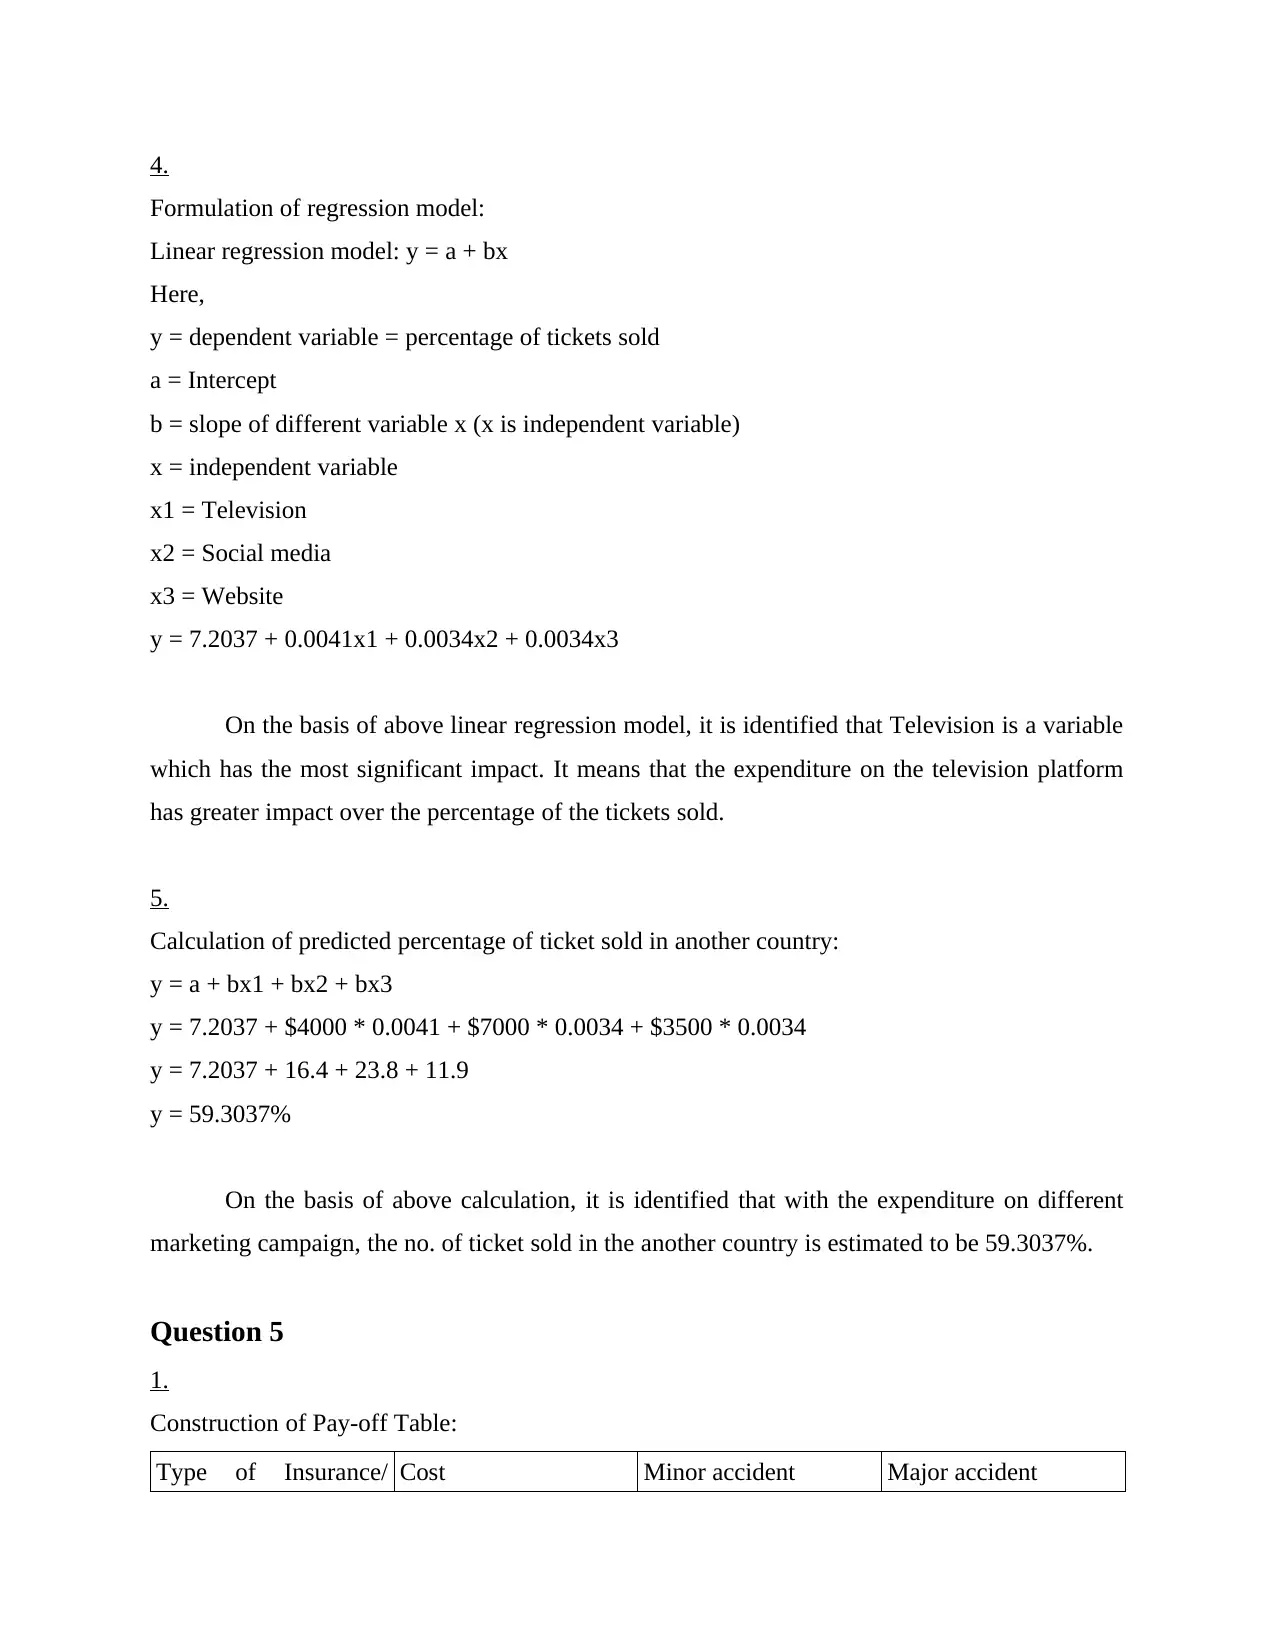
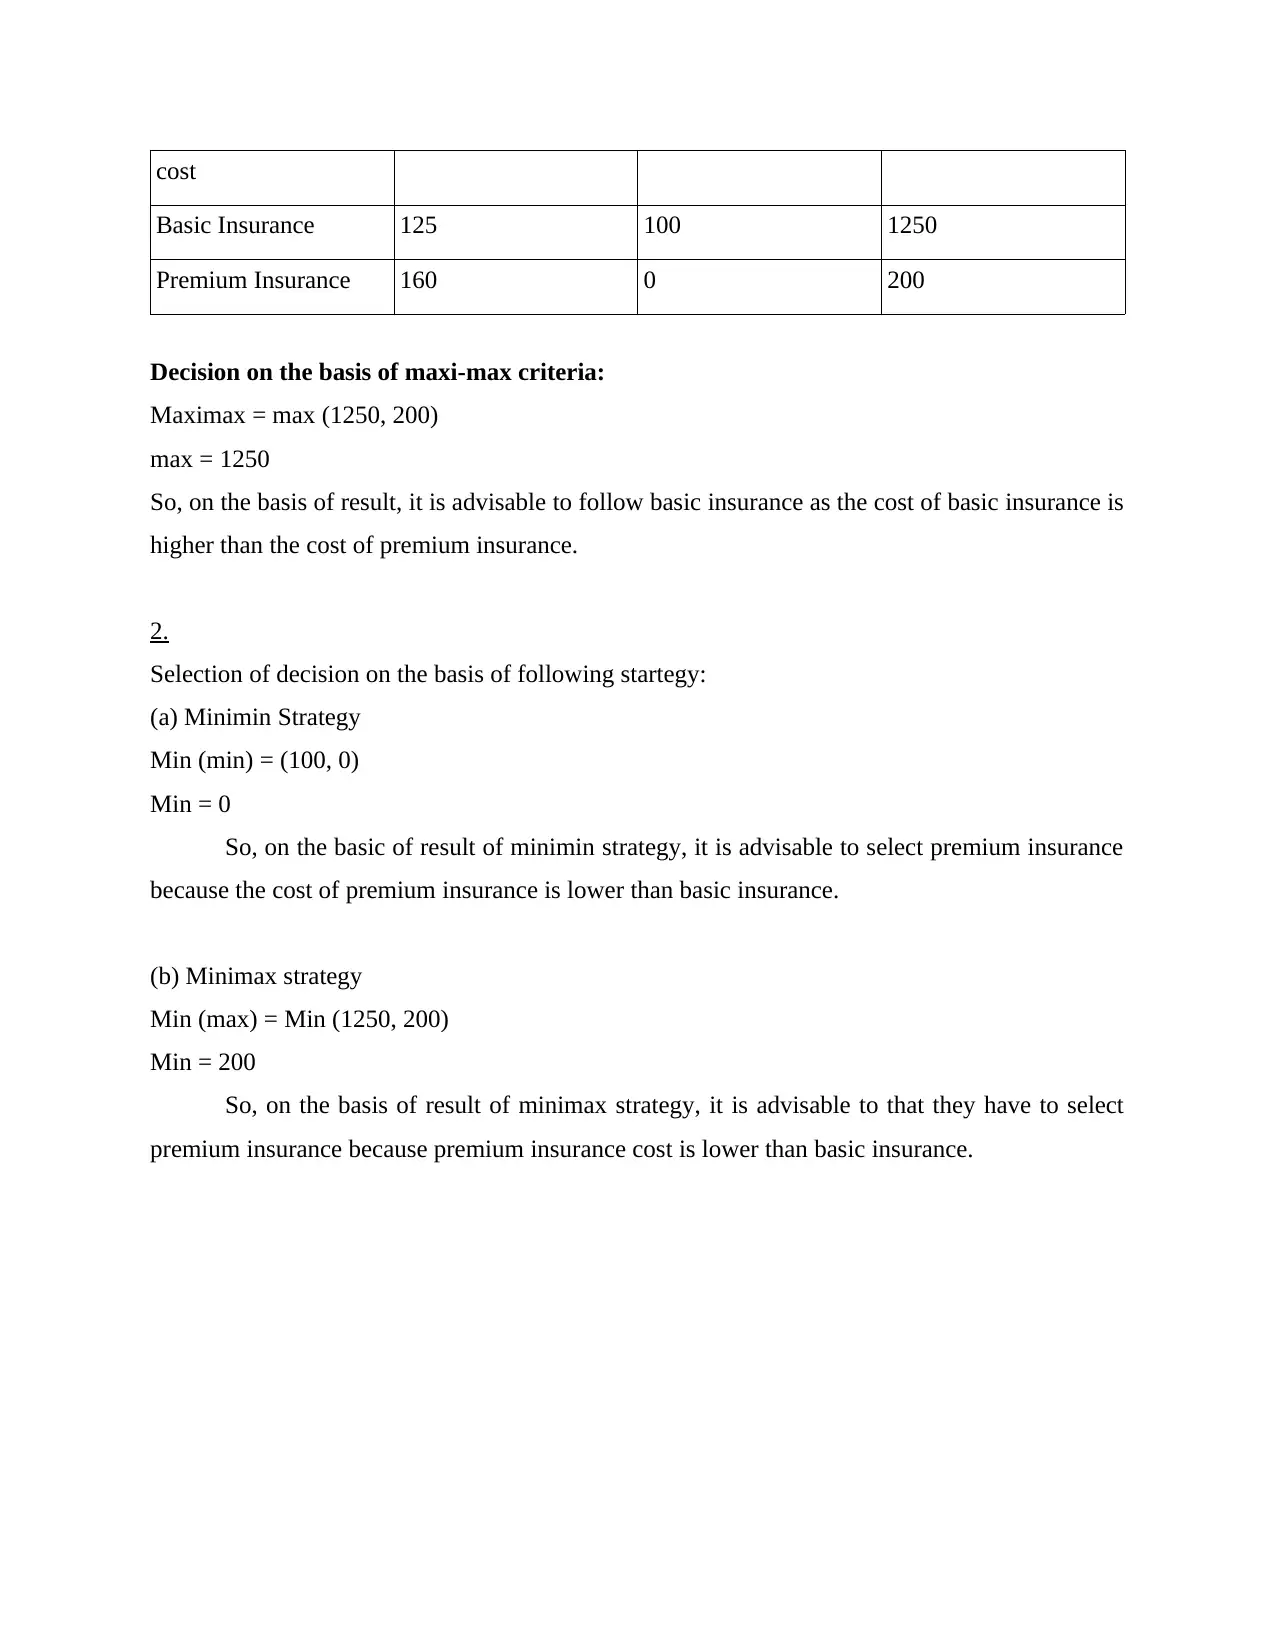
This document provides a solution to a business analytics exam, focusing on two key areas: regression analysis of ticket sales and decision-making related to insurance. The regression analysis section identifies dependent and independent variables affecting ticket sales, interprets the R-squared value, explains the significance test, formulates a linear regression model, and calculates predicted ticket sales based on marketing expenditures across different platforms (television, social media, website). The insurance decision section constructs a payoff table to compare basic and premium insurance options under minor and major accident scenarios. It then applies maxi-max, minimin, and minimax strategies to recommend the optimal insurance choice based on different risk preferences. Desklib offers this solution alongside other study resources to support students' learning.
tabler-icon-diamond-filled.svg

Contribute Materials

Your contribution can guide someone’s learning journey. Share your documents today.
Document Page
Exam BUSINESS
ANALYTICS
tabler-icon-diamond-filled.svg

Secure Best Marks with AI Grader

Need help grading? Try our AI Grader for instant feedback on your assignments.
Document Page
Table of Contents
Question 2........................................................................................................................................3
1....................................................................................................................................................3
2....................................................................................................................................................3
3....................................................................................................................................................3
4....................................................................................................................................................4
5....................................................................................................................................................4
Question 5........................................................................................................................................4
1....................................................................................................................................................4
2....................................................................................................................................................5
REFERENCES................................................................................................................................1
Document Page
Question 2
1.
The dependent and independent variable are as follows:
Dependent variable means the variables or factors that basically depends upon the other
factors that are measured. It is expected that this variable are changes as a result of manipulation
of the independent variable.
Independent variable means the factors which basically stands alone and does not
change as per the change in the other factors. It represents the cause and reason of the outcome
because independent variable directly causes a change in dependent variable (Reggiani and
Schiaffino, 2020).
For example, in the given question the dependent variable is percentage of ticket sold while on
the other hand, the independent variable is expenditure on the different marketing platform.
2.
Interpretation of R2
R square is a statistical measure that represent the proportion of variance in the dependent
variable which is explained by the independent variable in the regression model. The result of R2
= 0.94152 indicate 94% of the change in the dependent variable is explained by the independent
variable. In the simple term, the r square means that 80% of the variation in the output variable is
explained by the input variables (Rheem and Oh, 2019).
3.
The purpose and reason behind why the significance test have been undertaken is such
that this test provides the evidence to reject the null hypothesis. If the evidence are strong enough
that the null hypothesis get reject, then in that case the alternative hypothesis automatically get
accepted.
P-value is basically a statistical test which is used in order to measure and determine the
probability of extreme results of the statistical hypothesis test. When p-value result is zero, then
its has no effect while when it is less than 0.05 than it means that null hypothesis can be rejected
(Shrestha, 2019).
Document Page
4.
Formulation of regression model:
Linear regression model: y = a + bx
Here,
y = dependent variable = percentage of tickets sold
a = Intercept
b = slope of different variable x (x is independent variable)
x = independent variable
x1 = Television
x2 = Social media
x3 = Website
y = 7.2037 + 0.0041x1 + 0.0034x2 + 0.0034x3
On the basis of above linear regression model, it is identified that Television is a variable
which has the most significant impact. It means that the expenditure on the television platform
has greater impact over the percentage of the tickets sold.
5.
Calculation of predicted percentage of ticket sold in another country:
y = a + bx1 + bx2 + bx3
y = 7.2037 + $4000 * 0.0041 + $7000 * 0.0034 + $3500 * 0.0034
y = 7.2037 + 16.4 + 23.8 + 11.9
y = 59.3037%
On the basis of above calculation, it is identified that with the expenditure on different
marketing campaign, the no. of ticket sold in the another country is estimated to be 59.3037%.
Question 5
1.
Construction of Pay-off Table:
Type of Insurance/ Cost Minor accident Major accident
tabler-icon-diamond-filled.svg

Secure Best Marks with AI Grader

Need help grading? Try our AI Grader for instant feedback on your assignments.
Document Page
cost
Basic Insurance 125 100 1250
Premium Insurance 160 0 200
Decision on the basis of maxi-max criteria:
Maximax = max (1250, 200)
max = 1250
So, on the basis of result, it is advisable to follow basic insurance as the cost of basic insurance is
higher than the cost of premium insurance.
2.
Selection of decision on the basis of following startegy:
(a) Minimin Strategy
Min (min) = (100, 0)
Min = 0
So, on the basic of result of minimin strategy, it is advisable to select premium insurance
because the cost of premium insurance is lower than basic insurance.
(b) Minimax strategy
Min (max) = Min (1250, 200)
Min = 200
So, on the basis of result of minimax strategy, it is advisable to that they have to select
premium insurance because premium insurance cost is lower than basic insurance.
Document Page
REFERENCES
Books and journals
Reggiani, C. and Schiaffino, S., 2020. Muscle hypertrophy and muscle strength: dependent or
independent variables? A provocative review. European Journal of Translational
Myology. 30(3).
Rheem, S. and Oh, S., 2019. Improving the quality of response surface analysis of an
experiment for coffee-supplemented milk beverage: I. Data screening at the center point
and maximum possible R-Square. Food science of animal resources. 39(1). p.114.
Shrestha, J., 2019. P-Value: A true test of significance in agricultural research.
1
chevron_up_icon
1 out of 6
circle_padding
hide_on_mobile
zoom_out_icon
logo.png

Your All-in-One AI-Powered Toolkit for Academic Success.

Available 24*7 on WhatsApp / Email

[object Object]