ACC00716 Finance Report on Time Value of Money and Risk Analysis
VerifiedAdded on 2022/09/01
|11
|2068
|29
Report
AI Summary
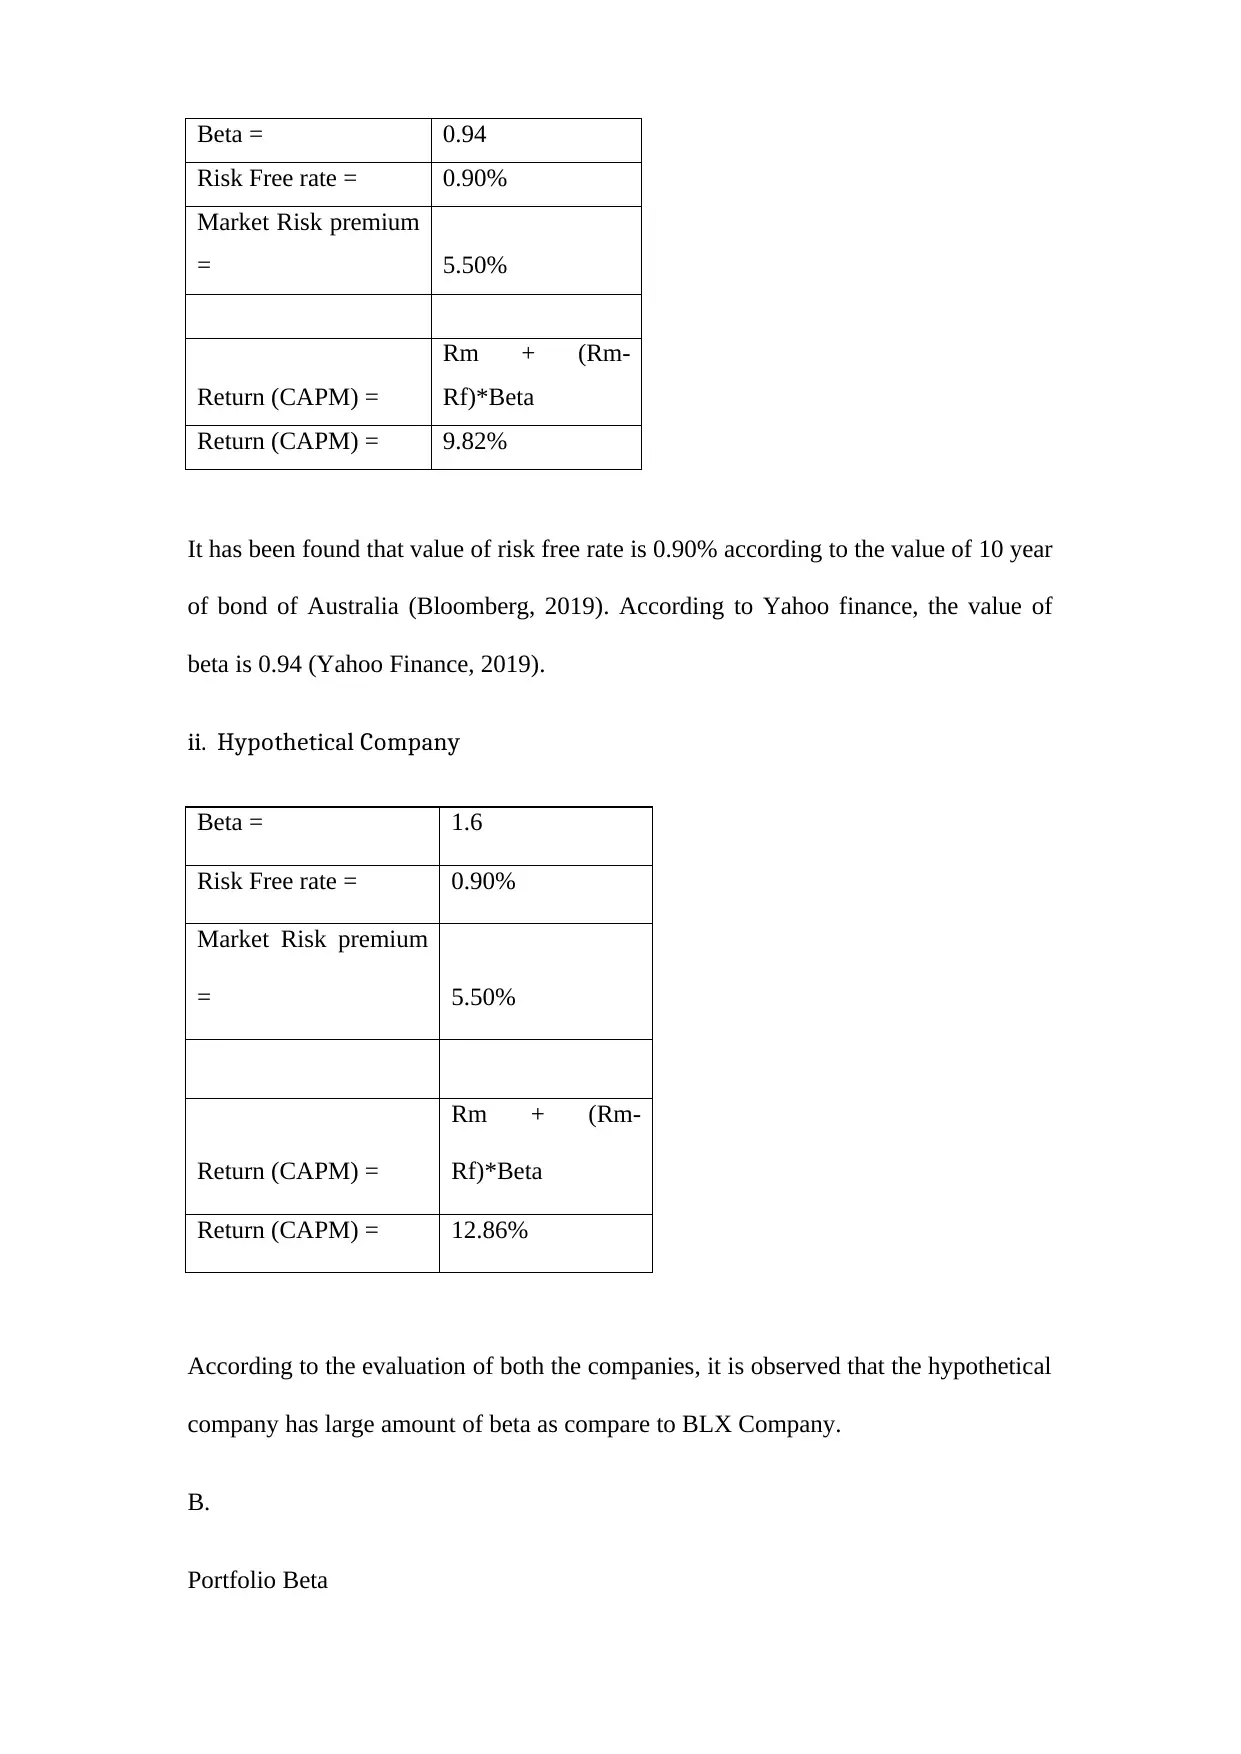
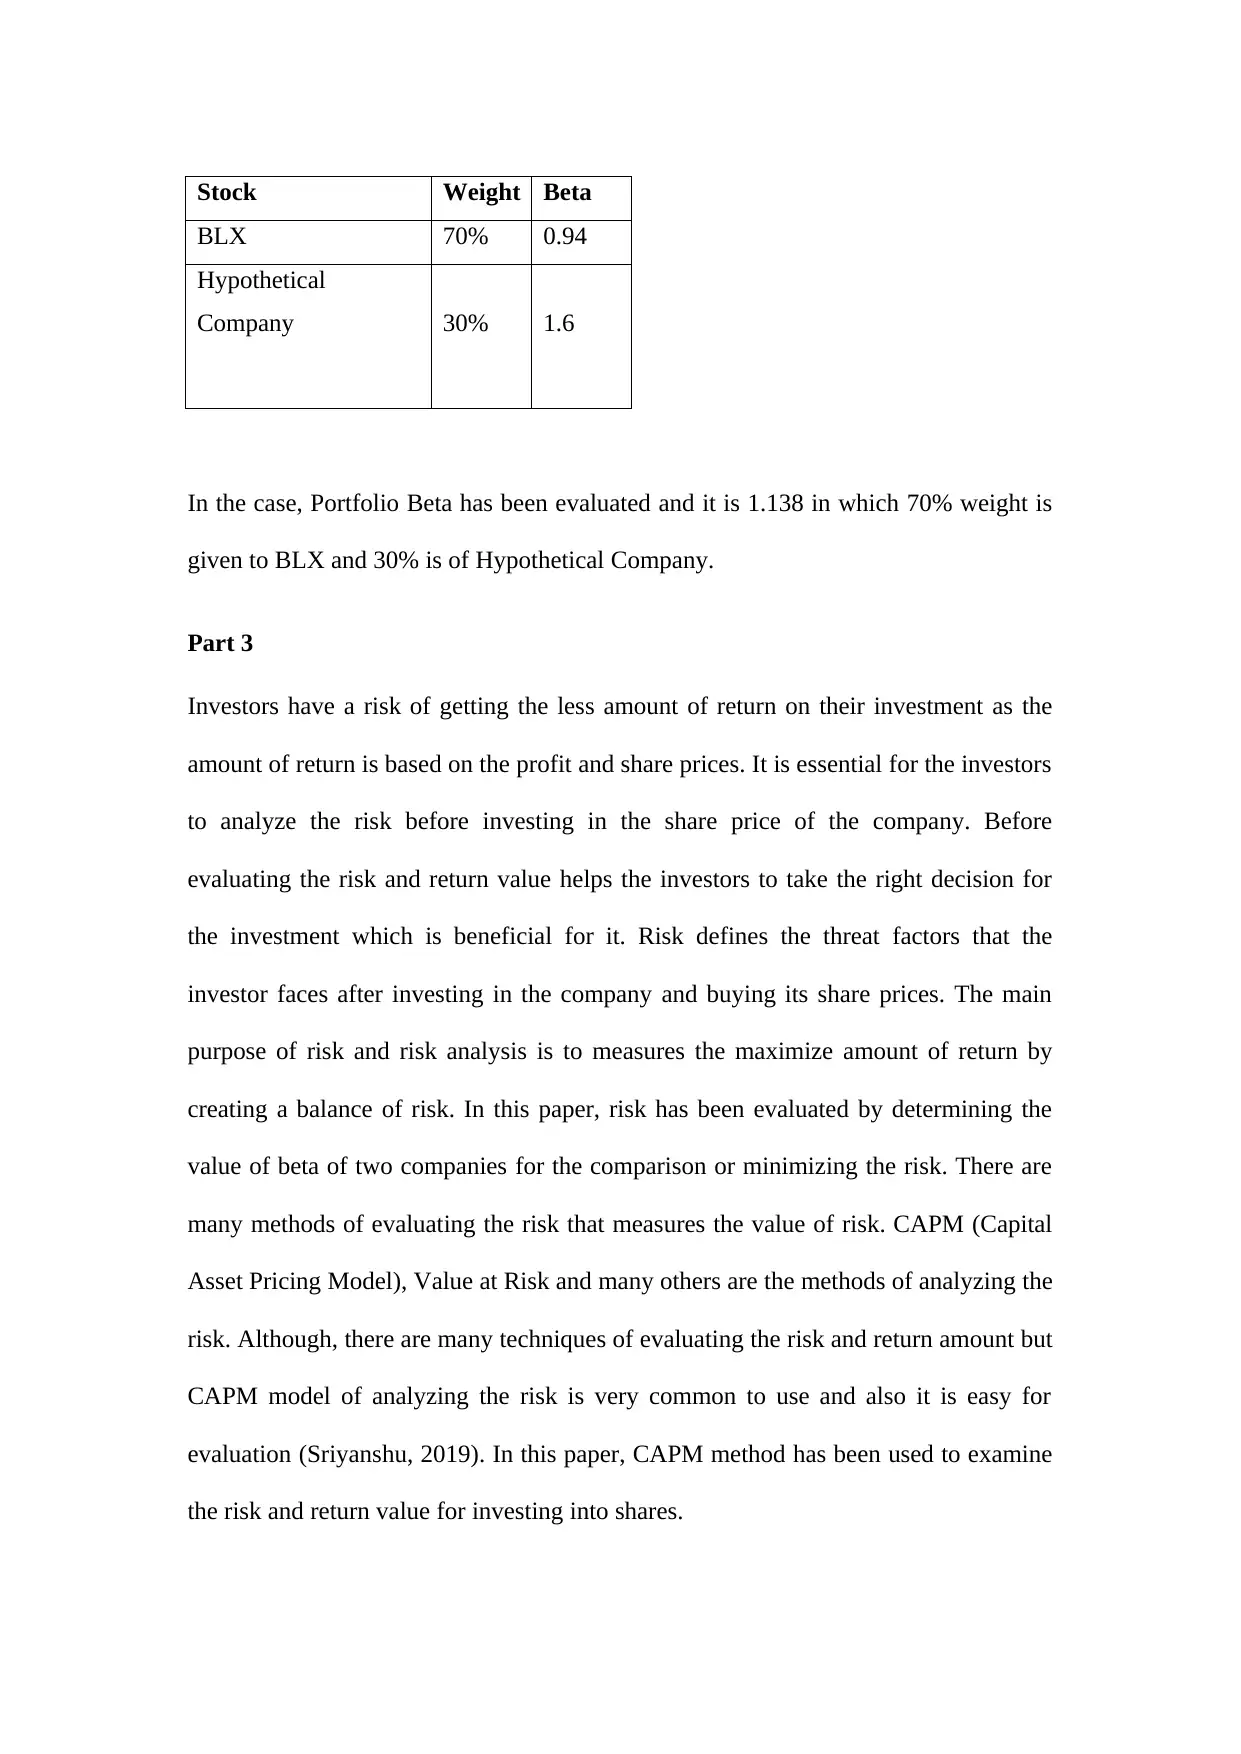
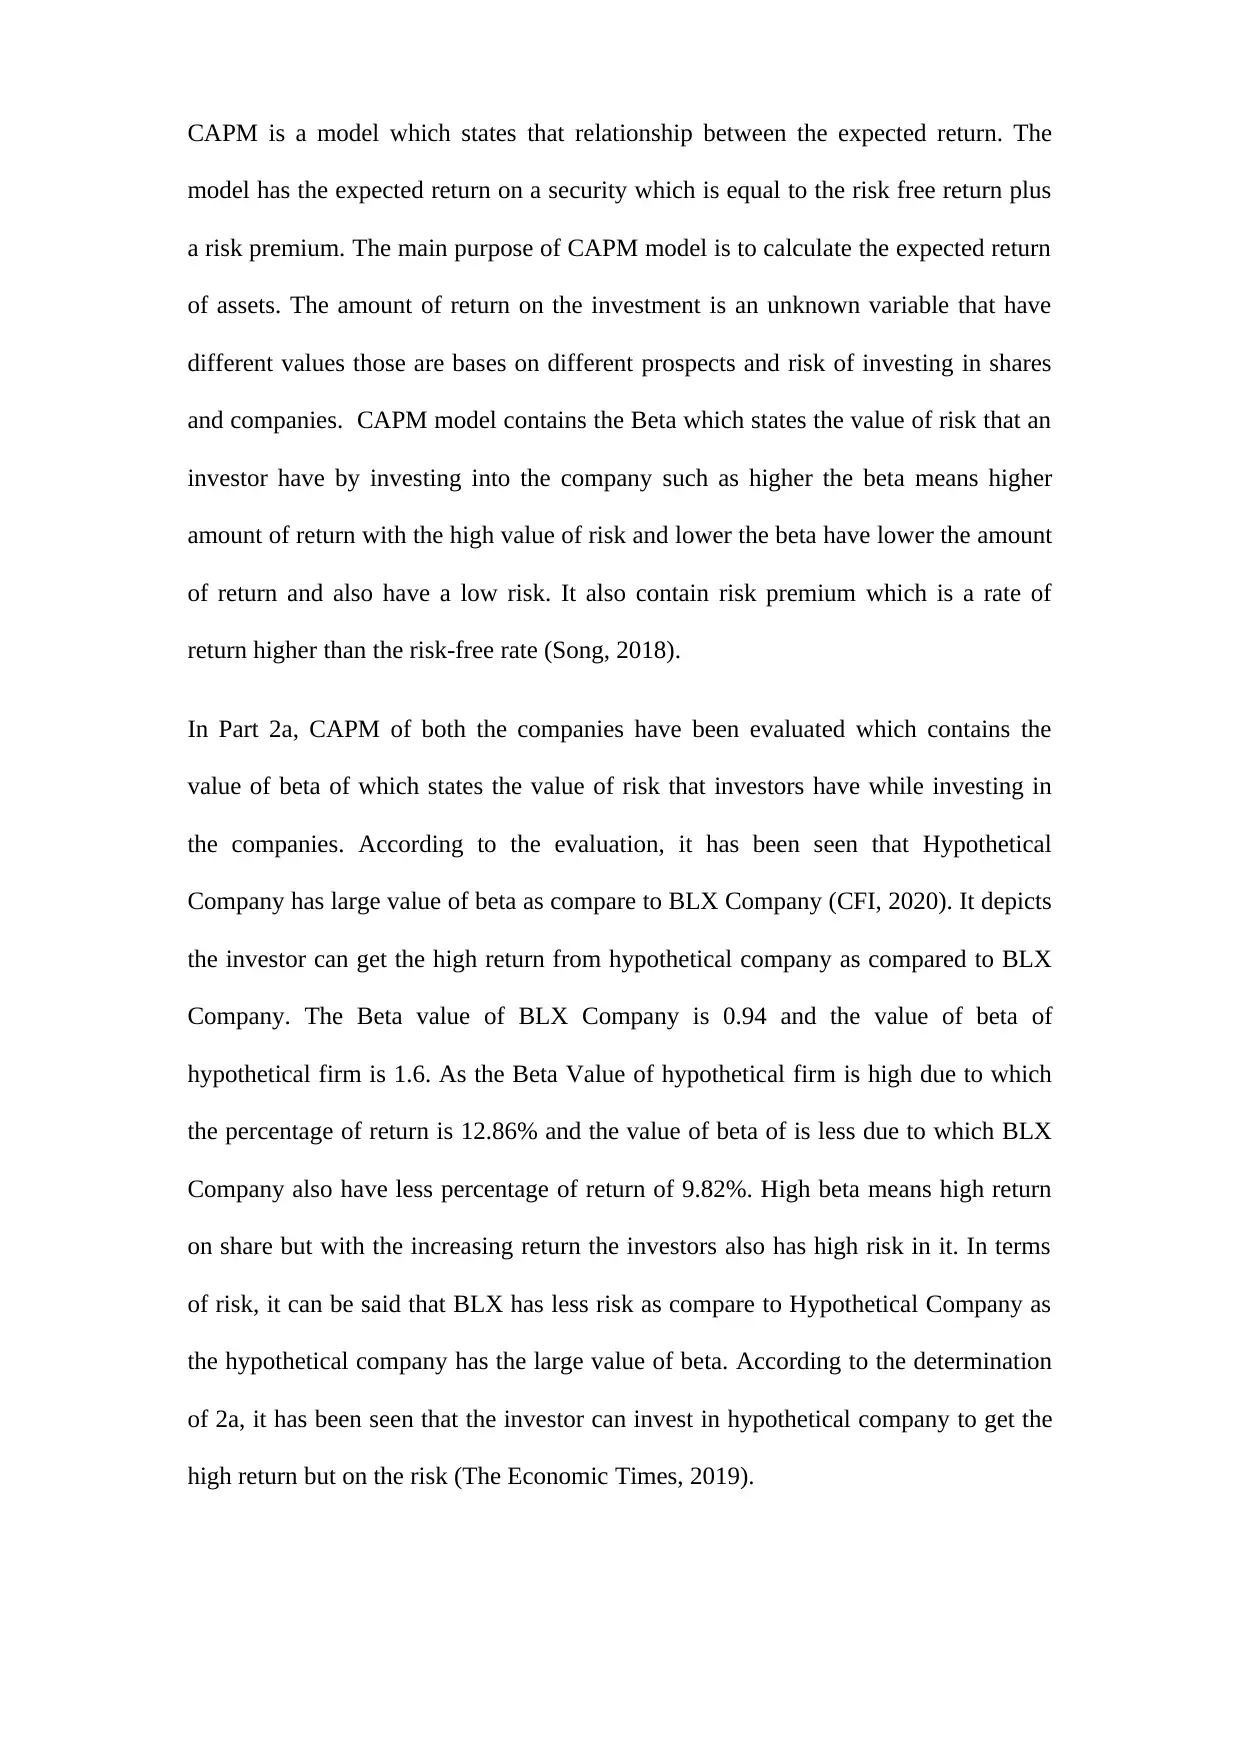
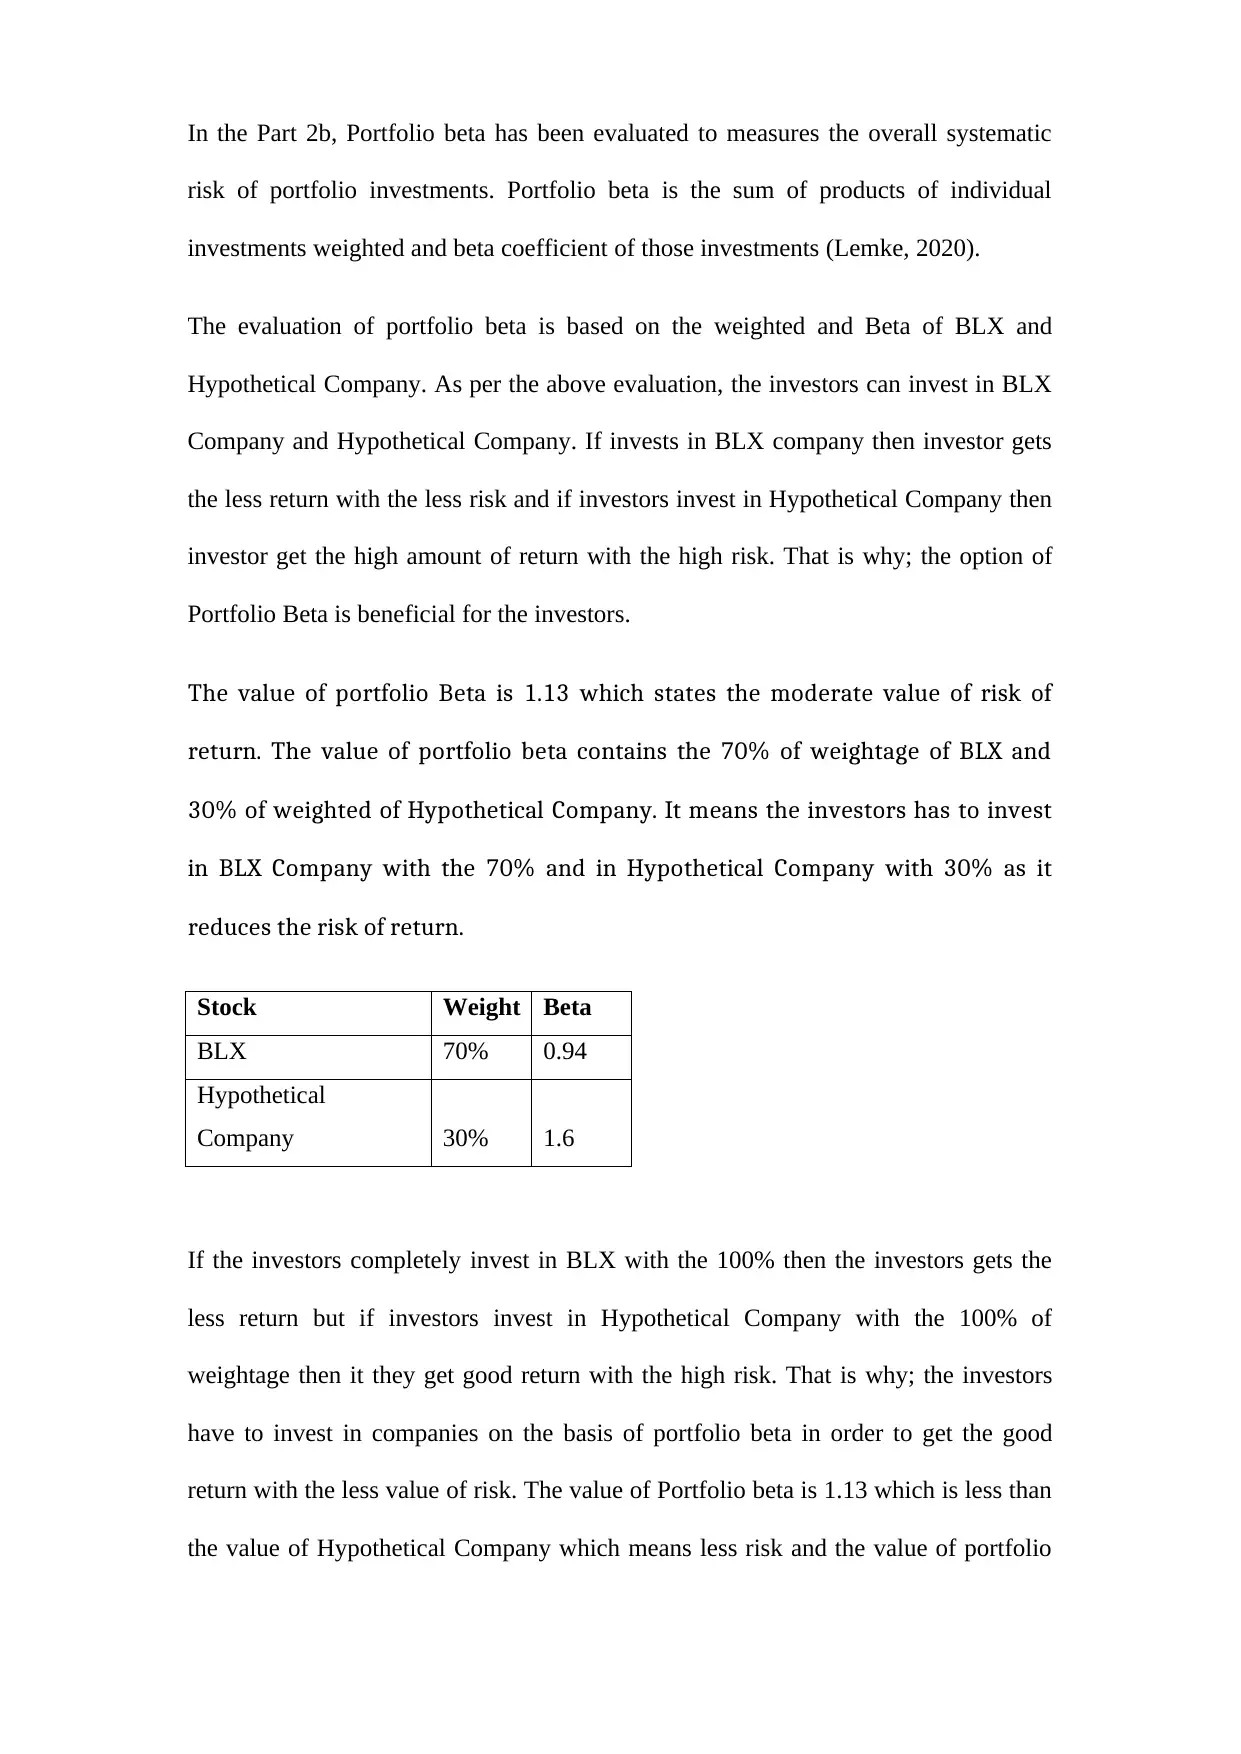
This finance report, submitted by a student for the ACC00716 Finance unit at Southern Cross University, comprehensively analyzes the time value of money and risk and return analysis. It is divided into three parts, with the first part focusing on time value of money and bond valuation, addressing various financial calculations. The second part involves a risk and return analysis, comparing the risk profiles of a real company (Beacon Lighting - BLX) and a hypothetical company using the Capital Asset Pricing Model (CAPM) and portfolio beta. The third part provides a theoretical discussion on risk assessment methods, emphasizing the importance of risk analysis for investors and the application of the CAPM model. The report utilizes real-world financial data and calculations to illustrate key concepts in finance, including the evaluation of beta, return, and portfolio risk, and provides insights into investment decision-making.

SOUTHERN CROSS UNIVERSITY
ASSIGNMENT COVER SHEET
For use with online submission of assignments
Please complete all of the following details and then make this sheet the first
page of each file of your assignment – do not send it as a separate
document.
Your assignments must be submitted as either Word documents, text documents
with .rtf extension or as .pdf documents. If you wish to submit in any other file
format please discuss this with your lecturer well before the assignment submission
date.
Student Name:
Student ID No.:
Unit Name:
Unit Code:
Tutor’s name:
Assignment No.: 2
Assignment Title: Report
Due date:
Date submitted:
Declaration:
I have read and understand the Rules Relating to Awards (Rule 3
Section 18 – Academic Misconduct Including Plagiarism) as
contained in the SCU Policy Library. I understand the penalties
that apply for plagiarism and agree to be bound by these rules. The
work I am submitting electronically is entirely my own work.
Signed:
(please type
your name)
Date:
Paraphrase This Document
Need a fresh take? Get an instant paraphrase of this document with our AI Paraphraser

In this paper, the main focus is given on the topic of “Times Value of Money and risk
and return analysis”. The report will be classified into three parts such as Part 1, Part 2
and Part 3. Beacon Lighting (BLX) has been taken into consideration in order to
evaluate the questions.
Part 1
A.
APR = 6%
Years= 5
Periods = 60
Periodic Rate = 0.50%
PMT = $ 891.00
According to the evaluation, the amount that the company borrowed in 5 years with
the 6% of interest is $46,087.47.
B.
Annual Revenue
(million) =
$
247.70
Annual Rate of growth = 9.90%
The annual revenue that the company is $247.70 and it is growing by 9.90% which
means the annual revenue of the company in 5 years is $1,509.23.
C.
Loan A Loan B Loan C
Rate 5.45% 5.50% 5.40%
Compounding Monthly Semi Daily

Annually
EAR = 5.59% 5.63% 5.60%
By evaluating EAR of three loans, it is observed that EAR is 5.59%, 5.63% and
5.60% of Loan A, B, and C respectively. The least effective interest rate is of option
A, and hence Loan A must be chosen.
D.
Computation of amount of payments of loan
Loan amount =
$
1,650,000.00
Year of loan = 20
Number of periods = 40
Interest rate (annual) = 4.20%
Applicable rate = 2.10%
It has been evaluated that the company has to pay the loan amount semiannually with
the $61,379.81.
E.
Yield to maturity of Bonds
C = 5.85%
F = $1,000.00
P = $922.00
N = 6
YTM = 7.44%
⊘ This is a preview!⊘
Do you want full access?
Subscribe today to unlock all pages.

Trusted by 1+ million students worldwide

It is determined that Yield Maturity Bond is 7.44% with the annual coupon bonds
with the 6 years.
F.
Computation of the market price of the
bonds
Face Value =
$
100.00
Period
Cash
Flow PVF PV
1 5 0.972 4.86
2 5 0.944 4.72
3 5 0.918 4.59
4 5 0.892 4.46
5 5 0.867 4.33
6 5 0.842 4.21
7 5 0.819 4.09
8 105 0.796 83.53
Market
Price = 114.80
It has been evaluated that the market price of the bonds is 114.80.
Part 2
A. In this question, the risk has been evaluated of the company and the hypothetical
company. The evaluation the risk is given below.
i. Company
Paraphrase This Document
Need a fresh take? Get an instant paraphrase of this document with our AI Paraphraser

Beta = 0.94
Risk Free rate = 0.90%
Market Risk premium
= 5.50%
Return (CAPM) =
Rm + (Rm-
Rf)*Beta
Return (CAPM) = 9.82%
It has been found that value of risk free rate is 0.90% according to the value of 10 year
of bond of Australia (Bloomberg, 2019). According to Yahoo finance, the value of
beta is 0.94 (Yahoo Finance, 2019).
ii. Hypothetical Company
Beta = 1.6
Risk Free rate = 0.90%
Market Risk premium
= 5.50%
Return (CAPM) =
Rm + (Rm-
Rf)*Beta
Return (CAPM) = 12.86%
According to the evaluation of both the companies, it is observed that the hypothetical
company has large amount of beta as compare to BLX Company.
B.
Portfolio Beta
Risk Free rate = 0.90%
Market Risk premium
= 5.50%
Return (CAPM) =
Rm + (Rm-
Rf)*Beta
Return (CAPM) = 9.82%
It has been found that value of risk free rate is 0.90% according to the value of 10 year
of bond of Australia (Bloomberg, 2019). According to Yahoo finance, the value of
beta is 0.94 (Yahoo Finance, 2019).
ii. Hypothetical Company
Beta = 1.6
Risk Free rate = 0.90%
Market Risk premium
= 5.50%
Return (CAPM) =
Rm + (Rm-
Rf)*Beta
Return (CAPM) = 12.86%
According to the evaluation of both the companies, it is observed that the hypothetical
company has large amount of beta as compare to BLX Company.
B.
Portfolio Beta

Stock Weight Beta
BLX 70% 0.94
Hypothetical
Company 30% 1.6
In the case, Portfolio Beta has been evaluated and it is 1.138 in which 70% weight is
given to BLX and 30% is of Hypothetical Company.
Part 3
Investors have a risk of getting the less amount of return on their investment as the
amount of return is based on the profit and share prices. It is essential for the investors
to analyze the risk before investing in the share price of the company. Before
evaluating the risk and return value helps the investors to take the right decision for
the investment which is beneficial for it. Risk defines the threat factors that the
investor faces after investing in the company and buying its share prices. The main
purpose of risk and risk analysis is to measures the maximize amount of return by
creating a balance of risk. In this paper, risk has been evaluated by determining the
value of beta of two companies for the comparison or minimizing the risk. There are
many methods of evaluating the risk that measures the value of risk. CAPM (Capital
Asset Pricing Model), Value at Risk and many others are the methods of analyzing the
risk. Although, there are many techniques of evaluating the risk and return amount but
CAPM model of analyzing the risk is very common to use and also it is easy for
evaluation (Sriyanshu, 2019). In this paper, CAPM method has been used to examine
the risk and return value for investing into shares.
⊘ This is a preview!⊘
Do you want full access?
Subscribe today to unlock all pages.

Trusted by 1+ million students worldwide

CAPM is a model which states that relationship between the expected return. The
model has the expected return on a security which is equal to the risk free return plus
a risk premium. The main purpose of CAPM model is to calculate the expected return
of assets. The amount of return on the investment is an unknown variable that have
different values those are bases on different prospects and risk of investing in shares
and companies. CAPM model contains the Beta which states the value of risk that an
investor have by investing into the company such as higher the beta means higher
amount of return with the high value of risk and lower the beta have lower the amount
of return and also have a low risk. It also contain risk premium which is a rate of
return higher than the risk-free rate (Song, 2018).
In Part 2a, CAPM of both the companies have been evaluated which contains the
value of beta of which states the value of risk that investors have while investing in
the companies. According to the evaluation, it has been seen that Hypothetical
Company has large value of beta as compare to BLX Company (CFI, 2020). It depicts
the investor can get the high return from hypothetical company as compared to BLX
Company. The Beta value of BLX Company is 0.94 and the value of beta of
hypothetical firm is 1.6. As the Beta Value of hypothetical firm is high due to which
the percentage of return is 12.86% and the value of beta of is less due to which BLX
Company also have less percentage of return of 9.82%. High beta means high return
on share but with the increasing return the investors also has high risk in it. In terms
of risk, it can be said that BLX has less risk as compare to Hypothetical Company as
the hypothetical company has the large value of beta. According to the determination
of 2a, it has been seen that the investor can invest in hypothetical company to get the
high return but on the risk (The Economic Times, 2019).
Paraphrase This Document
Need a fresh take? Get an instant paraphrase of this document with our AI Paraphraser

In the Part 2b, Portfolio beta has been evaluated to measures the overall systematic
risk of portfolio investments. Portfolio beta is the sum of products of individual
investments weighted and beta coefficient of those investments (Lemke, 2020).
The evaluation of portfolio beta is based on the weighted and Beta of BLX and
Hypothetical Company. As per the above evaluation, the investors can invest in BLX
Company and Hypothetical Company. If invests in BLX company then investor gets
the less return with the less risk and if investors invest in Hypothetical Company then
investor get the high amount of return with the high risk. That is why; the option of
Portfolio Beta is beneficial for the investors.
The value of portfolio Beta is 1.13 which states the moderate value of risk of
return. The value of portfolio beta contains the 70% of weightage of BLX and
30% of weighted of Hypothetical Company. It means the investors has to invest
in BLX Company with the 70% and in Hypothetical Company with 30% as it
reduces the risk of return.
Stock Weight Beta
BLX 70% 0.94
Hypothetical
Company 30% 1.6
If the investors completely invest in BLX with the 100% then the investors gets the
less return but if investors invest in Hypothetical Company with the 100% of
weightage then it they get good return with the high risk. That is why; the investors
have to invest in companies on the basis of portfolio beta in order to get the good
return with the less value of risk. The value of Portfolio beta is 1.13 which is less than
the value of Hypothetical Company which means less risk and the value of portfolio

beta is high as compare to BLX company which means the investors gets the good
amount of return.
amount of return.
⊘ This is a preview!⊘
Do you want full access?
Subscribe today to unlock all pages.

Trusted by 1+ million students worldwide

References
Bloomberg. (2019) Government Bond Yields. Available From:
https://www.bloomberg.com/markets/rates-bonds/government-bonds/australia
[Accessed 10/4/2020].
CFI. (2020) Capital Asset Pricing Model (CAPM). Available From:
https://corporatefinanceinstitute.com/resources/knowledge/finance/what-is-capm-
formula/ [Accessed 10/4/2020].
Lemke, T. (2020) How Do You Calculate Portfolio Beta?. Available From:
https://www.thebalance.com/how-to-calculate-your-portfolio-beta-4590382 [Accessed
10/4/2020].
Song, C. (2018) Analysis of Stock IPO Price Based on CAPM Model. Insight-
Statistics, 1(1).
Sriyanshu, M. (2019) Techniques Used for Measuring Risk | Risk Management.
Available From: https://www.businessmanagementideas.com/essays/risk-
management-essays/techniques-used-for-measuring-risk-risk-management/12596
[Accessed 10/4/2020].
The Economic Times. (2019) Definition of 'Beta'. Available From:
https://economictimes.indiatimes.com/definition/Beta [Accessed 10/4/2020].
Yahoo Finance. (2019) Beacon Lighting Group Limited (BLX.AX). Available From:
https://au.finance.yahoo.com/quote/BLX.AX/ [Accessed 10/4/2020].
Paraphrase This Document
Need a fresh take? Get an instant paraphrase of this document with our AI Paraphraser

1 out of 11
Related Documents

Your All-in-One AI-Powered Toolkit for Academic Success.
+13062052269
info@desklib.com
Available 24*7 on WhatsApp / Email
Unlock your academic potential
Copyright © 2020–2025 A2Z Services. All Rights Reserved. Developed and managed by ZUCOL.