Chemistry Report: Analysis of Titration Graphs and pH

Verified

Added on  2022/12/29

|4
|428
|38
Report
AI Summary
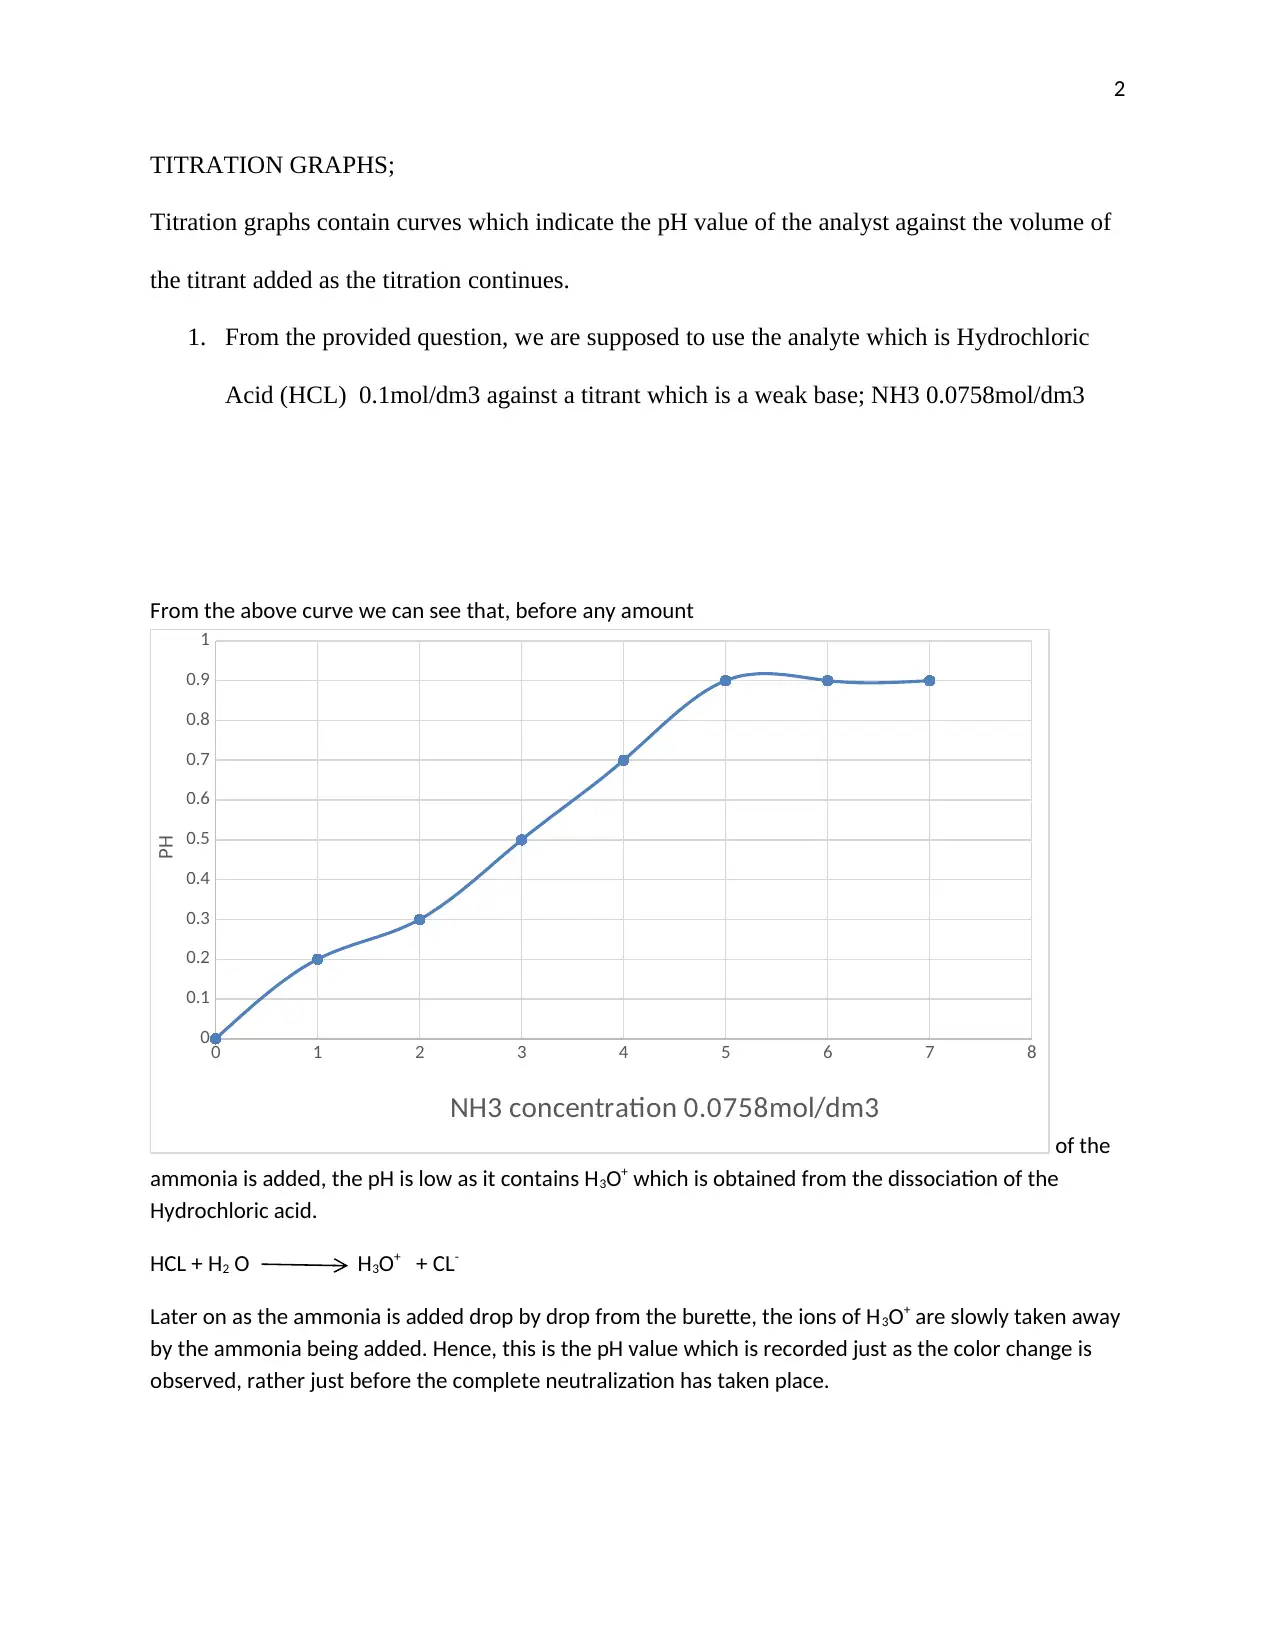
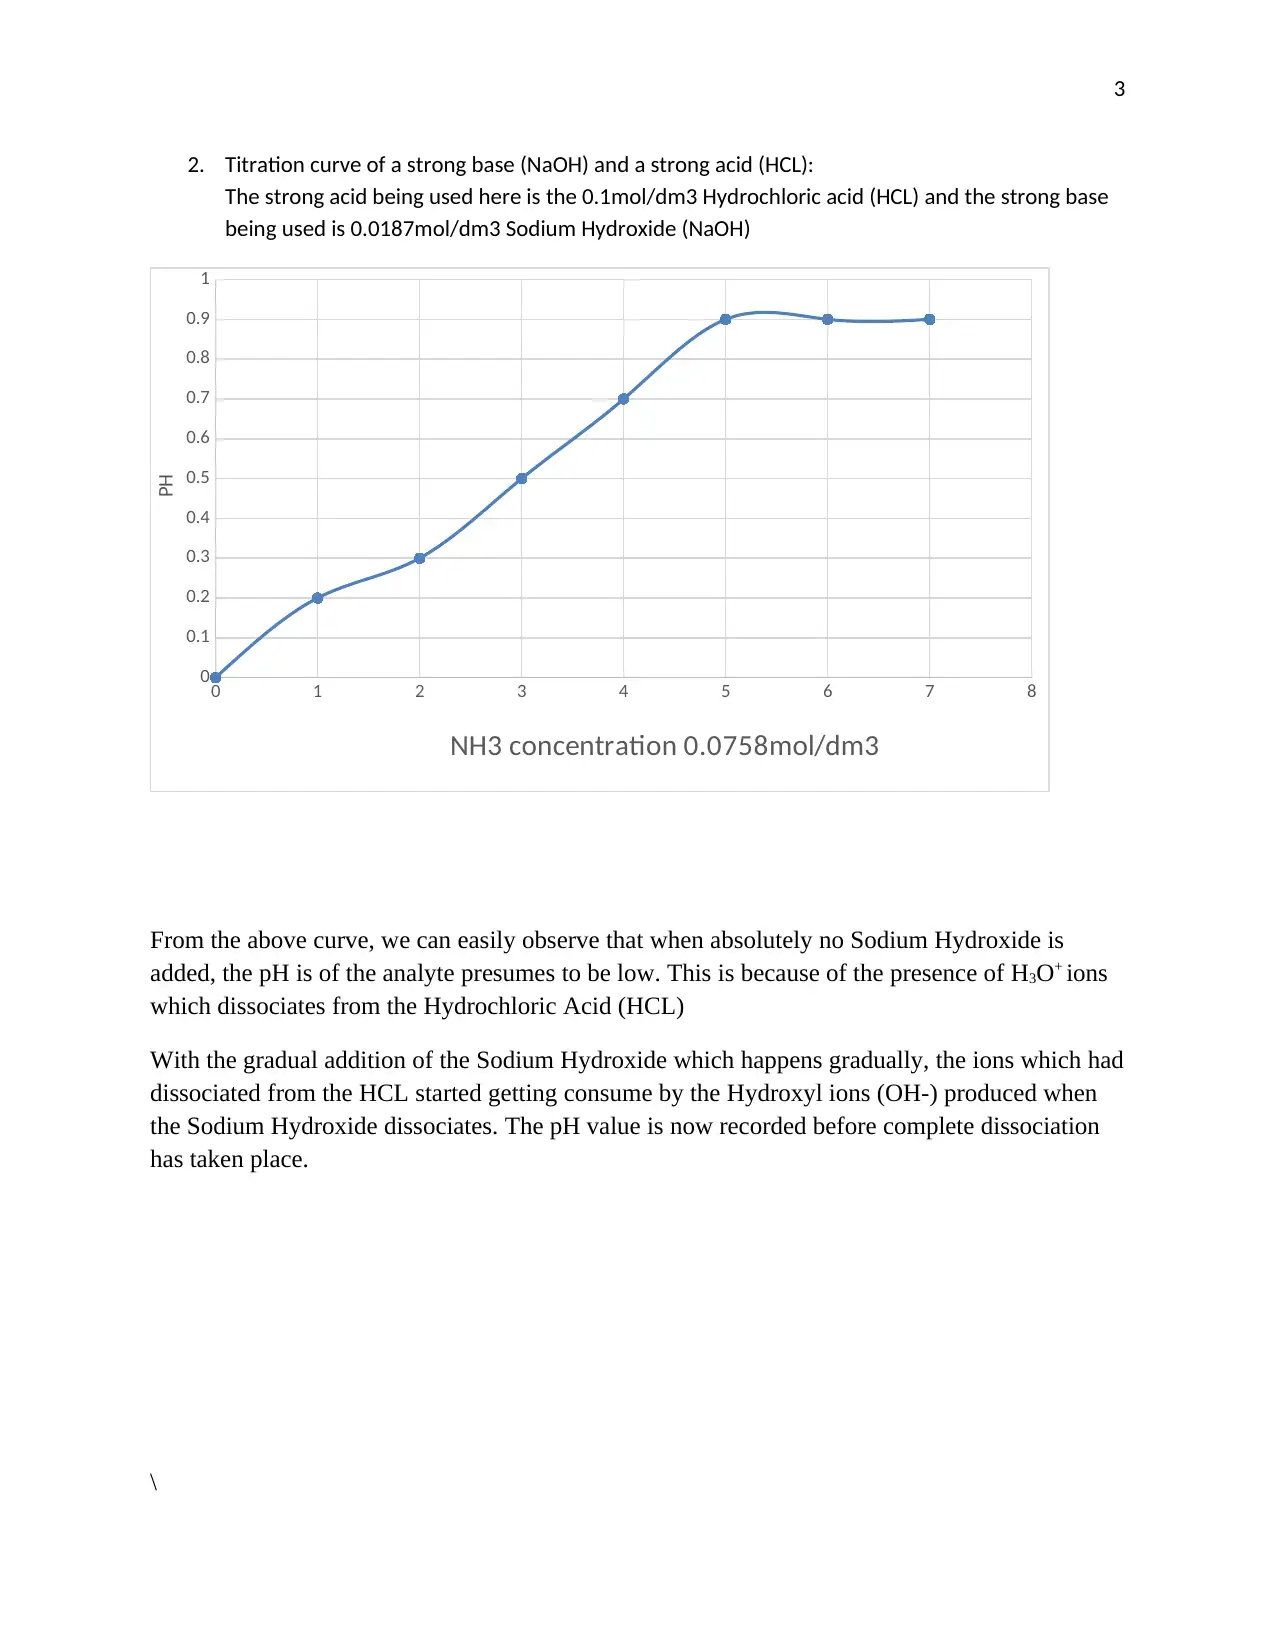
This report provides an analysis of titration graphs, focusing on the reactions between acids and bases. It examines the titration of hydrochloric acid (HCl) with ammonia (NH3), a weak base, and the titration of a strong acid (HCl) with a strong base (NaOH). The report explains how the pH changes during titration, providing insights into the behavior of H3O+ ions and the dissociation of acids and bases. The analysis includes the use of titration graphs to visualize the changes in pH as the titrant is added. References are provided for further reading on the topic, including the infrared titration of aqueous NaOH by aqueous HCl and computer-based projects for a chemistry curriculum.
Document Page
Running Head: Titration Graph 1
Title
Institution Affiliate
Student’s Name
tabler-icon-diamond-filled.svg

Paraphrase This Document

Need a fresh take? Get an instant paraphrase of this document with our AI Paraphraser
Document Page
2
TITRATION GRAPHS;
Titration graphs contain curves which indicate the pH value of the analyst against the volume of
the titrant added as the titration continues.
1. From the provided question, we are supposed to use the analyte which is Hydrochloric
Acid (HCL) 0.1mol/dm3 against a titrant which is a weak base; NH3 0.0758mol/dm3
From the above curve we can see that, before any amount
0 1 2 3 4 5 6 7 8
0
0.1
0.2
0.3
0.4
0.5
0.6
0.7
0.8
0.9
1
NH3 concentration 0.0758mol/dm3
PH
of the
ammonia is added, the pH is low as it contains H3O+ which is obtained from the dissociation of the
Hydrochloric acid.
HCL + H2 O H3O+ + CL-
Later on as the ammonia is added drop by drop from the burette, the ions of H3O+ are slowly taken away
by the ammonia being added. Hence, this is the pH value which is recorded just as the color change is
observed, rather just before the complete neutralization has taken place.
Document Page
3
2. Titration curve of a strong base (NaOH) and a strong acid (HCL):
The strong acid being used here is the 0.1mol/dm3 Hydrochloric acid (HCL) and the strong base
being used is 0.0187mol/dm3 Sodium Hydroxide (NaOH)
0 1 2 3 4 5 6 7 8
0
0.1
0.2
0.3
0.4
0.5
0.6
0.7
0.8
0.9
1
NH3 concentration 0.0758mol/dm3
PH
From the above curve, we can easily observe that when absolutely no Sodium Hydroxide is
added, the pH is of the analyte presumes to be low. This is because of the presence of H3O+ ions
which dissociates from the Hydrochloric Acid (HCL)
With the gradual addition of the Sodium Hydroxide which happens gradually, the ions which had
dissociated from the HCL started getting consume by the Hydroxyl ions (OH-) produced when
the Sodium Hydroxide dissociates. The pH value is now recorded before complete dissociation
has taken place.
\
Document Page
4
References
Max, Jean-Joseph, and Camille Chapados “Infrared titration of aqueous NaOH by aqueaous
HCL”. Canadian Journal of Chemistry 78, no. 1 (2000), 64-72. Doi:10.1139/v99-231.
Titration Involving a Strong and Weak Acid.” Computer based projects for a Chemistry
Curriculum, 2013, 64-70. doi:10.2174/9781608051939113010011.
chevron_up_icon
1 out of 4
circle_padding
hide_on_mobile
zoom_out_icon
[object Object]