SPSS Analysis of Tobacco Use in Uganda: Findings and Insights
VerifiedAdded on 2023/02/02
|14
|2342
|92
Report
AI Summary
This report presents a comprehensive SPSS analysis of tobacco use in Uganda, exploring various aspects of smoking behavior. The analysis includes frequency distributions, descriptive statistics, t-tests, and ANOVAs to examine the relationship between tobacco consumption and demographic factors such as age, gender, education, marital status, and occupation. The study investigates the use of manufactured cigarettes, hand-rolled cigarettes, and smokeless tobacco, along with the initiation age of smoking and cessation attempts. Mixed ANOVA tests are utilized to assess the impact of different variables. The report also examines perceptions of tobacco use and the factors influencing them. The findings provide valuable insights into the prevalence and patterns of tobacco use within the Ugandan population, contributing to a better understanding of public health challenges and potential interventions.

SPSS ANALYSIS- TOBACCO
USE IN UGANDA
USE IN UGANDA
Paraphrase This Document
Need a fresh take? Get an instant paraphrase of this document with our AI Paraphraser
Types of tobacco
Mixed ANOVA
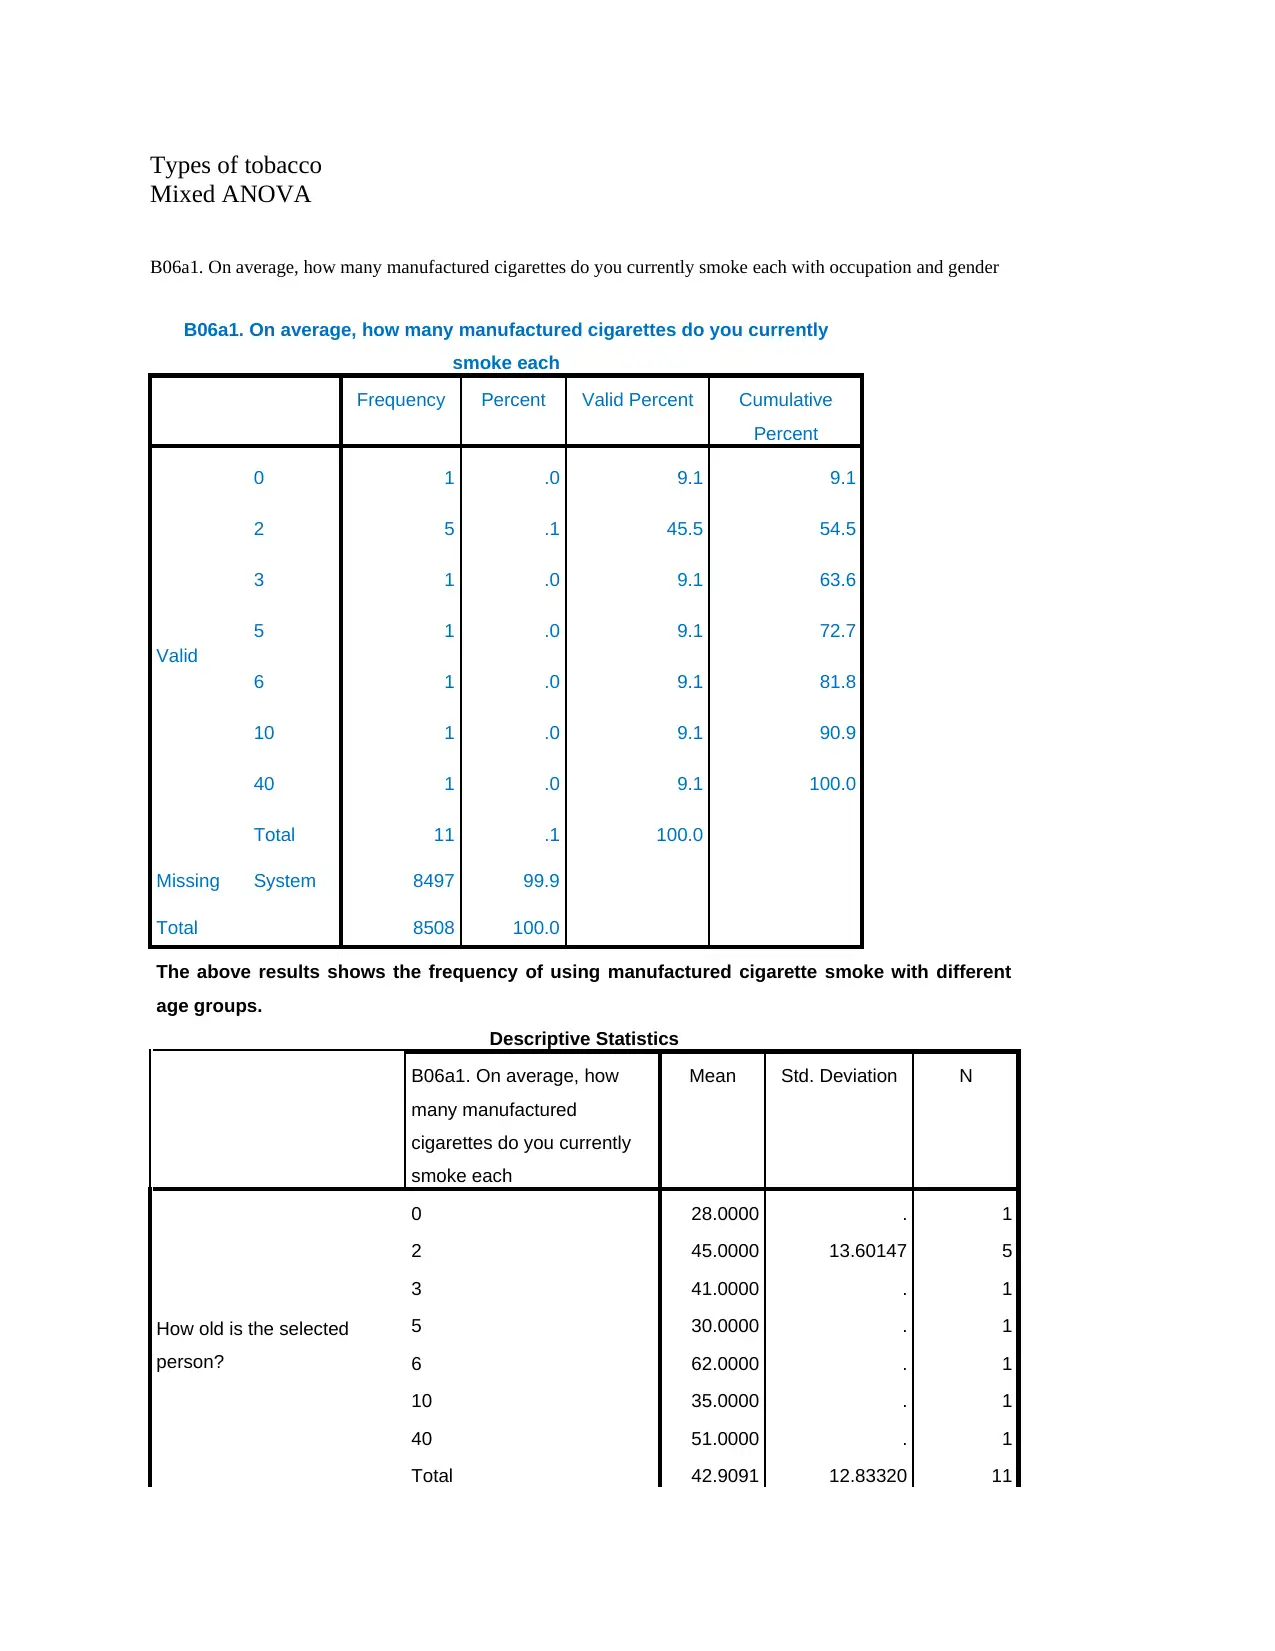
B06a1. On average, how many manufactured cigarettes do you currently smoke each with occupation and gender
B06a1. On average, how many manufactured cigarettes do you currently
smoke each
Frequency Percent Valid Percent Cumulative
Percent
Valid
0 1 .0 9.1 9.1
2 5 .1 45.5 54.5
3 1 .0 9.1 63.6
5 1 .0 9.1 72.7
6 1 .0 9.1 81.8
10 1 .0 9.1 90.9
40 1 .0 9.1 100.0
Total 11 .1 100.0
Missing System 8497 99.9
Total 8508 100.0
The above results shows the frequency of using manufactured cigarette smoke with different
age groups.
Descriptive Statistics
B06a1. On average, how
many manufactured
cigarettes do you currently
smoke each
Mean Std. Deviation N
How old is the selected
person?
0 28.0000 . 1
2 45.0000 13.60147 5
3 41.0000 . 1
5 30.0000 . 1
6 62.0000 . 1
10 35.0000 . 1
40 51.0000 . 1
Total 42.9091 12.83320 11
Mixed ANOVA
B06a1. On average, how many manufactured cigarettes do you currently smoke each with occupation and gender
B06a1. On average, how many manufactured cigarettes do you currently
smoke each
Frequency Percent Valid Percent Cumulative
Percent
Valid
0 1 .0 9.1 9.1
2 5 .1 45.5 54.5
3 1 .0 9.1 63.6
5 1 .0 9.1 72.7
6 1 .0 9.1 81.8
10 1 .0 9.1 90.9
40 1 .0 9.1 100.0
Total 11 .1 100.0
Missing System 8497 99.9
Total 8508 100.0
The above results shows the frequency of using manufactured cigarette smoke with different
age groups.
Descriptive Statistics
B06a1. On average, how
many manufactured
cigarettes do you currently
smoke each
Mean Std. Deviation N
How old is the selected
person?
0 28.0000 . 1
2 45.0000 13.60147 5
3 41.0000 . 1
5 30.0000 . 1
6 62.0000 . 1
10 35.0000 . 1
40 51.0000 . 1
Total 42.9091 12.83320 11
A01. [RECORD GENDER
FROM OBSERVATION.
ASK IF NECESSARY.]
0 1.00 . 1
2 1.00 .000 5
3 1.00 . 1
5 1.00 . 1
6 1.00 . 1
10 1.00 . 1
40 1.00 . 1
Total 1.00 .000 11
A05. Which of the following
best describes your *main*
work status over the past
0 3.00 . 1
2 3.00 .000 5
3 3.00 . 1
5 3.00 . 1
6 3.00 . 1
10 3.00 . 1
40 3.00 . 1
Total 3.00 .000 11
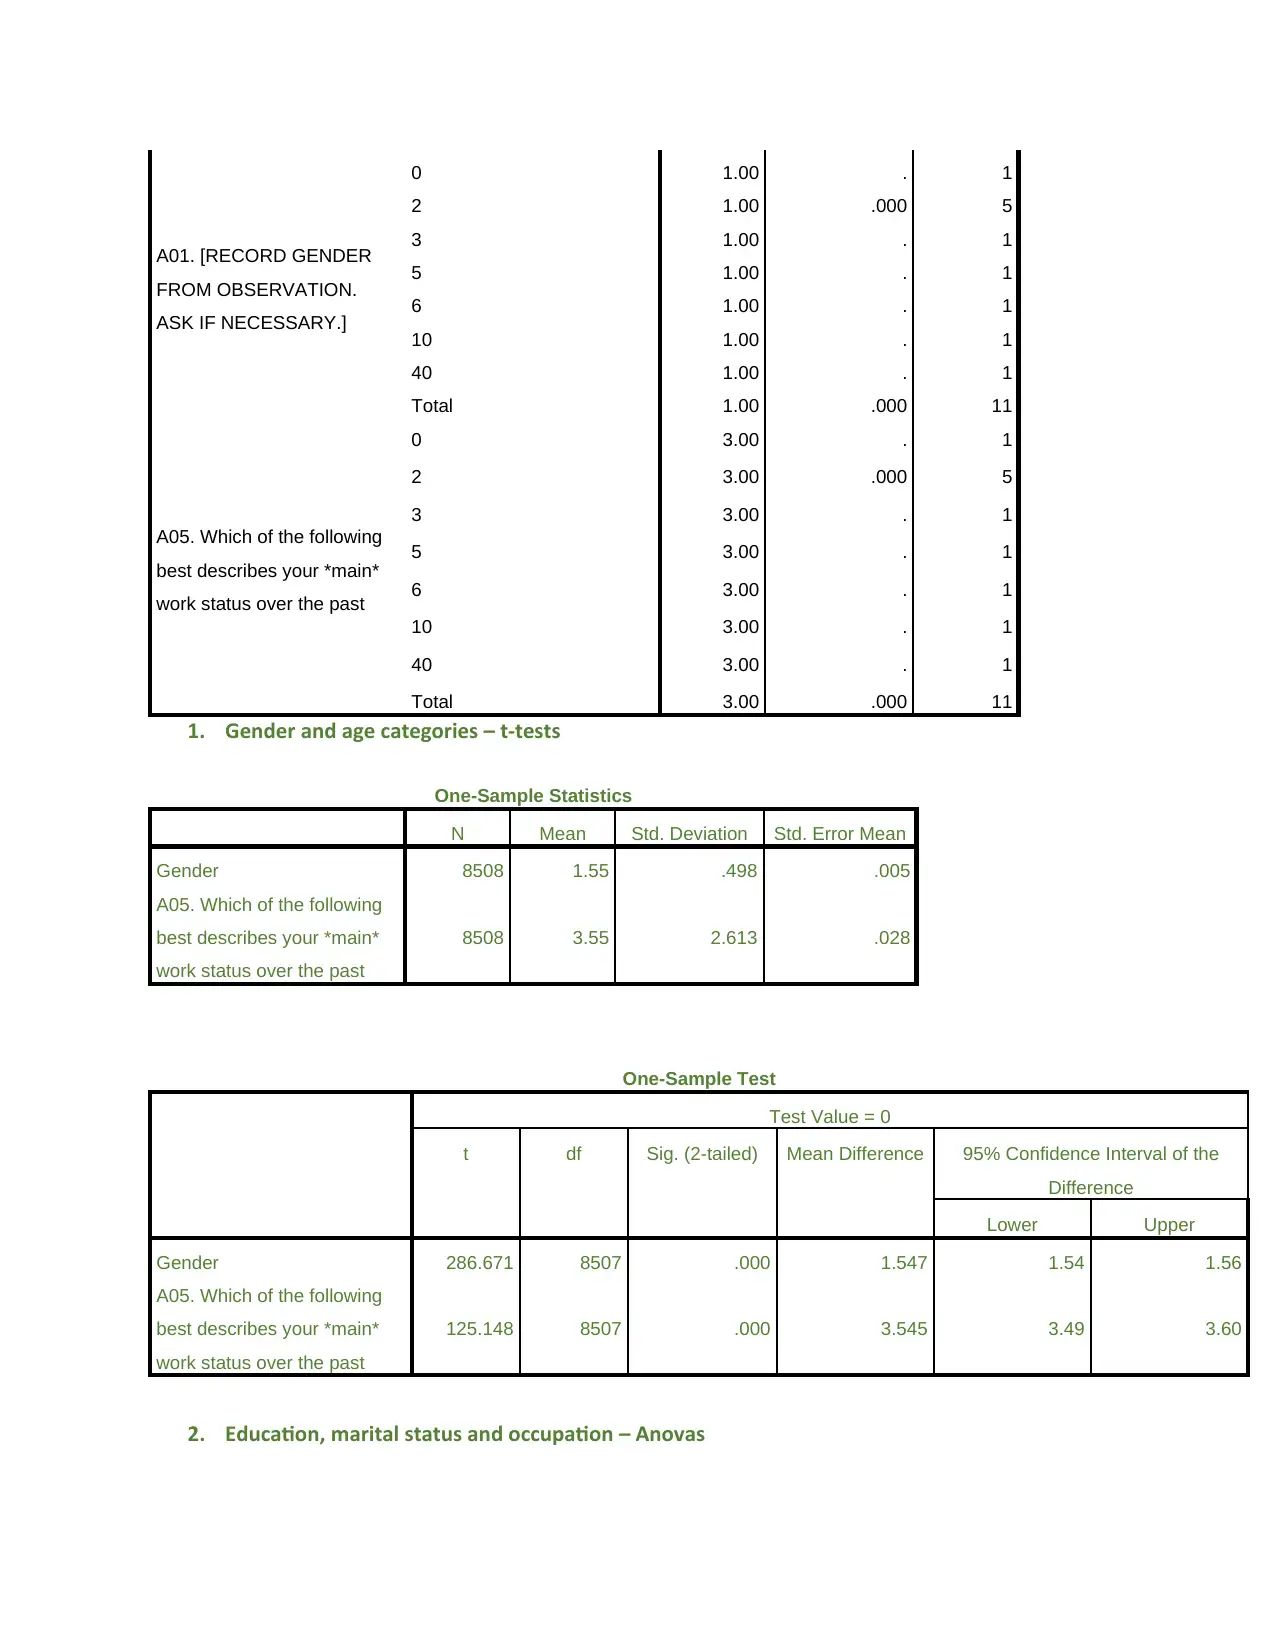
1. Gender and age categories – t-tests
One-Sample Statistics
N Mean Std. Deviation Std. Error Mean
Gender 8508 1.55 .498 .005
A05. Which of the following
best describes your *main*
work status over the past
8508 3.55 2.613 .028
One-Sample Test
Test Value = 0
t df Sig. (2-tailed) Mean Difference 95% Confidence Interval of the
Difference
Lower Upper
Gender 286.671 8507 .000 1.547 1.54 1.56
A05. Which of the following
best describes your *main*
work status over the past
125.148 8507 .000 3.545 3.49 3.60
2. Education, marital status and occupation – Anovas
FROM OBSERVATION.
ASK IF NECESSARY.]
0 1.00 . 1
2 1.00 .000 5
3 1.00 . 1
5 1.00 . 1
6 1.00 . 1
10 1.00 . 1
40 1.00 . 1
Total 1.00 .000 11
A05. Which of the following
best describes your *main*
work status over the past
0 3.00 . 1
2 3.00 .000 5
3 3.00 . 1
5 3.00 . 1
6 3.00 . 1
10 3.00 . 1
40 3.00 . 1
Total 3.00 .000 11
1. Gender and age categories – t-tests
One-Sample Statistics
N Mean Std. Deviation Std. Error Mean
Gender 8508 1.55 .498 .005
A05. Which of the following
best describes your *main*
work status over the past
8508 3.55 2.613 .028
One-Sample Test
Test Value = 0
t df Sig. (2-tailed) Mean Difference 95% Confidence Interval of the
Difference
Lower Upper
Gender 286.671 8507 .000 1.547 1.54 1.56
A05. Which of the following
best describes your *main*
work status over the past
125.148 8507 .000 3.545 3.49 3.60
2. Education, marital status and occupation – Anovas
⊘ This is a preview!⊘
Do you want full access?
Subscribe today to unlock all pages.
Trusted by 1+ million students worldwide
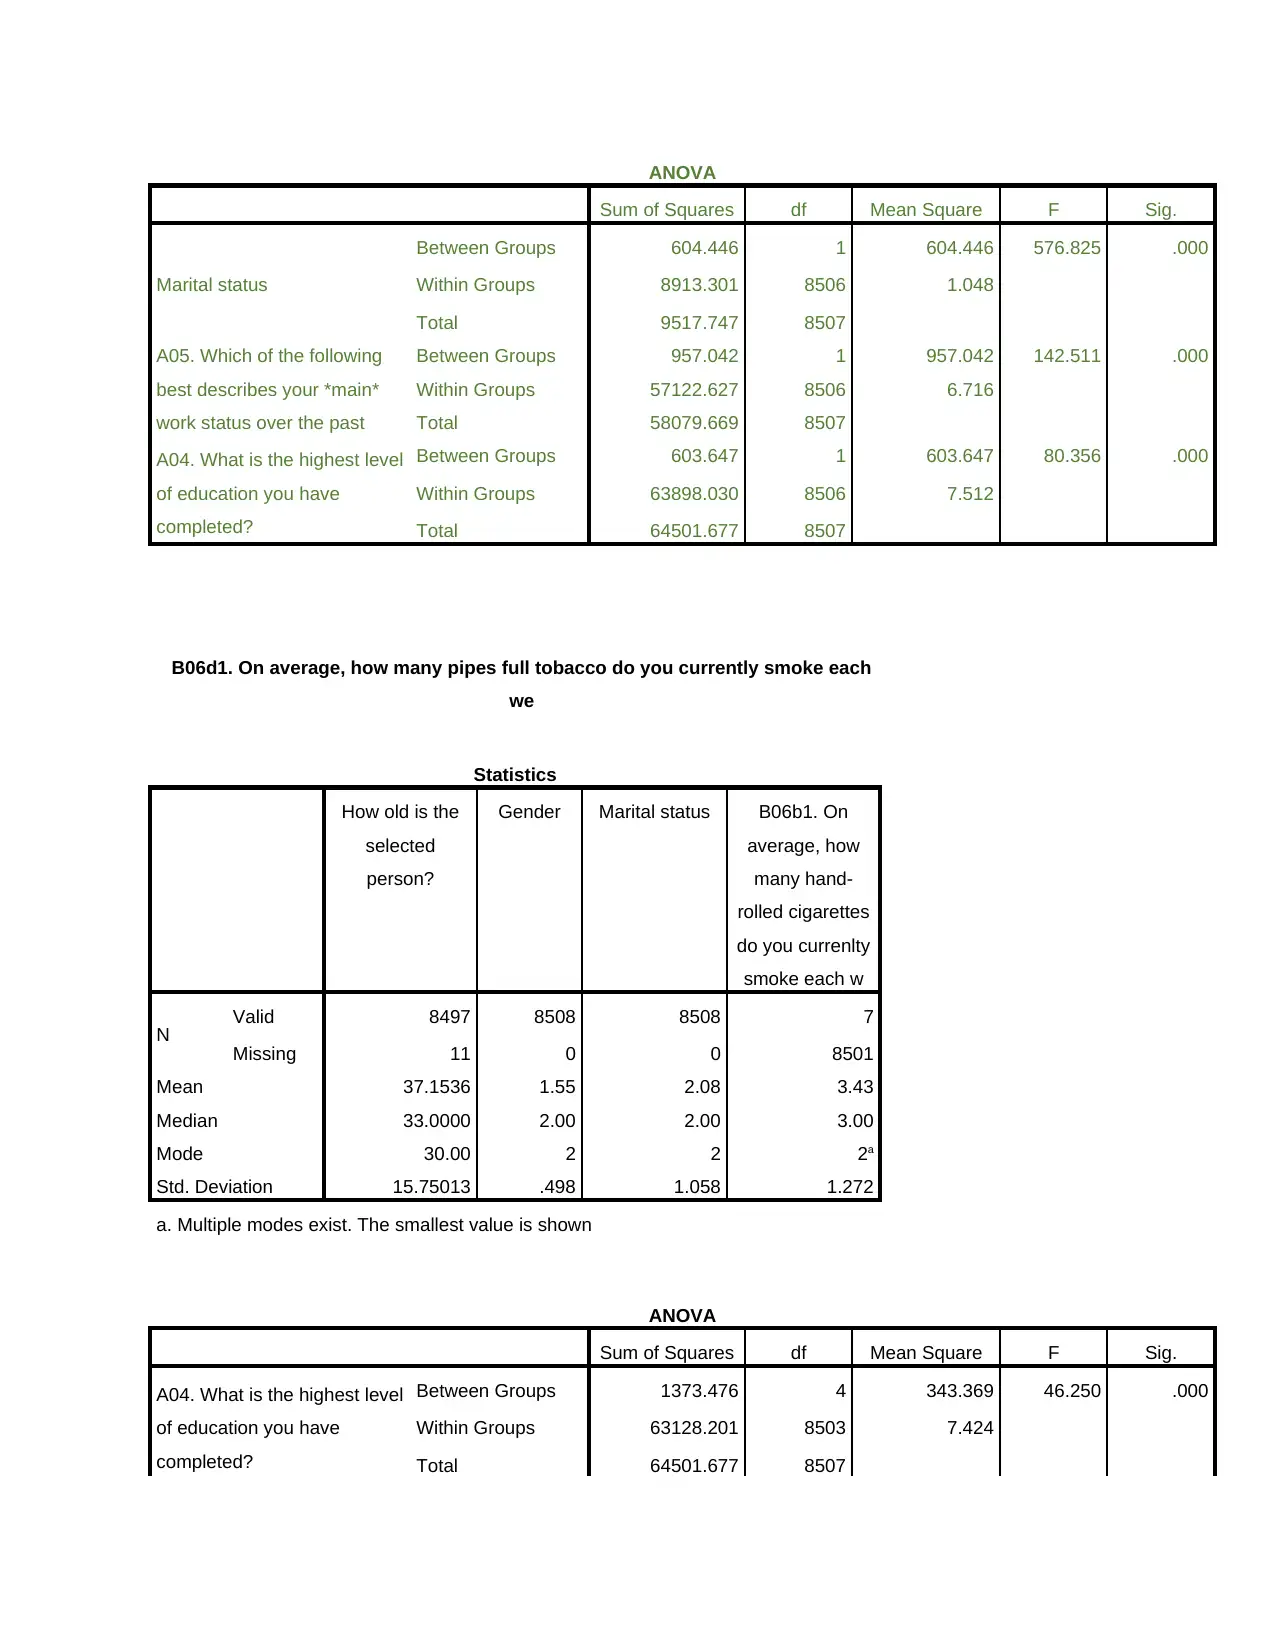
ANOVA
Sum of Squares df Mean Square F Sig.
Marital status
Between Groups 604.446 1 604.446 576.825 .000
Within Groups 8913.301 8506 1.048
Total 9517.747 8507
A05. Which of the following
best describes your *main*
work status over the past
Between Groups 957.042 1 957.042 142.511 .000
Within Groups 57122.627 8506 6.716
Total 58079.669 8507
A04. What is the highest level
of education you have
completed?
Between Groups 603.647 1 603.647 80.356 .000
Within Groups 63898.030 8506 7.512
Total 64501.677 8507
B06d1. On average, how many pipes full tobacco do you currently smoke each
we
Statistics
How old is the
selected
person?
Gender Marital status B06b1. On
average, how
many hand-
rolled cigarettes
do you currenlty
smoke each w
N Valid 8497 8508 8508 7
Missing 11 0 0 8501
Mean 37.1536 1.55 2.08 3.43
Median 33.0000 2.00 2.00 3.00
Mode 30.00 2 2 2a
Std. Deviation 15.75013 .498 1.058 1.272
a. Multiple modes exist. The smallest value is shown
ANOVA
Sum of Squares df Mean Square F Sig.
A04. What is the highest level
of education you have
completed?
Between Groups 1373.476 4 343.369 46.250 .000
Within Groups 63128.201 8503 7.424
Total 64501.677 8507
Sum of Squares df Mean Square F Sig.
Marital status
Between Groups 604.446 1 604.446 576.825 .000
Within Groups 8913.301 8506 1.048
Total 9517.747 8507
A05. Which of the following
best describes your *main*
work status over the past
Between Groups 957.042 1 957.042 142.511 .000
Within Groups 57122.627 8506 6.716
Total 58079.669 8507
A04. What is the highest level
of education you have
completed?
Between Groups 603.647 1 603.647 80.356 .000
Within Groups 63898.030 8506 7.512
Total 64501.677 8507
B06d1. On average, how many pipes full tobacco do you currently smoke each
we
Statistics
How old is the
selected
person?
Gender Marital status B06b1. On
average, how
many hand-
rolled cigarettes
do you currenlty
smoke each w
N Valid 8497 8508 8508 7
Missing 11 0 0 8501
Mean 37.1536 1.55 2.08 3.43
Median 33.0000 2.00 2.00 3.00
Mode 30.00 2 2 2a
Std. Deviation 15.75013 .498 1.058 1.272
a. Multiple modes exist. The smallest value is shown
ANOVA
Sum of Squares df Mean Square F Sig.
A04. What is the highest level
of education you have
completed?
Between Groups 1373.476 4 343.369 46.250 .000
Within Groups 63128.201 8503 7.424
Total 64501.677 8507
Paraphrase This Document
Need a fresh take? Get an instant paraphrase of this document with our AI Paraphraser
A05. Which of the following
best describes your *main*
work status over the past
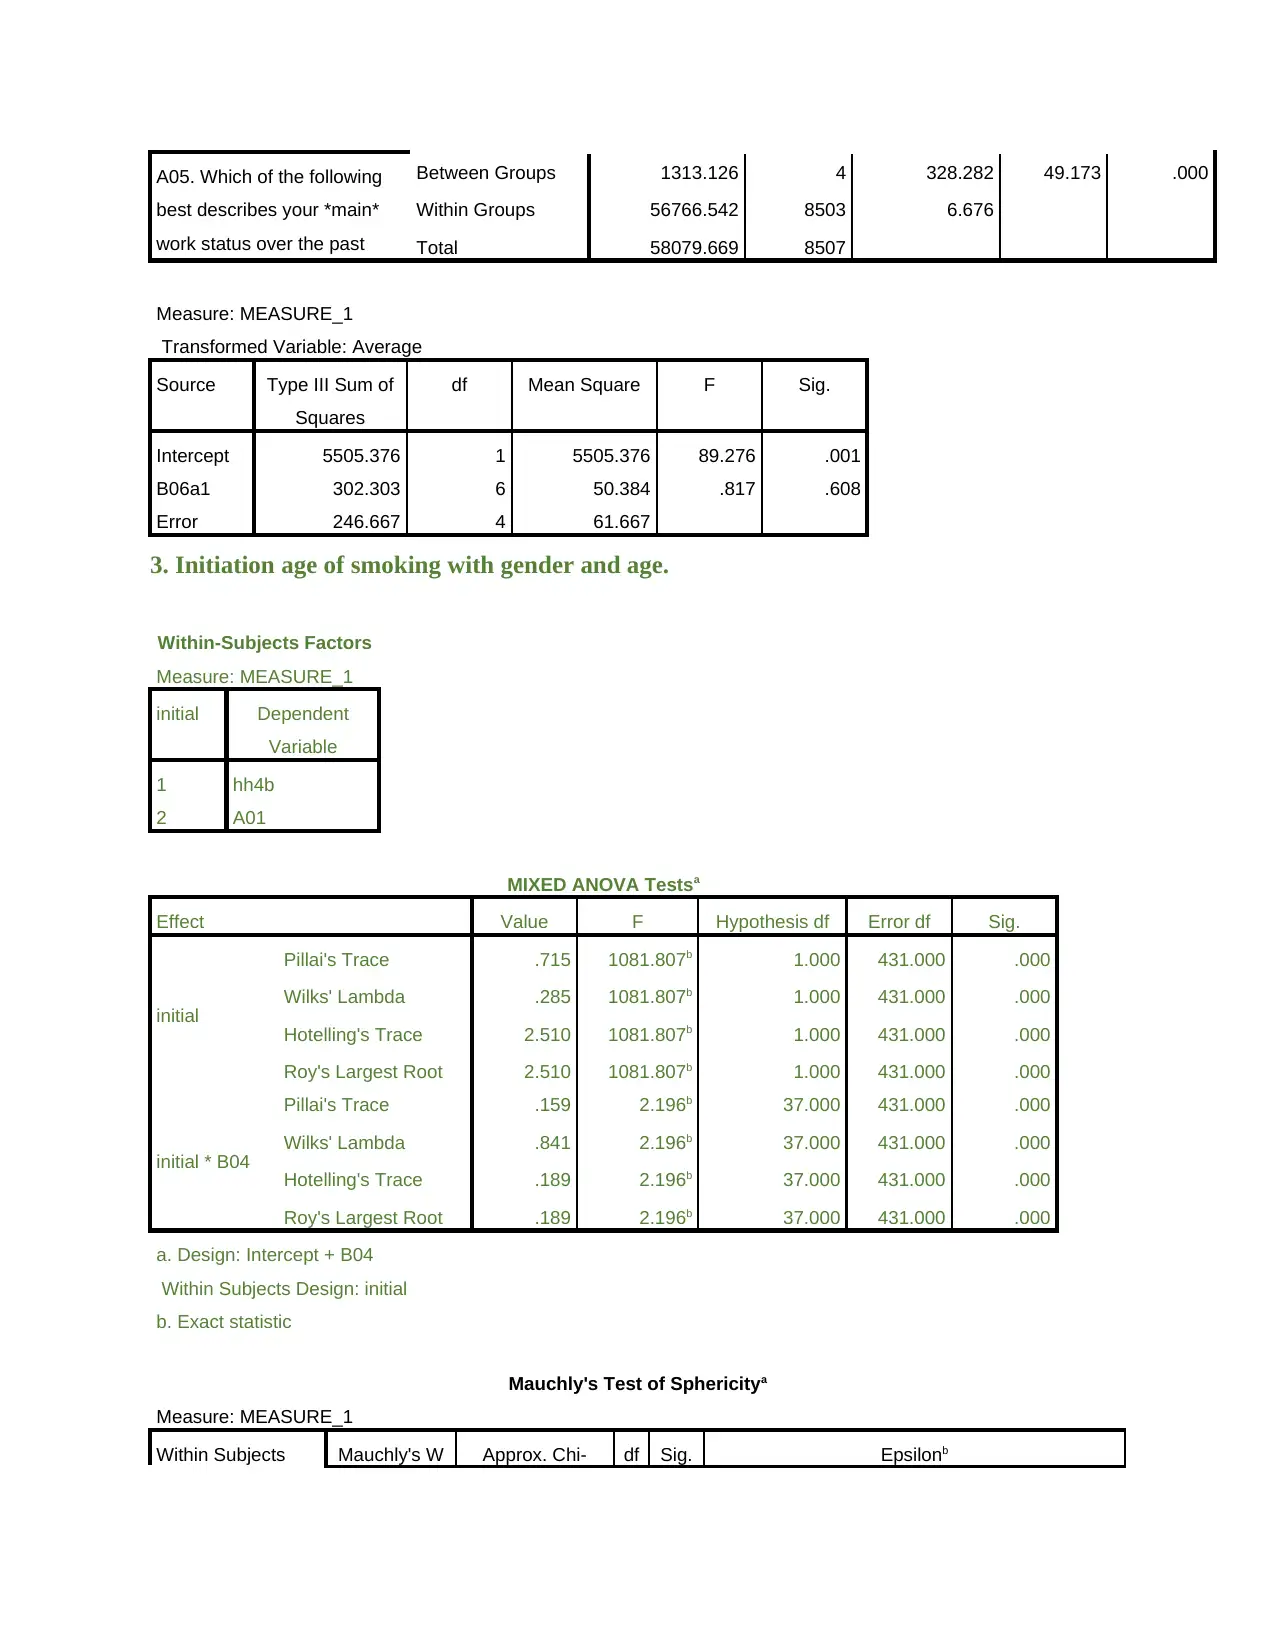
Between Groups 1313.126 4 328.282 49.173 .000
Within Groups 56766.542 8503 6.676
Total 58079.669 8507
Measure: MEASURE_1
Transformed Variable: Average
Source Type III Sum of
Squares
df Mean Square F Sig.
Intercept 5505.376 1 5505.376 89.276 .001
B06a1 302.303 6 50.384 .817 .608
Error 246.667 4 61.667
3. Initiation age of smoking with gender and age.
Within-Subjects Factors
Measure: MEASURE_1
initial Dependent
Variable
1 hh4b
2 A01
MIXED ANOVA Testsa
Effect Value F Hypothesis df Error df Sig.
initial
Pillai's Trace .715 1081.807b 1.000 431.000 .000
Wilks' Lambda .285 1081.807b 1.000 431.000 .000
Hotelling's Trace 2.510 1081.807b 1.000 431.000 .000
Roy's Largest Root 2.510 1081.807b 1.000 431.000 .000
initial * B04
Pillai's Trace .159 2.196b 37.000 431.000 .000
Wilks' Lambda .841 2.196b 37.000 431.000 .000
Hotelling's Trace .189 2.196b 37.000 431.000 .000
Roy's Largest Root .189 2.196b 37.000 431.000 .000
a. Design: Intercept + B04
Within Subjects Design: initial
b. Exact statistic
Mauchly's Test of Sphericitya
Measure: MEASURE_1
Within Subjects Mauchly's W Approx. Chi- df Sig. Epsilonb
best describes your *main*
work status over the past
Between Groups 1313.126 4 328.282 49.173 .000
Within Groups 56766.542 8503 6.676
Total 58079.669 8507
Measure: MEASURE_1
Transformed Variable: Average
Source Type III Sum of
Squares
df Mean Square F Sig.
Intercept 5505.376 1 5505.376 89.276 .001
B06a1 302.303 6 50.384 .817 .608
Error 246.667 4 61.667
3. Initiation age of smoking with gender and age.
Within-Subjects Factors
Measure: MEASURE_1
initial Dependent
Variable
1 hh4b
2 A01
MIXED ANOVA Testsa
Effect Value F Hypothesis df Error df Sig.
initial
Pillai's Trace .715 1081.807b 1.000 431.000 .000
Wilks' Lambda .285 1081.807b 1.000 431.000 .000
Hotelling's Trace 2.510 1081.807b 1.000 431.000 .000
Roy's Largest Root 2.510 1081.807b 1.000 431.000 .000
initial * B04
Pillai's Trace .159 2.196b 37.000 431.000 .000
Wilks' Lambda .841 2.196b 37.000 431.000 .000
Hotelling's Trace .189 2.196b 37.000 431.000 .000
Roy's Largest Root .189 2.196b 37.000 431.000 .000
a. Design: Intercept + B04
Within Subjects Design: initial
b. Exact statistic
Mauchly's Test of Sphericitya
Measure: MEASURE_1
Within Subjects Mauchly's W Approx. Chi- df Sig. Epsilonb
Effect Square Greenhouse-Geisser Huynh-Feldt Lower-
bound
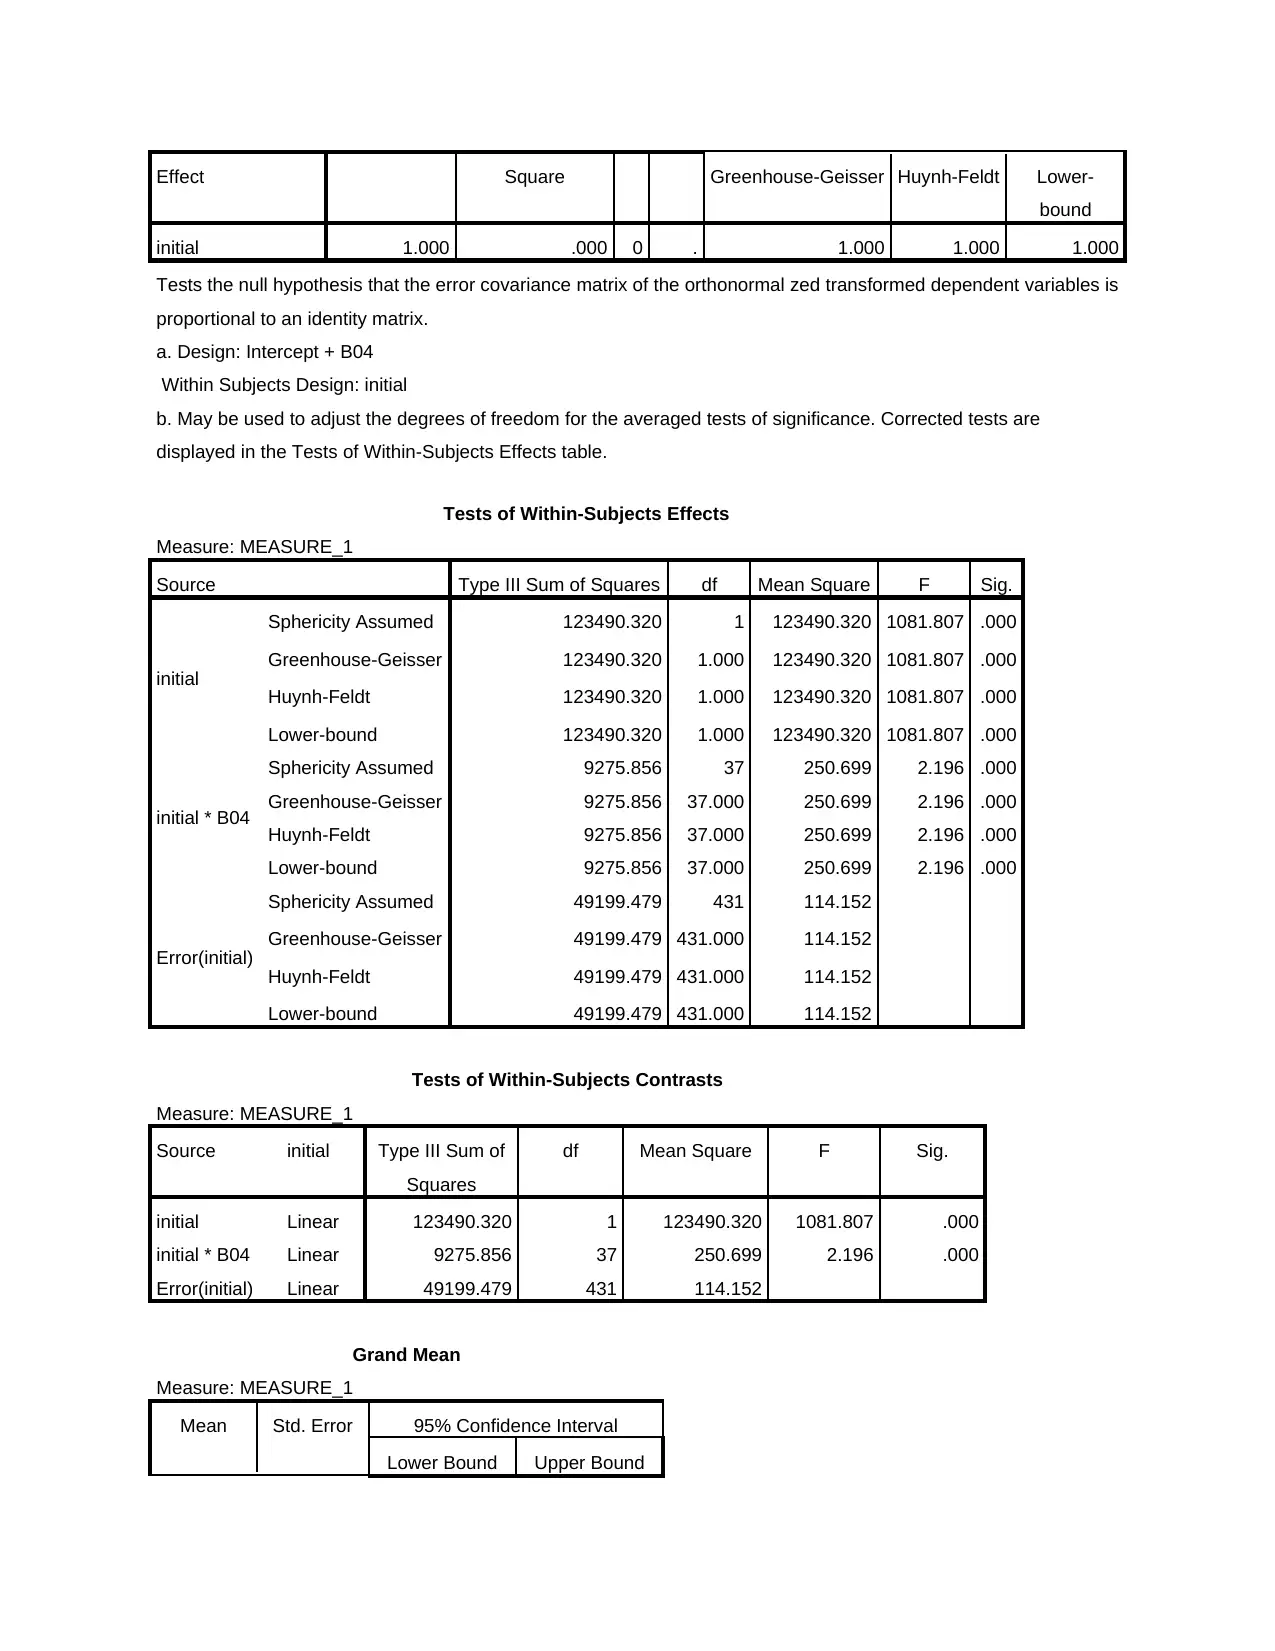
initial 1.000 .000 0 . 1.000 1.000 1.000
Tests the null hypothesis that the error covariance matrix of the orthonormal zed transformed dependent variables is
proportional to an identity matrix.
a. Design: Intercept + B04
Within Subjects Design: initial
b. May be used to adjust the degrees of freedom for the averaged tests of significance. Corrected tests are
displayed in the Tests of Within-Subjects Effects table.
Tests of Within-Subjects Effects
Measure: MEASURE_1
Source Type III Sum of Squares df Mean Square F Sig.
initial
Sphericity Assumed 123490.320 1 123490.320 1081.807 .000
Greenhouse-Geisser 123490.320 1.000 123490.320 1081.807 .000
Huynh-Feldt 123490.320 1.000 123490.320 1081.807 .000
Lower-bound 123490.320 1.000 123490.320 1081.807 .000
initial * B04
Sphericity Assumed 9275.856 37 250.699 2.196 .000
Greenhouse-Geisser 9275.856 37.000 250.699 2.196 .000
Huynh-Feldt 9275.856 37.000 250.699 2.196 .000
Lower-bound 9275.856 37.000 250.699 2.196 .000
Error(initial)
Sphericity Assumed 49199.479 431 114.152
Greenhouse-Geisser 49199.479 431.000 114.152
Huynh-Feldt 49199.479 431.000 114.152
Lower-bound 49199.479 431.000 114.152
Tests of Within-Subjects Contrasts
Measure: MEASURE_1
Source initial Type III Sum of
Squares
df Mean Square F Sig.
initial Linear 123490.320 1 123490.320 1081.807 .000
initial * B04 Linear 9275.856 37 250.699 2.196 .000
Error(initial) Linear 49199.479 431 114.152
Grand Mean
Measure: MEASURE_1
Mean Std. Error 95% Confidence Interval
Lower Bound Upper Bound
bound
initial 1.000 .000 0 . 1.000 1.000 1.000
Tests the null hypothesis that the error covariance matrix of the orthonormal zed transformed dependent variables is
proportional to an identity matrix.
a. Design: Intercept + B04
Within Subjects Design: initial
b. May be used to adjust the degrees of freedom for the averaged tests of significance. Corrected tests are
displayed in the Tests of Within-Subjects Effects table.
Tests of Within-Subjects Effects
Measure: MEASURE_1
Source Type III Sum of Squares df Mean Square F Sig.
initial
Sphericity Assumed 123490.320 1 123490.320 1081.807 .000
Greenhouse-Geisser 123490.320 1.000 123490.320 1081.807 .000
Huynh-Feldt 123490.320 1.000 123490.320 1081.807 .000
Lower-bound 123490.320 1.000 123490.320 1081.807 .000
initial * B04
Sphericity Assumed 9275.856 37 250.699 2.196 .000
Greenhouse-Geisser 9275.856 37.000 250.699 2.196 .000
Huynh-Feldt 9275.856 37.000 250.699 2.196 .000
Lower-bound 9275.856 37.000 250.699 2.196 .000
Error(initial)
Sphericity Assumed 49199.479 431 114.152
Greenhouse-Geisser 49199.479 431.000 114.152
Huynh-Feldt 49199.479 431.000 114.152
Lower-bound 49199.479 431.000 114.152
Tests of Within-Subjects Contrasts
Measure: MEASURE_1
Source initial Type III Sum of
Squares
df Mean Square F Sig.
initial Linear 123490.320 1 123490.320 1081.807 .000
initial * B04 Linear 9275.856 37 250.699 2.196 .000
Error(initial) Linear 49199.479 431 114.152
Grand Mean
Measure: MEASURE_1
Mean Std. Error 95% Confidence Interval
Lower Bound Upper Bound
⊘ This is a preview!⊘
Do you want full access?
Subscribe today to unlock all pages.
Trusted by 1+ million students worldwide
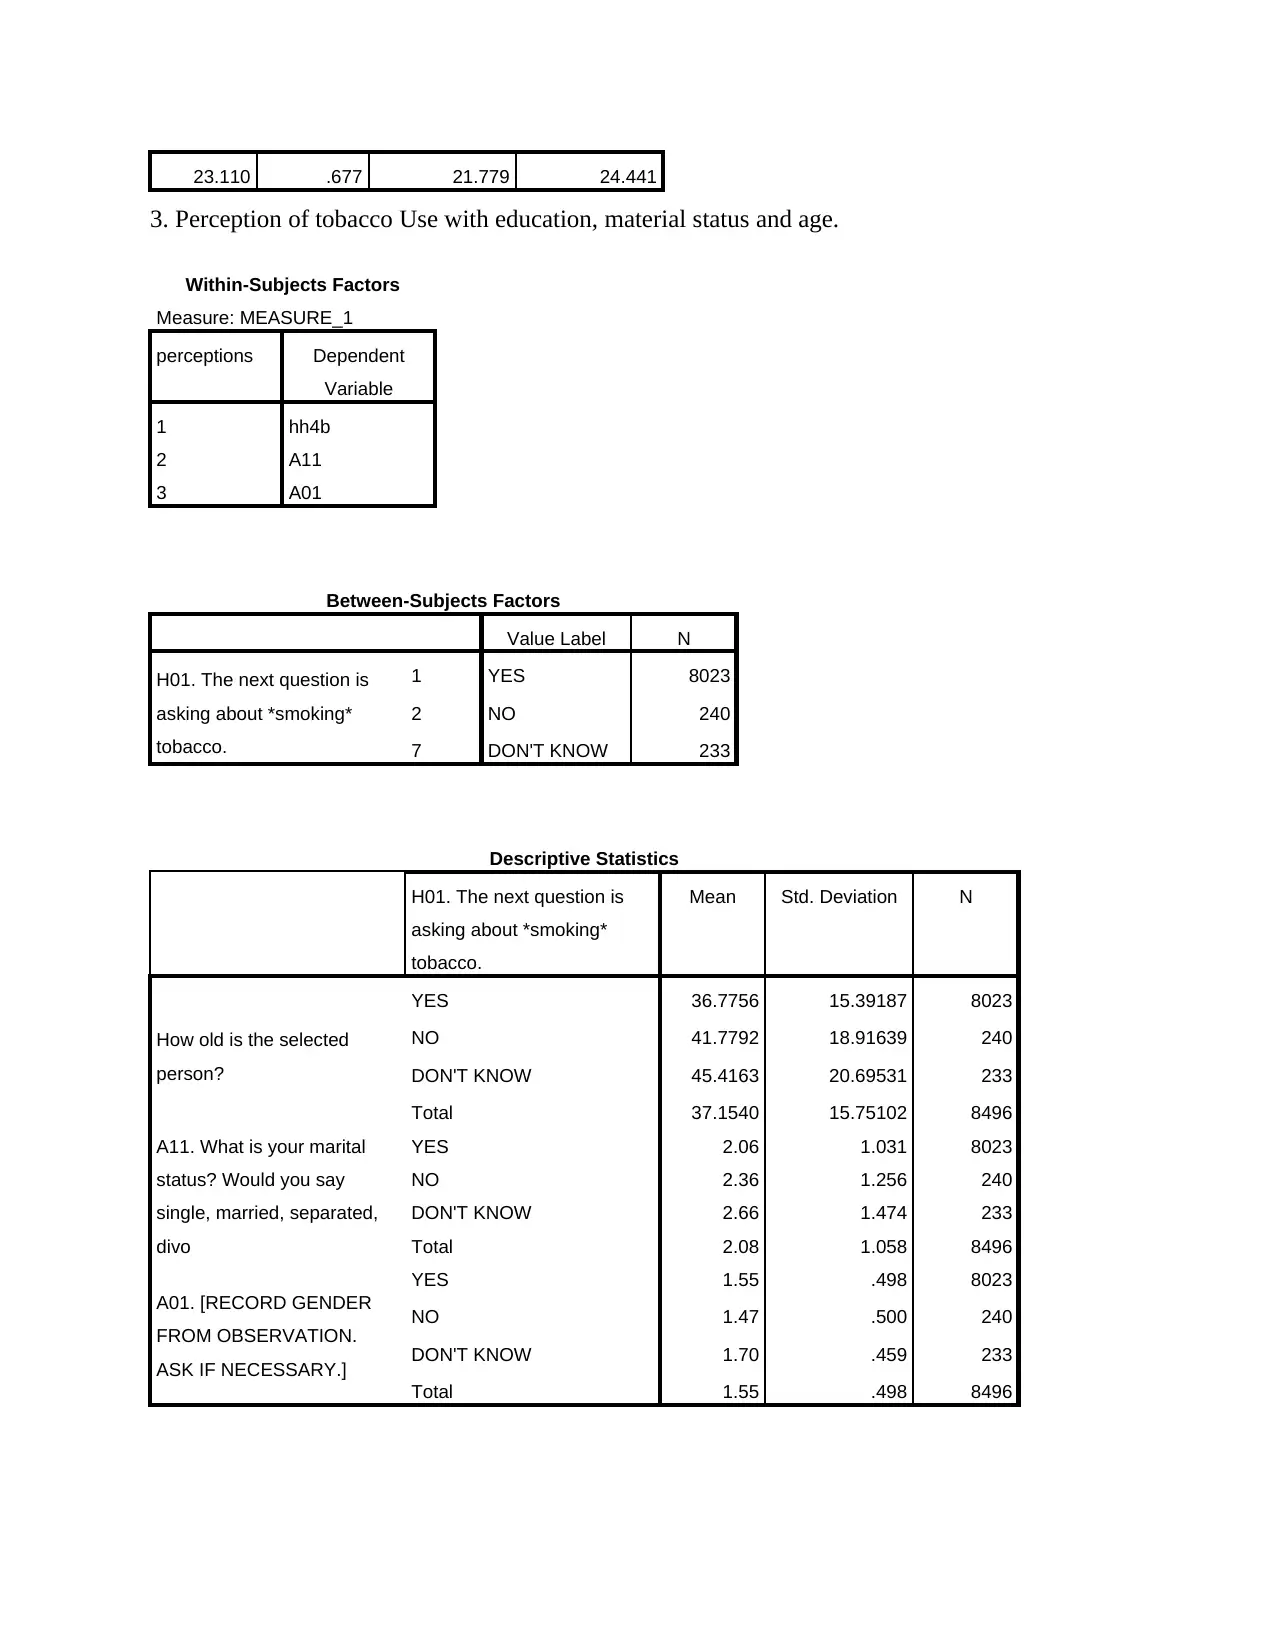
23.110 .677 21.779 24.441
3. Perception of tobacco Use with education, material status and age.
Within-Subjects Factors
Measure: MEASURE_1
perceptions Dependent
Variable
1 hh4b
2 A11
3 A01
Between-Subjects Factors
Value Label N
H01. The next question is
asking about *smoking*
tobacco.
1 YES 8023
2 NO 240
7 DON'T KNOW 233
Descriptive Statistics
H01. The next question is
asking about *smoking*
tobacco.
Mean Std. Deviation N
How old is the selected
person?
YES 36.7756 15.39187 8023
NO 41.7792 18.91639 240
DON'T KNOW 45.4163 20.69531 233
Total 37.1540 15.75102 8496
A11. What is your marital
status? Would you say
single, married, separated,
divo
YES 2.06 1.031 8023
NO 2.36 1.256 240
DON'T KNOW 2.66 1.474 233
Total 2.08 1.058 8496
A01. [RECORD GENDER
FROM OBSERVATION.
ASK IF NECESSARY.]
YES 1.55 .498 8023
NO 1.47 .500 240
DON'T KNOW 1.70 .459 233
Total 1.55 .498 8496
Paraphrase This Document
Need a fresh take? Get an instant paraphrase of this document with our AI Paraphraser
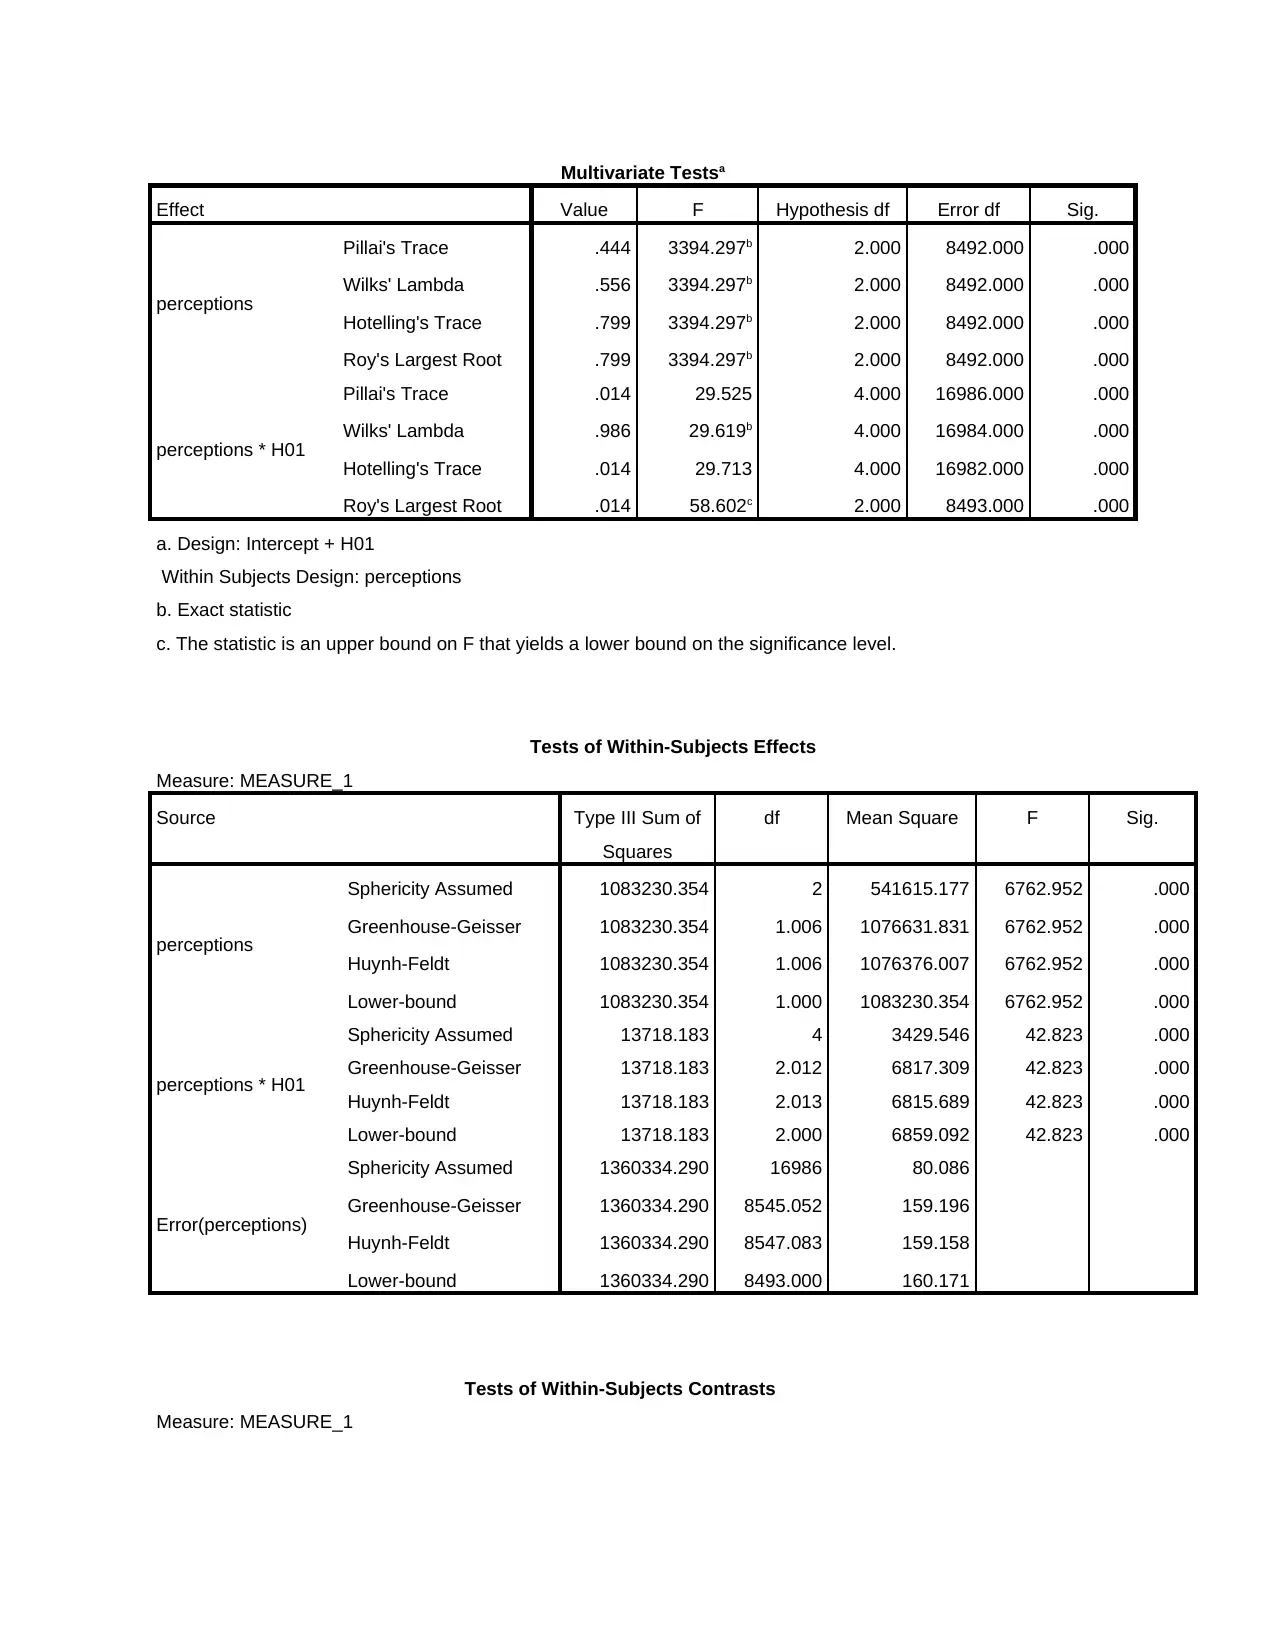
Multivariate Testsa
Effect Value F Hypothesis df Error df Sig.
perceptions
Pillai's Trace .444 3394.297b 2.000 8492.000 .000
Wilks' Lambda .556 3394.297b 2.000 8492.000 .000
Hotelling's Trace .799 3394.297b 2.000 8492.000 .000
Roy's Largest Root .799 3394.297b 2.000 8492.000 .000
perceptions * H01
Pillai's Trace .014 29.525 4.000 16986.000 .000
Wilks' Lambda .986 29.619b 4.000 16984.000 .000
Hotelling's Trace .014 29.713 4.000 16982.000 .000
Roy's Largest Root .014 58.602c 2.000 8493.000 .000
a. Design: Intercept + H01
Within Subjects Design: perceptions
b. Exact statistic
c. The statistic is an upper bound on F that yields a lower bound on the significance level.
Tests of Within-Subjects Effects
Measure: MEASURE_1
Source Type III Sum of
Squares
df Mean Square F Sig.
perceptions
Sphericity Assumed 1083230.354 2 541615.177 6762.952 .000
Greenhouse-Geisser 1083230.354 1.006 1076631.831 6762.952 .000
Huynh-Feldt 1083230.354 1.006 1076376.007 6762.952 .000
Lower-bound 1083230.354 1.000 1083230.354 6762.952 .000
perceptions * H01
Sphericity Assumed 13718.183 4 3429.546 42.823 .000
Greenhouse-Geisser 13718.183 2.012 6817.309 42.823 .000
Huynh-Feldt 13718.183 2.013 6815.689 42.823 .000
Lower-bound 13718.183 2.000 6859.092 42.823 .000
Error(perceptions)
Sphericity Assumed 1360334.290 16986 80.086
Greenhouse-Geisser 1360334.290 8545.052 159.196
Huynh-Feldt 1360334.290 8547.083 159.158
Lower-bound 1360334.290 8493.000 160.171
Tests of Within-Subjects Contrasts
Measure: MEASURE_1
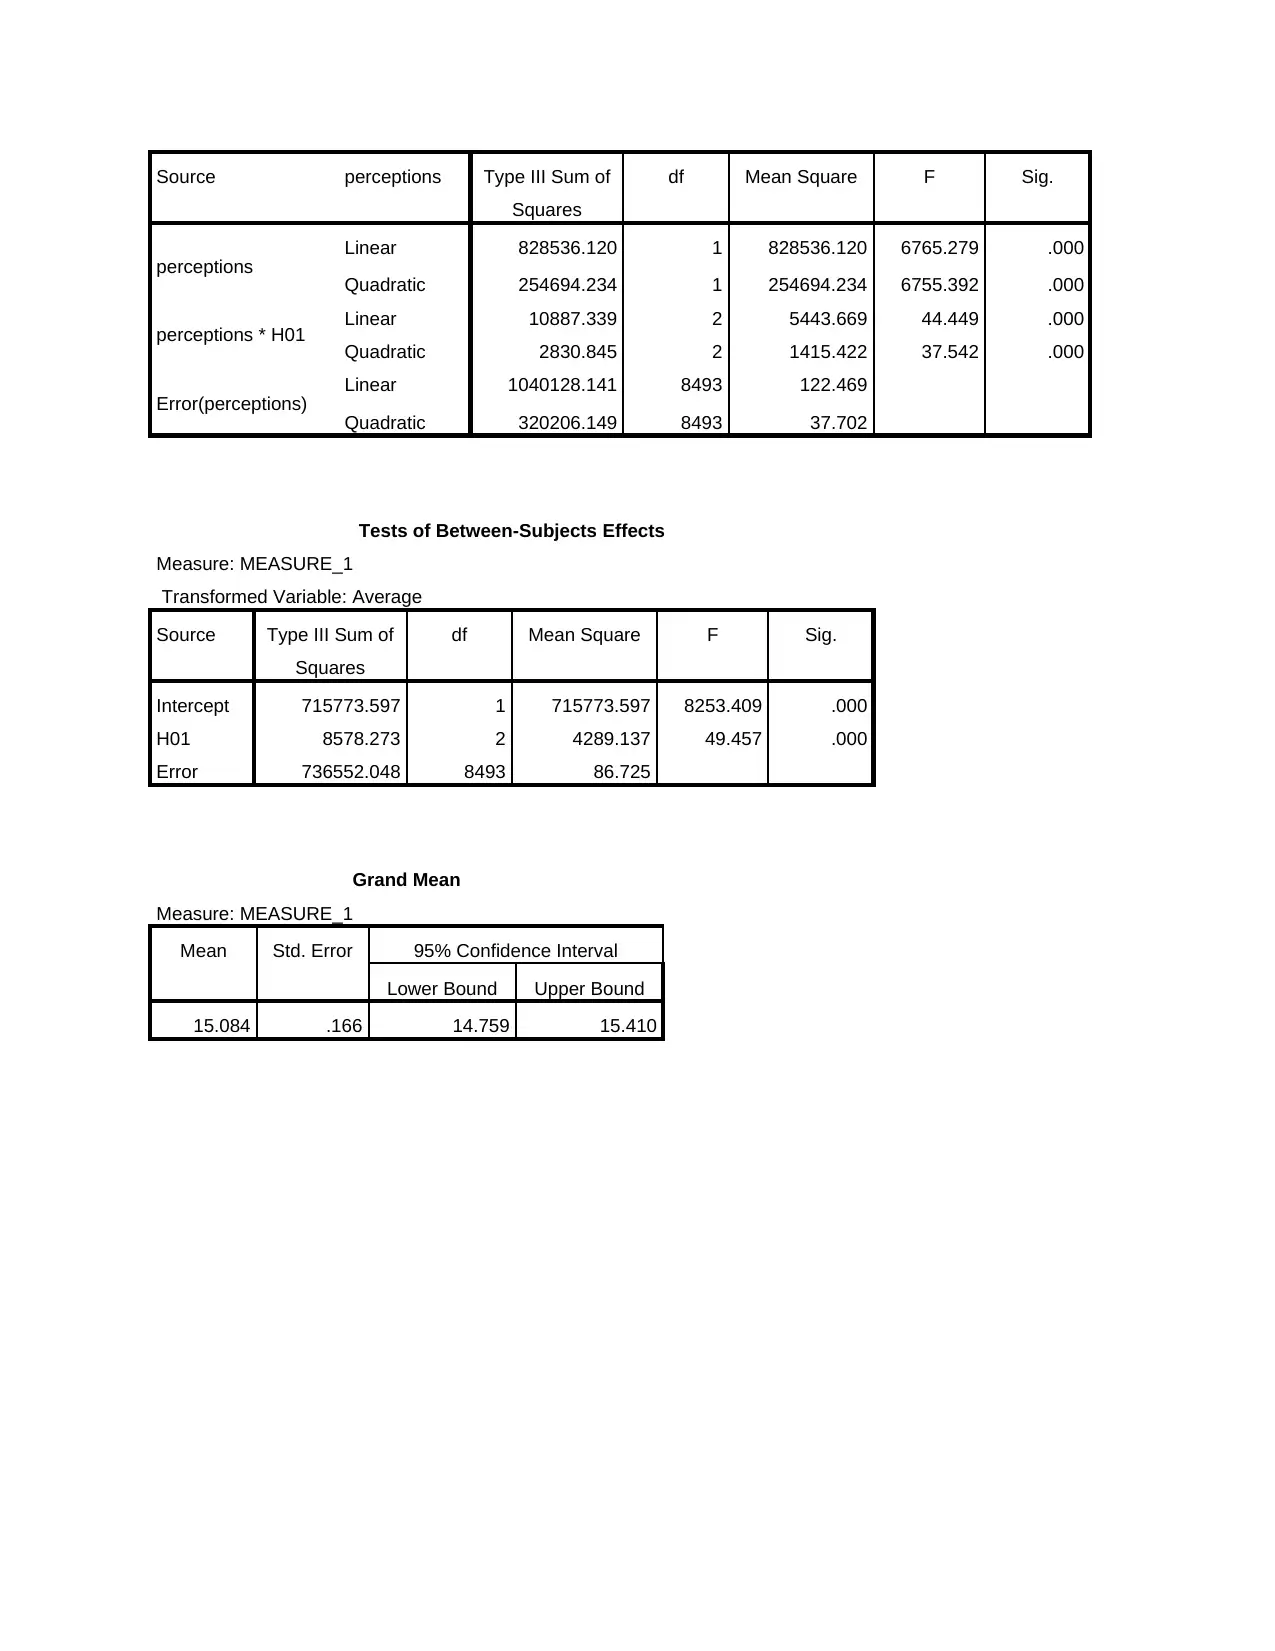
Source perceptions Type III Sum of
Squares
df Mean Square F Sig.
perceptions Linear 828536.120 1 828536.120 6765.279 .000
Quadratic 254694.234 1 254694.234 6755.392 .000
perceptions * H01 Linear 10887.339 2 5443.669 44.449 .000
Quadratic 2830.845 2 1415.422 37.542 .000
Error(perceptions) Linear 1040128.141 8493 122.469
Quadratic 320206.149 8493 37.702
Tests of Between-Subjects Effects
Measure: MEASURE_1
Transformed Variable: Average
Source Type III Sum of
Squares
df Mean Square F Sig.
Intercept 715773.597 1 715773.597 8253.409 .000
H01 8578.273 2 4289.137 49.457 .000
Error 736552.048 8493 86.725
Grand Mean
Measure: MEASURE_1
Mean Std. Error 95% Confidence Interval
Lower Bound Upper Bound
15.084 .166 14.759 15.410
Squares
df Mean Square F Sig.
perceptions Linear 828536.120 1 828536.120 6765.279 .000
Quadratic 254694.234 1 254694.234 6755.392 .000
perceptions * H01 Linear 10887.339 2 5443.669 44.449 .000
Quadratic 2830.845 2 1415.422 37.542 .000
Error(perceptions) Linear 1040128.141 8493 122.469
Quadratic 320206.149 8493 37.702
Tests of Between-Subjects Effects
Measure: MEASURE_1
Transformed Variable: Average
Source Type III Sum of
Squares
df Mean Square F Sig.
Intercept 715773.597 1 715773.597 8253.409 .000
H01 8578.273 2 4289.137 49.457 .000
Error 736552.048 8493 86.725
Grand Mean
Measure: MEASURE_1
Mean Std. Error 95% Confidence Interval
Lower Bound Upper Bound
15.084 .166 14.759 15.410
⊘ This is a preview!⊘
Do you want full access?
Subscribe today to unlock all pages.
Trusted by 1+ million students worldwide
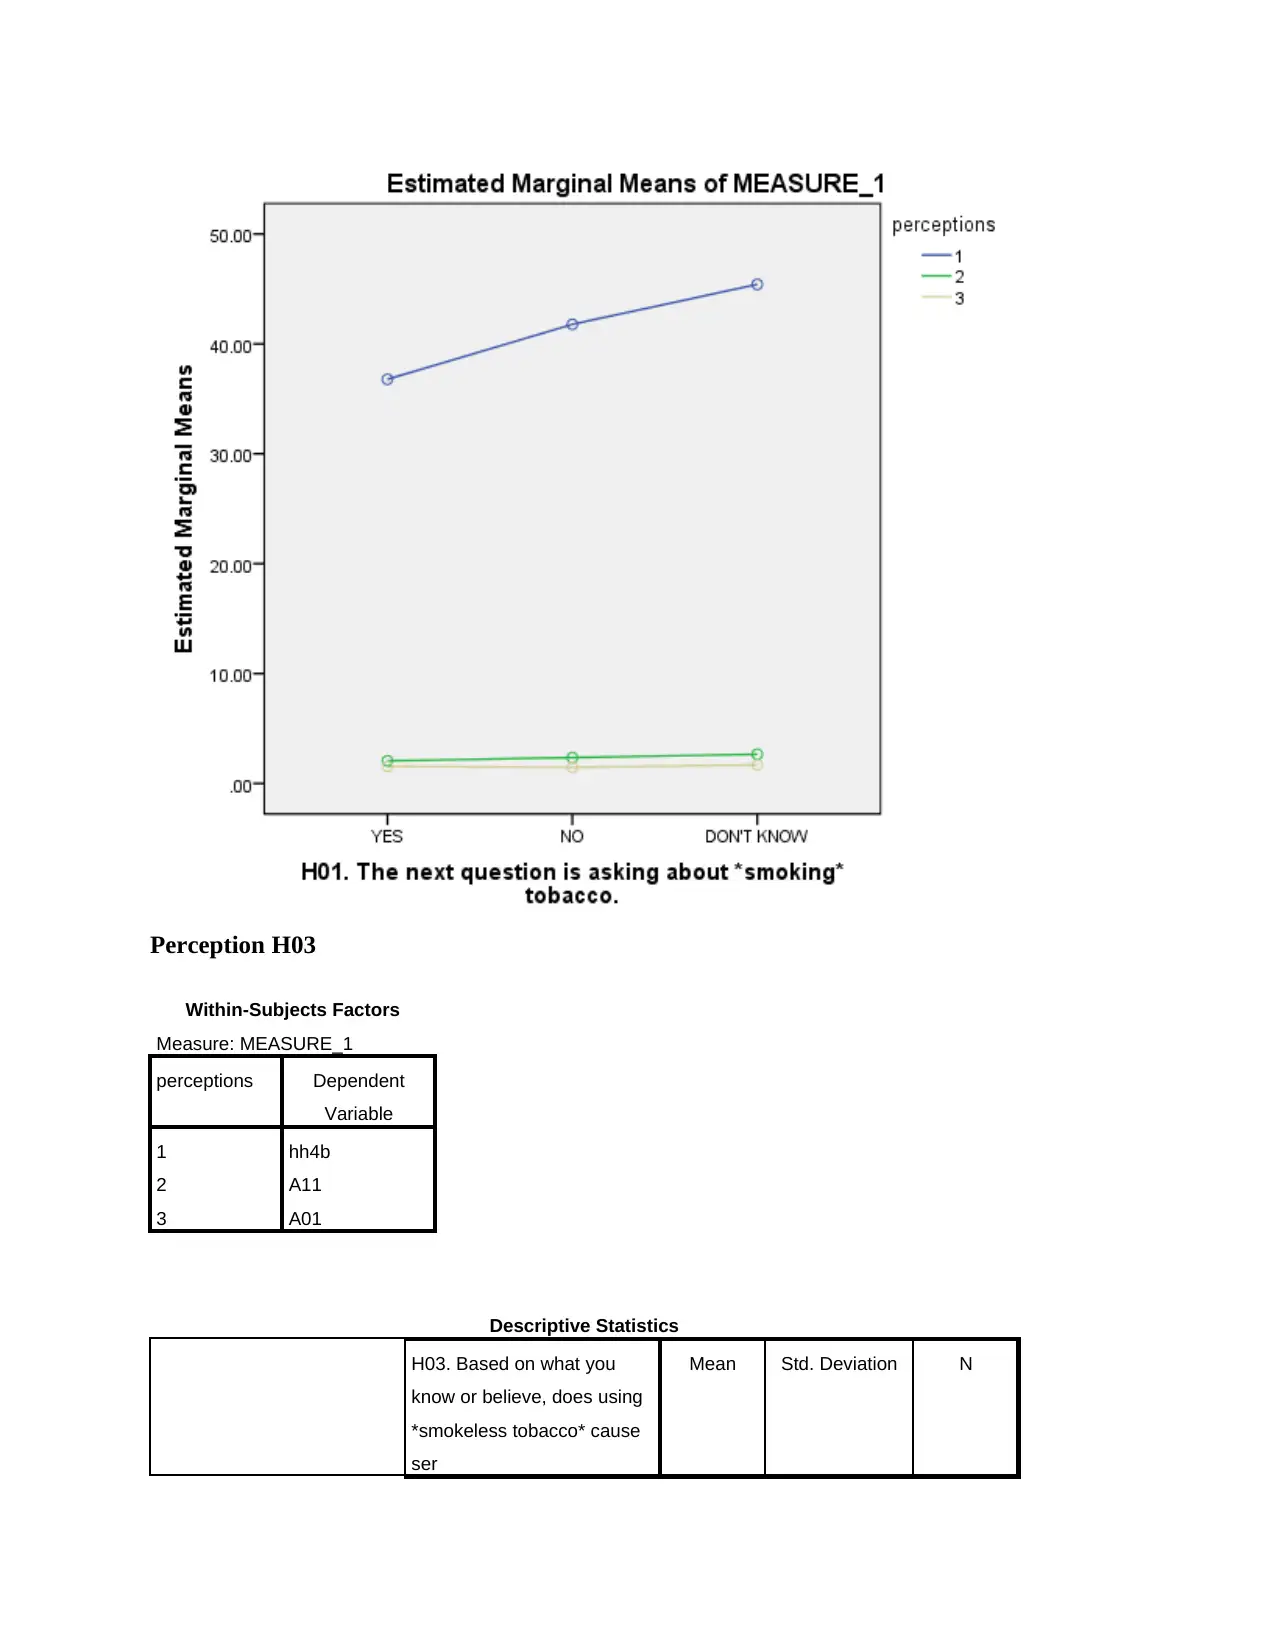
Perception H03
Within-Subjects Factors
Measure: MEASURE_1
perceptions Dependent
Variable
1 hh4b
2 A11
3 A01
Descriptive Statistics
H03. Based on what you
know or believe, does using
*smokeless tobacco* cause
ser
Mean Std. Deviation N
Within-Subjects Factors
Measure: MEASURE_1
perceptions Dependent
Variable
1 hh4b
2 A11
3 A01
Descriptive Statistics
H03. Based on what you
know or believe, does using
*smokeless tobacco* cause
ser
Mean Std. Deviation N
Paraphrase This Document
Need a fresh take? Get an instant paraphrase of this document with our AI Paraphraser
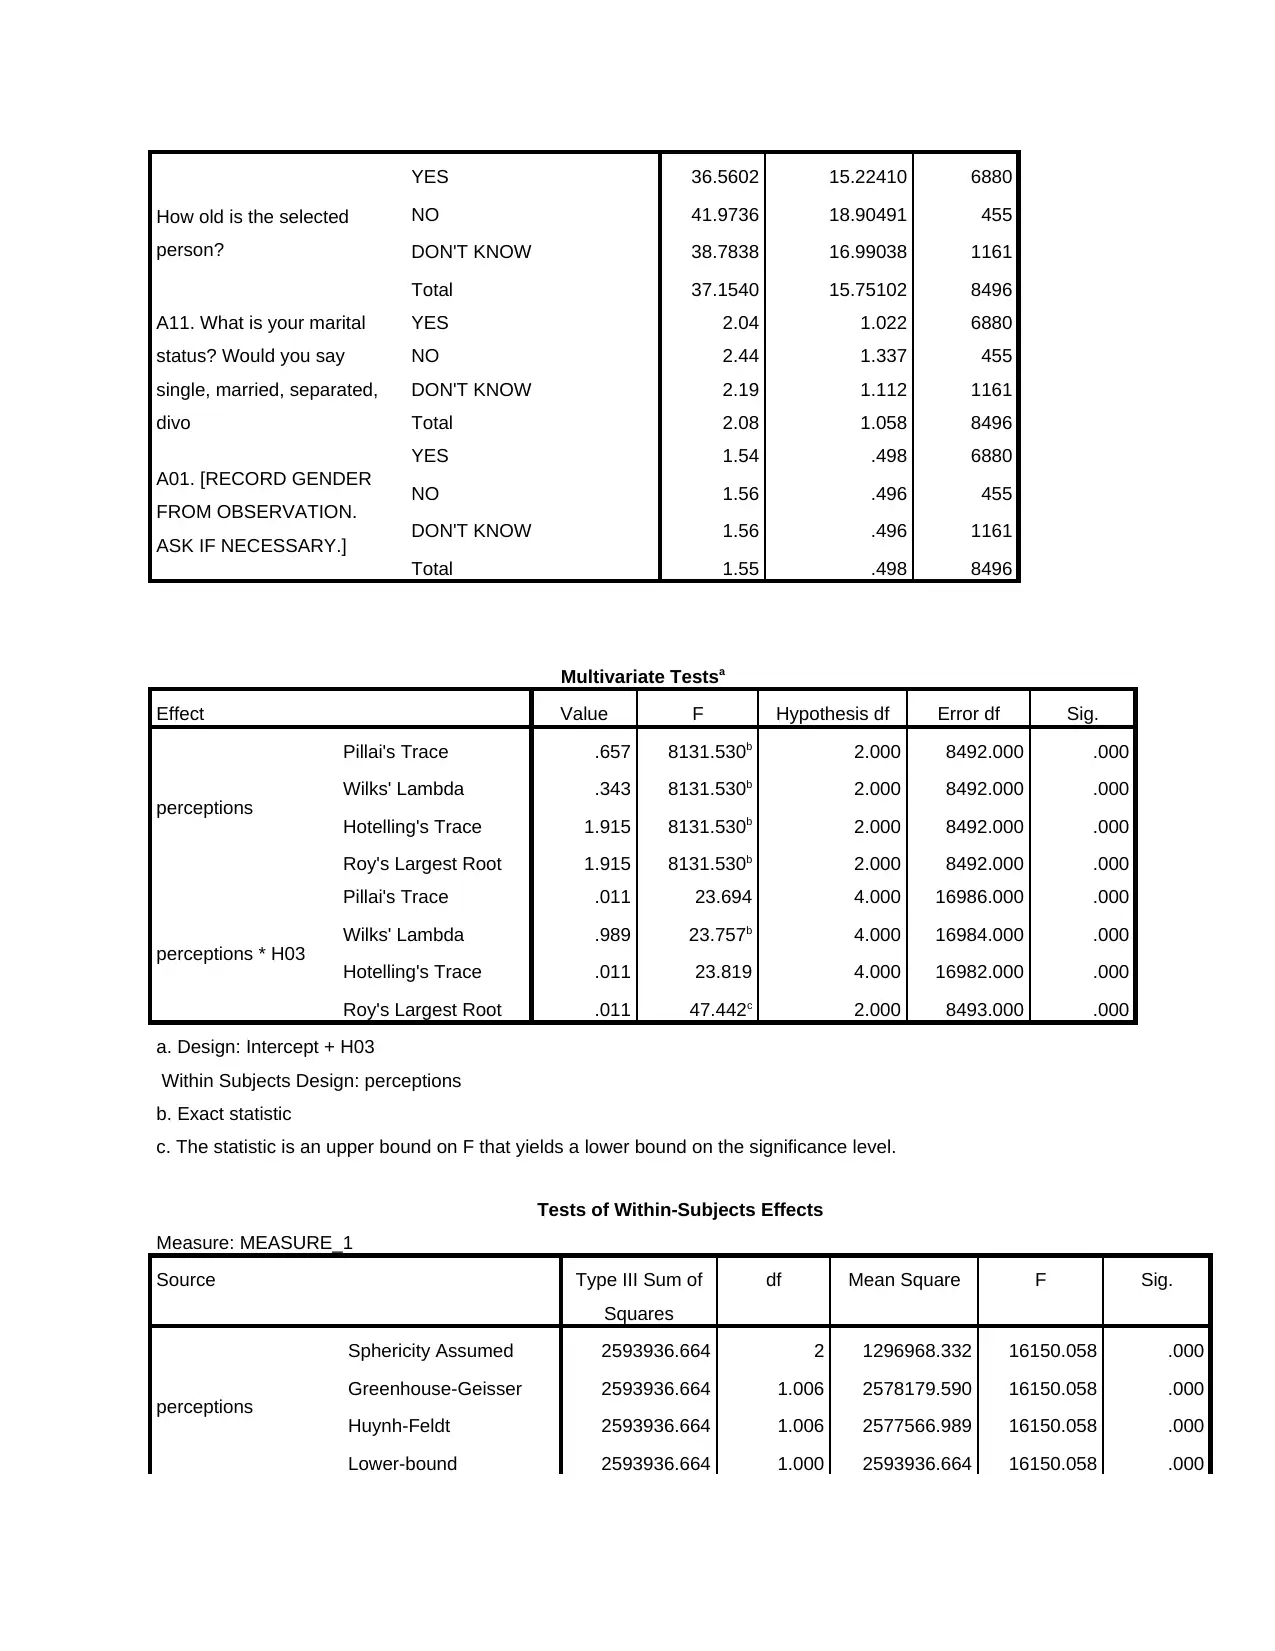
How old is the selected
person?
YES 36.5602 15.22410 6880
NO 41.9736 18.90491 455
DON'T KNOW 38.7838 16.99038 1161
Total 37.1540 15.75102 8496
A11. What is your marital
status? Would you say
single, married, separated,
divo
YES 2.04 1.022 6880
NO 2.44 1.337 455
DON'T KNOW 2.19 1.112 1161
Total 2.08 1.058 8496
A01. [RECORD GENDER
FROM OBSERVATION.
ASK IF NECESSARY.]
YES 1.54 .498 6880
NO 1.56 .496 455
DON'T KNOW 1.56 .496 1161
Total 1.55 .498 8496
Multivariate Testsa
Effect Value F Hypothesis df Error df Sig.
perceptions
Pillai's Trace .657 8131.530b 2.000 8492.000 .000
Wilks' Lambda .343 8131.530b 2.000 8492.000 .000
Hotelling's Trace 1.915 8131.530b 2.000 8492.000 .000
Roy's Largest Root 1.915 8131.530b 2.000 8492.000 .000
perceptions * H03
Pillai's Trace .011 23.694 4.000 16986.000 .000
Wilks' Lambda .989 23.757b 4.000 16984.000 .000
Hotelling's Trace .011 23.819 4.000 16982.000 .000
Roy's Largest Root .011 47.442c 2.000 8493.000 .000
a. Design: Intercept + H03
Within Subjects Design: perceptions
b. Exact statistic
c. The statistic is an upper bound on F that yields a lower bound on the significance level.
Tests of Within-Subjects Effects
Measure: MEASURE_1
Source Type III Sum of
Squares
df Mean Square F Sig.
perceptions
Sphericity Assumed 2593936.664 2 1296968.332 16150.058 .000
Greenhouse-Geisser 2593936.664 1.006 2578179.590 16150.058 .000
Huynh-Feldt 2593936.664 1.006 2577566.989 16150.058 .000
Lower-bound 2593936.664 1.000 2593936.664 16150.058 .000
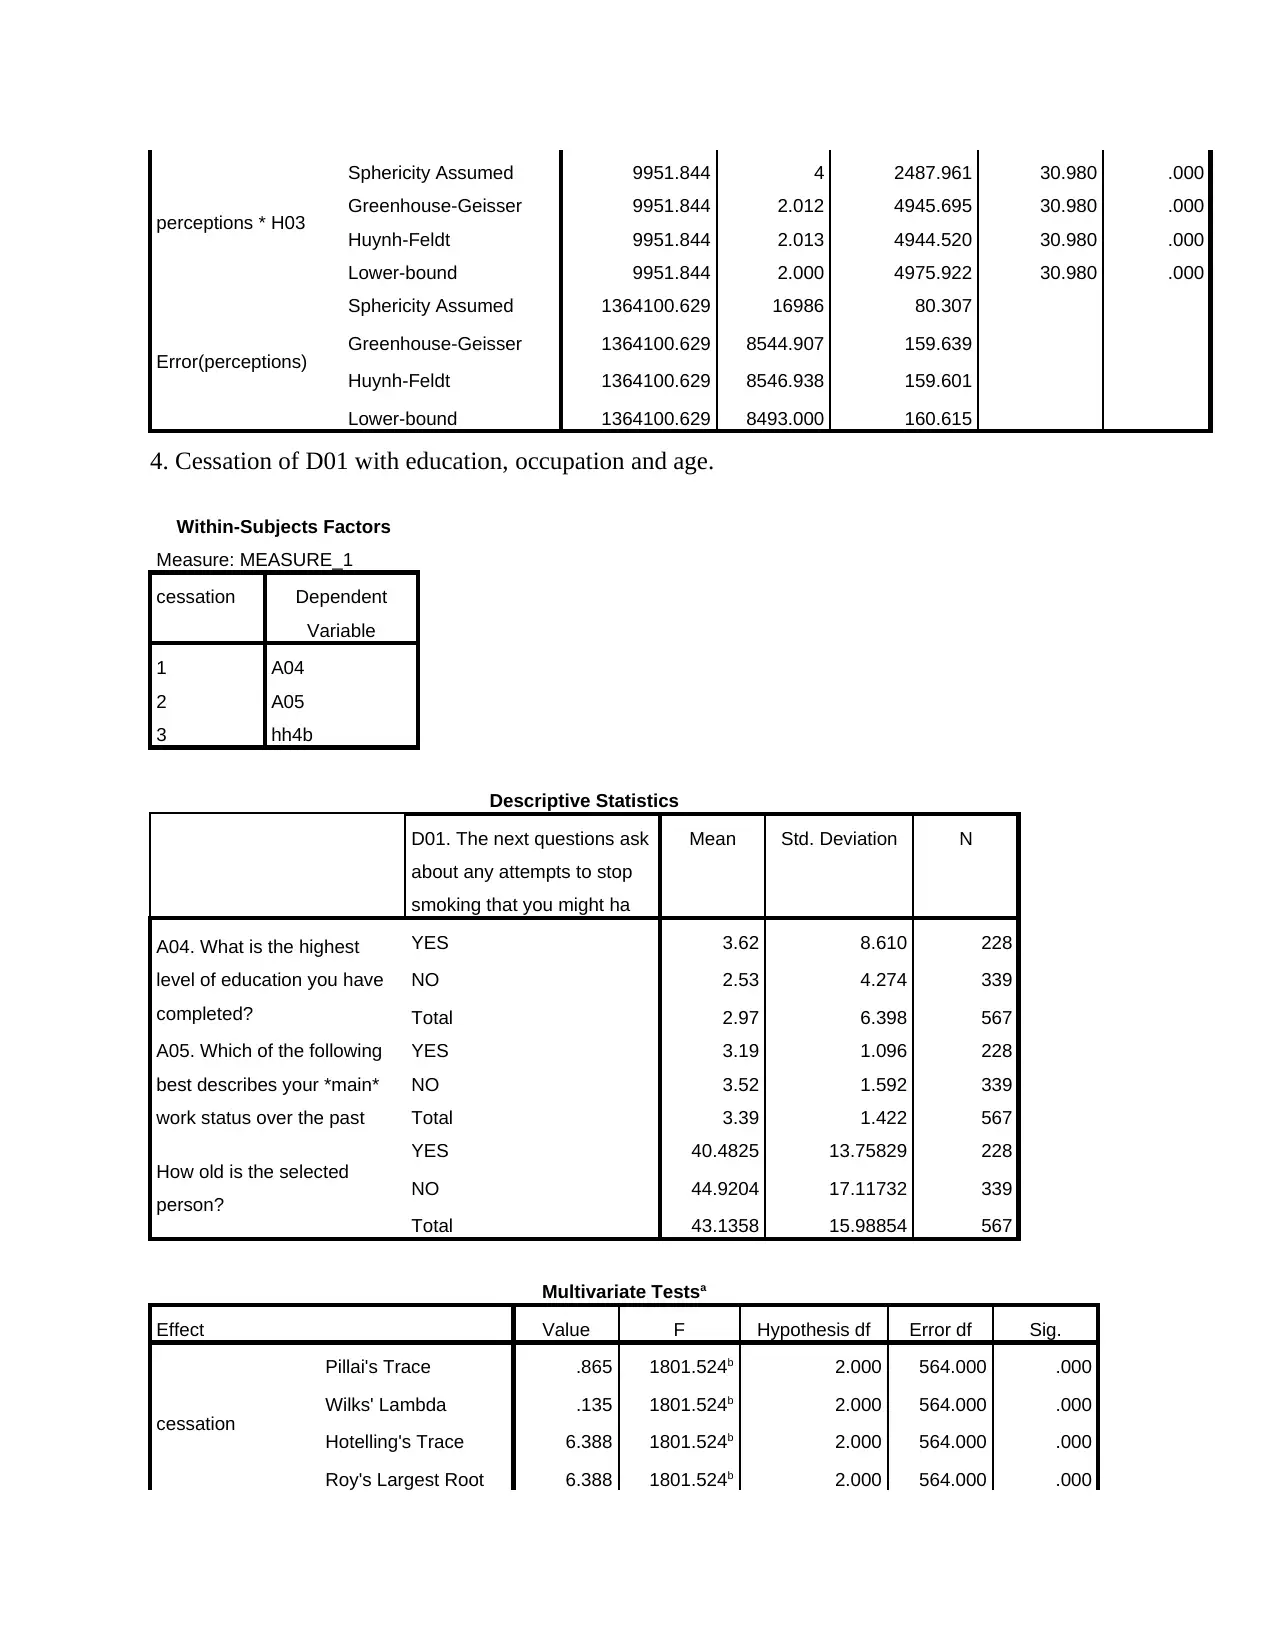
perceptions * H03
Sphericity Assumed 9951.844 4 2487.961 30.980 .000
Greenhouse-Geisser 9951.844 2.012 4945.695 30.980 .000
Huynh-Feldt 9951.844 2.013 4944.520 30.980 .000
Lower-bound 9951.844 2.000 4975.922 30.980 .000
Error(perceptions)
Sphericity Assumed 1364100.629 16986 80.307
Greenhouse-Geisser 1364100.629 8544.907 159.639
Huynh-Feldt 1364100.629 8546.938 159.601
Lower-bound 1364100.629 8493.000 160.615
4. Cessation of D01 with education, occupation and age.
Within-Subjects Factors
Measure: MEASURE_1
cessation Dependent
Variable
1 A04
2 A05
3 hh4b
Descriptive Statistics
D01. The next questions ask
about any attempts to stop
smoking that you might ha
Mean Std. Deviation N
A04. What is the highest
level of education you have
completed?
YES 3.62 8.610 228
NO 2.53 4.274 339
Total 2.97 6.398 567
A05. Which of the following
best describes your *main*
work status over the past
YES 3.19 1.096 228
NO 3.52 1.592 339
Total 3.39 1.422 567
How old is the selected
person?
YES 40.4825 13.75829 228
NO 44.9204 17.11732 339
Total 43.1358 15.98854 567
Multivariate Testsa
Effect Value F Hypothesis df Error df Sig.
cessation
Pillai's Trace .865 1801.524b 2.000 564.000 .000
Wilks' Lambda .135 1801.524b 2.000 564.000 .000
Hotelling's Trace 6.388 1801.524b 2.000 564.000 .000
Roy's Largest Root 6.388 1801.524b 2.000 564.000 .000
⊘ This is a preview!⊘
Do you want full access?
Subscribe today to unlock all pages.
Trusted by 1+ million students worldwide
1 out of 14
Related Documents


Your All-in-One AI-Powered Toolkit for Academic Success.
+13062052269
info@desklib.com
Available 24*7 on WhatsApp / Email
![[object Object]](/_next/static/media/star-bottom.7253800d.svg)
Unlock your academic potential
Copyright © 2020–2026 A2Z Services. All Rights Reserved. Developed and managed by ZUCOL.