Tom and Jerry Ltd: Financial Analysis and Investment Appraisal
VerifiedAdded on 2023/06/16
|17
|3839
|64
Project
AI Summary
This project provides a comprehensive financial analysis of Tom and Jerry Ltd, including an income statement and balance sheet analysis. It delves into investment appraisal techniques such as payback period, accounting rate of return (ARR), and net present value (NPV) calculations, offering a recommendation based on the analysis. The project also explores break-even point analysis, margin of safety, and the impact of advertising strategies on profitability. Furthermore, it discusses the merits and limitations of various investment appraisal techniques and the benefits and limitations of using budgets as a strategic planning tool. The document concludes with a detailed examination of the assumptions underlying the break-even model and their practical applicability across different business contexts.

PROJECT
Paraphrase This Document
Need a fresh take? Get an instant paraphrase of this document with our AI Paraphraser
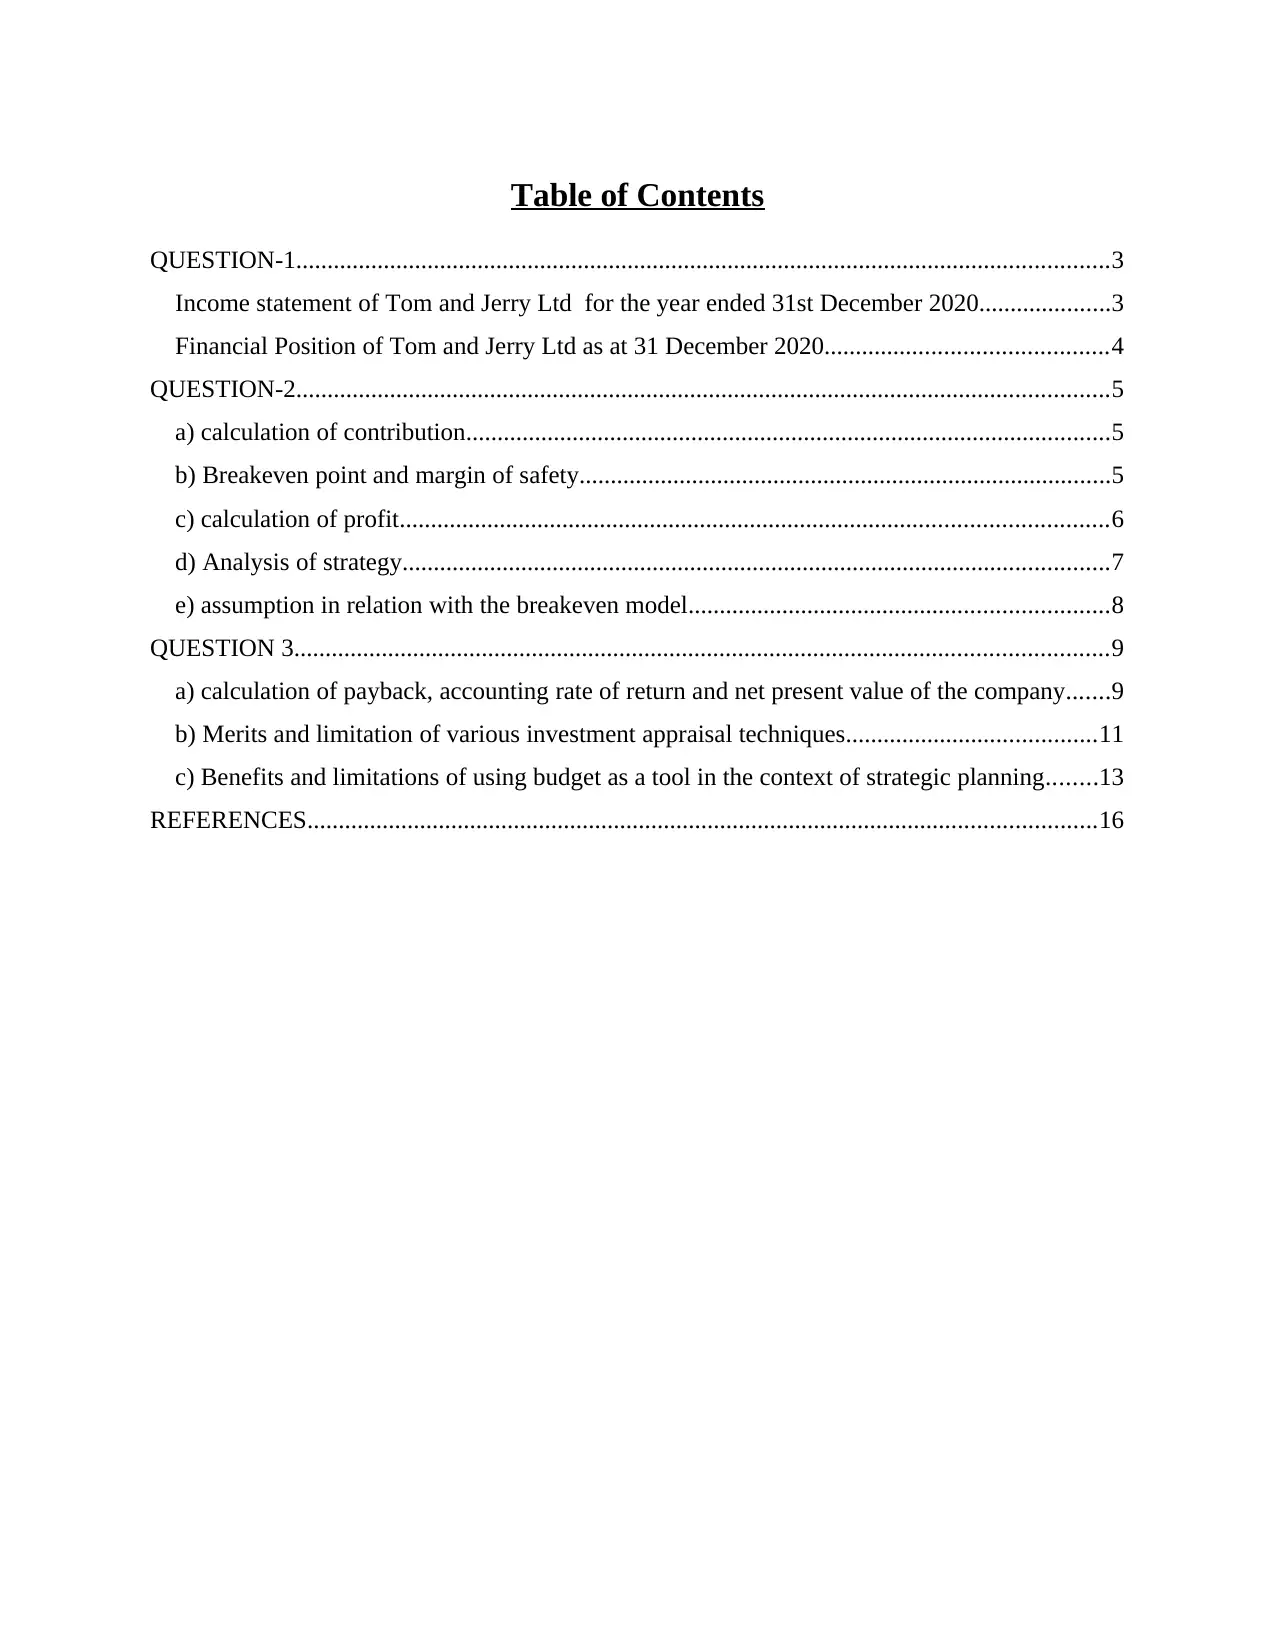
Table of Contents
QUESTION-1..................................................................................................................................3
Income statement of Tom and Jerry Ltd for the year ended 31st December 2020.....................3
Financial Position of Tom and Jerry Ltd as at 31 December 2020.............................................4
QUESTION-2..................................................................................................................................5
a) calculation of contribution.......................................................................................................5
b) Breakeven point and margin of safety.....................................................................................5
c) calculation of profit.................................................................................................................6
d) Analysis of strategy.................................................................................................................7
e) assumption in relation with the breakeven model...................................................................8
QUESTION 3..................................................................................................................................9
a) calculation of payback, accounting rate of return and net present value of the company.......9
b) Merits and limitation of various investment appraisal techniques........................................11
c) Benefits and limitations of using budget as a tool in the context of strategic planning........13
REFERENCES..............................................................................................................................16
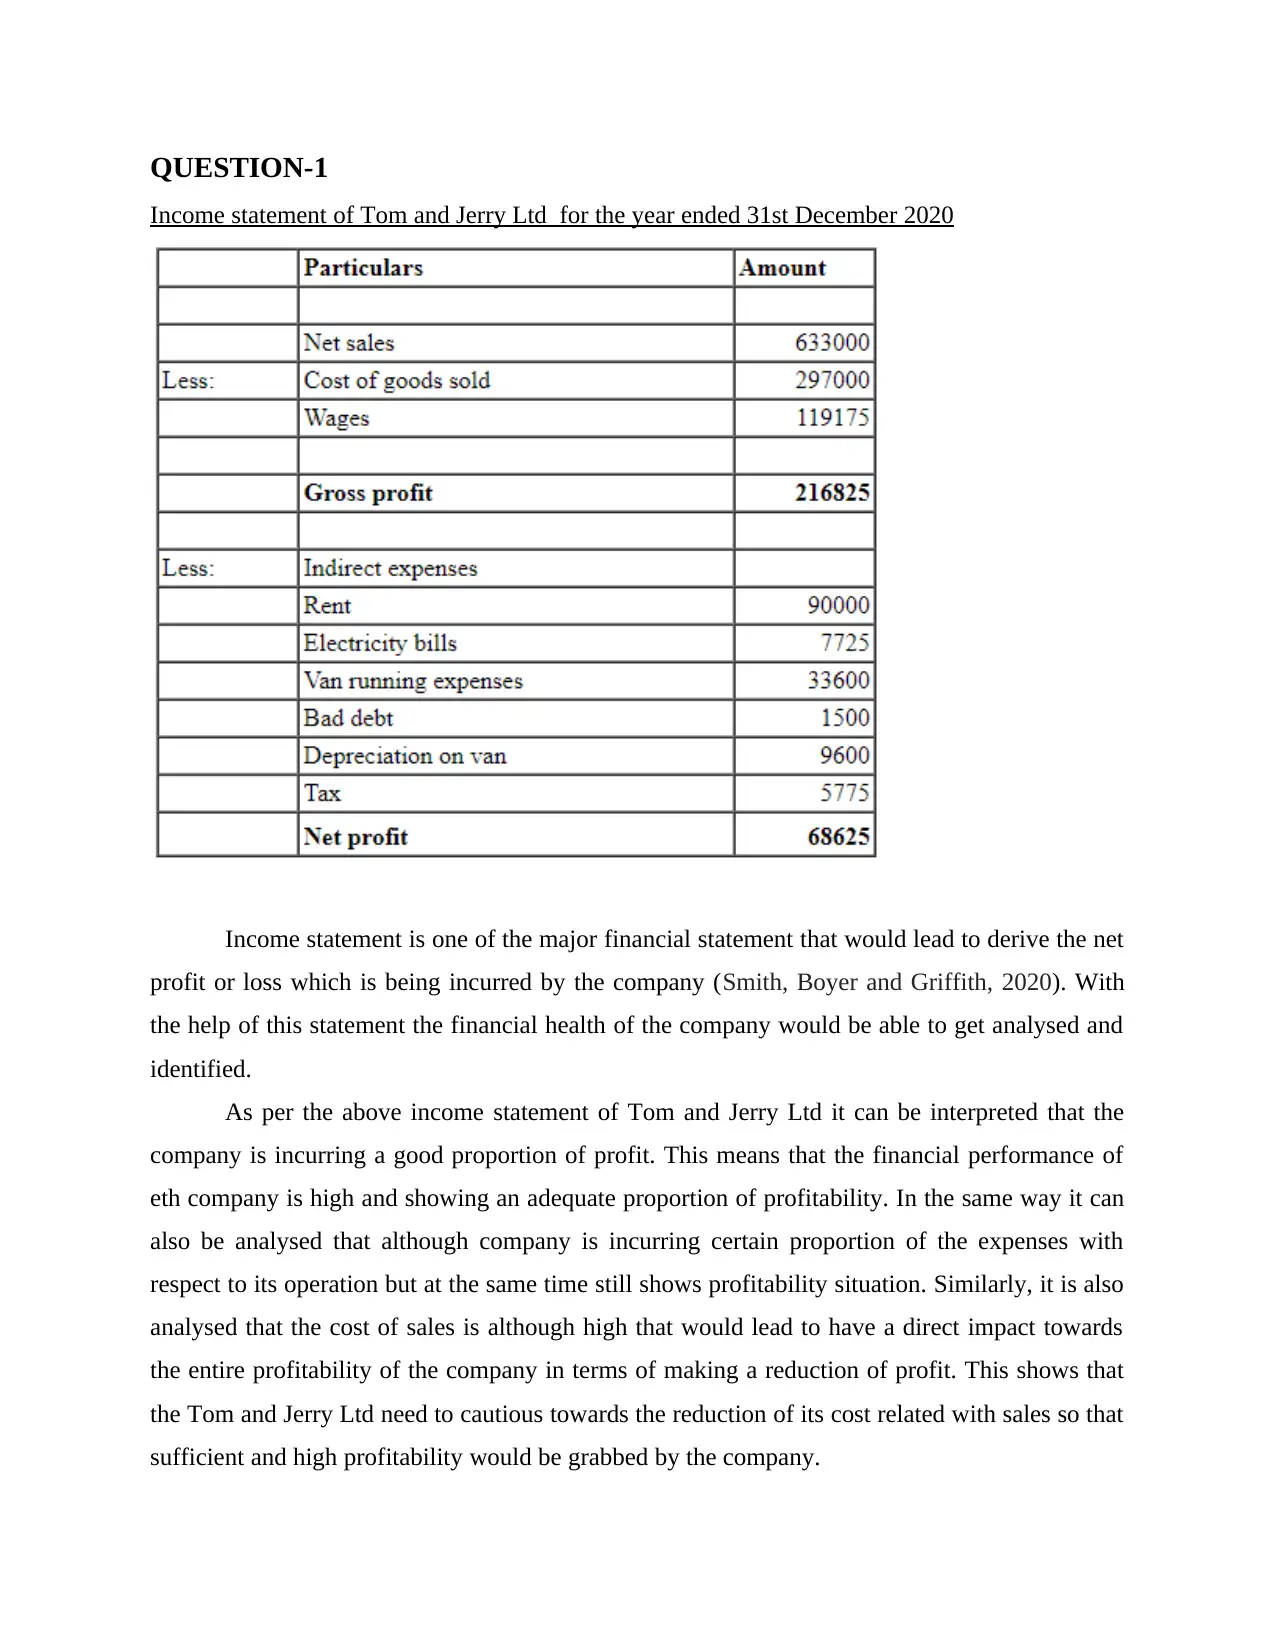
QUESTION-1
Income statement of Tom and Jerry Ltd for the year ended 31st December 2020
Income statement is one of the major financial statement that would lead to derive the net
profit or loss which is being incurred by the company (Smith, Boyer and Griffith, 2020). With
the help of this statement the financial health of the company would be able to get analysed and
identified.
As per the above income statement of Tom and Jerry Ltd it can be interpreted that the
company is incurring a good proportion of profit. This means that the financial performance of
eth company is high and showing an adequate proportion of profitability. In the same way it can
also be analysed that although company is incurring certain proportion of the expenses with
respect to its operation but at the same time still shows profitability situation. Similarly, it is also
analysed that the cost of sales is although high that would lead to have a direct impact towards
the entire profitability of the company in terms of making a reduction of profit. This shows that
the Tom and Jerry Ltd need to cautious towards the reduction of its cost related with sales so that
sufficient and high profitability would be grabbed by the company.
⊘ This is a preview!⊘
Do you want full access?
Subscribe today to unlock all pages.
Trusted by 1+ million students worldwide
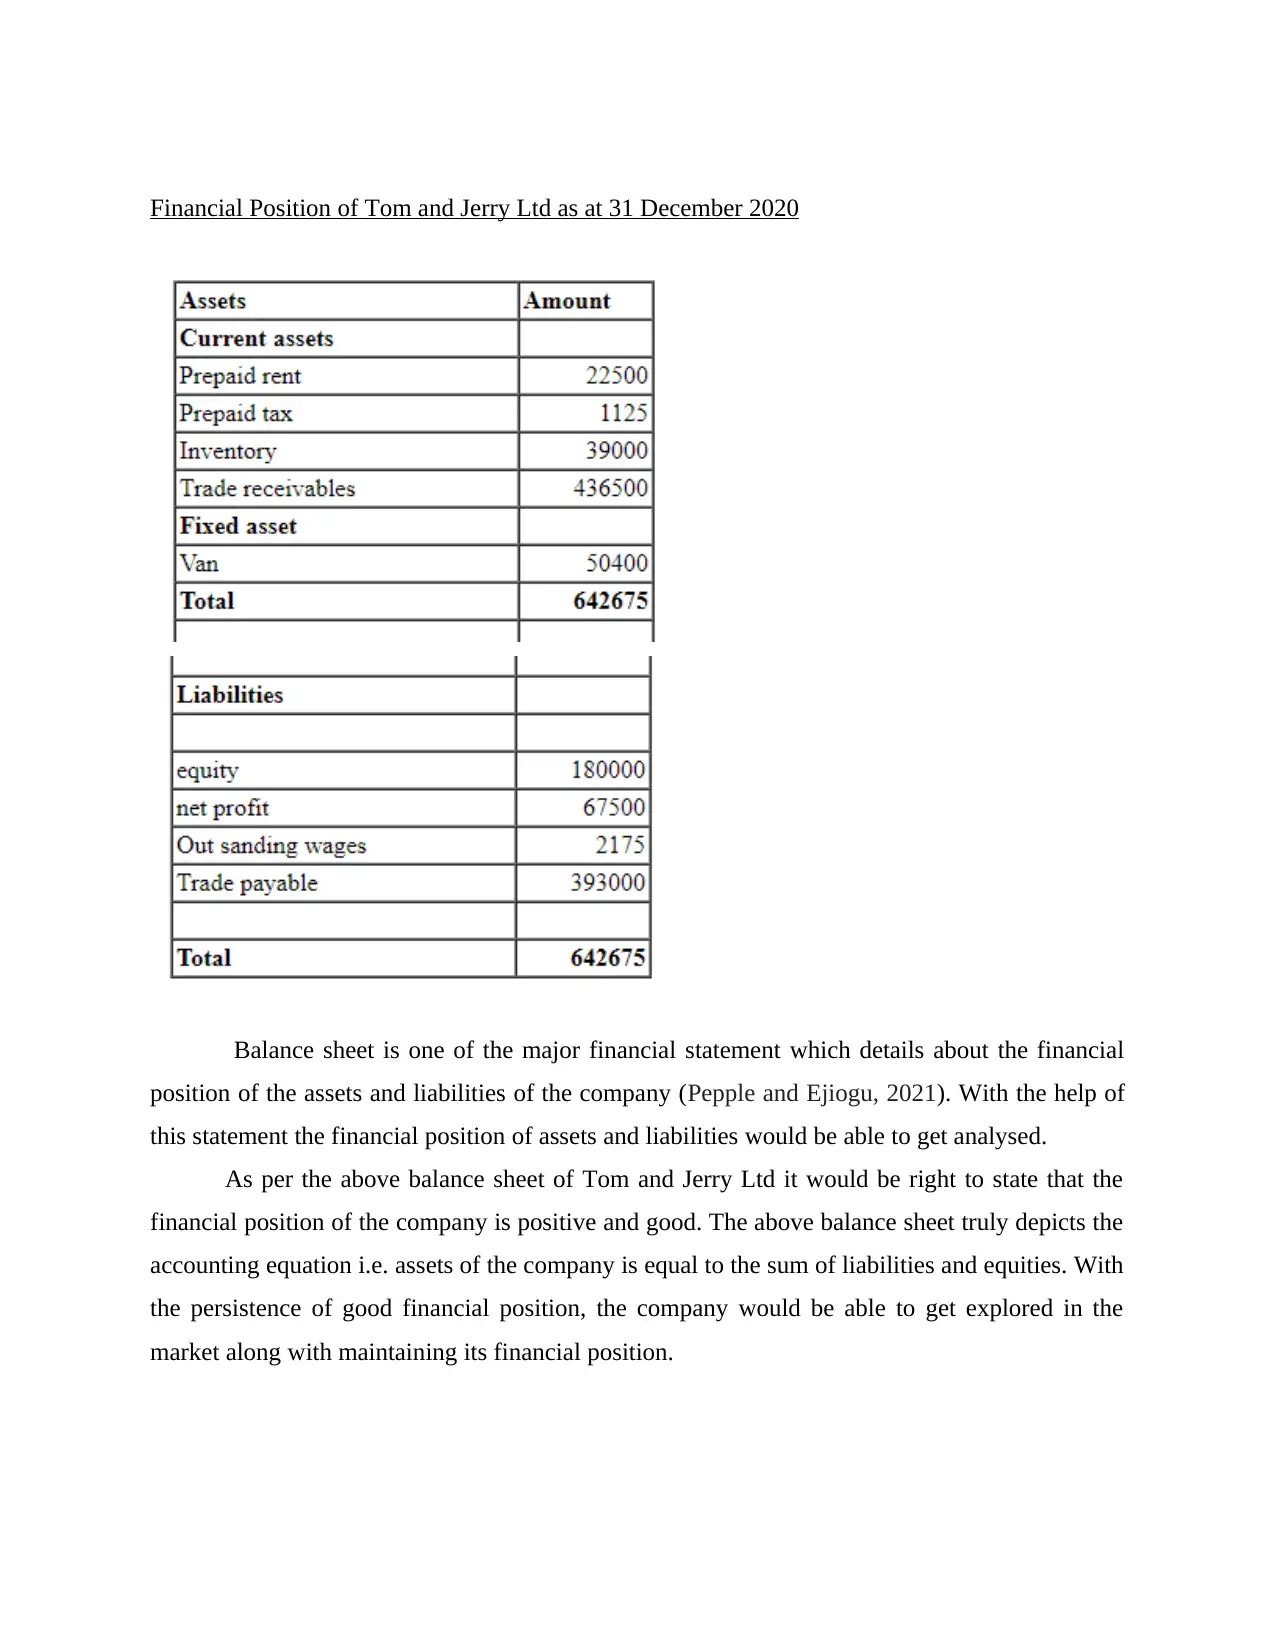
Financial Position of Tom and Jerry Ltd as at 31 December 2020
Balance sheet is one of the major financial statement which details about the financial
position of the assets and liabilities of the company (Pepple and Ejiogu, 2021). With the help of
this statement the financial position of assets and liabilities would be able to get analysed.
As per the above balance sheet of Tom and Jerry Ltd it would be right to state that the
financial position of the company is positive and good. The above balance sheet truly depicts the
accounting equation i.e. assets of the company is equal to the sum of liabilities and equities. With
the persistence of good financial position, the company would be able to get explored in the
market along with maintaining its financial position.
Paraphrase This Document
Need a fresh take? Get an instant paraphrase of this document with our AI Paraphraser
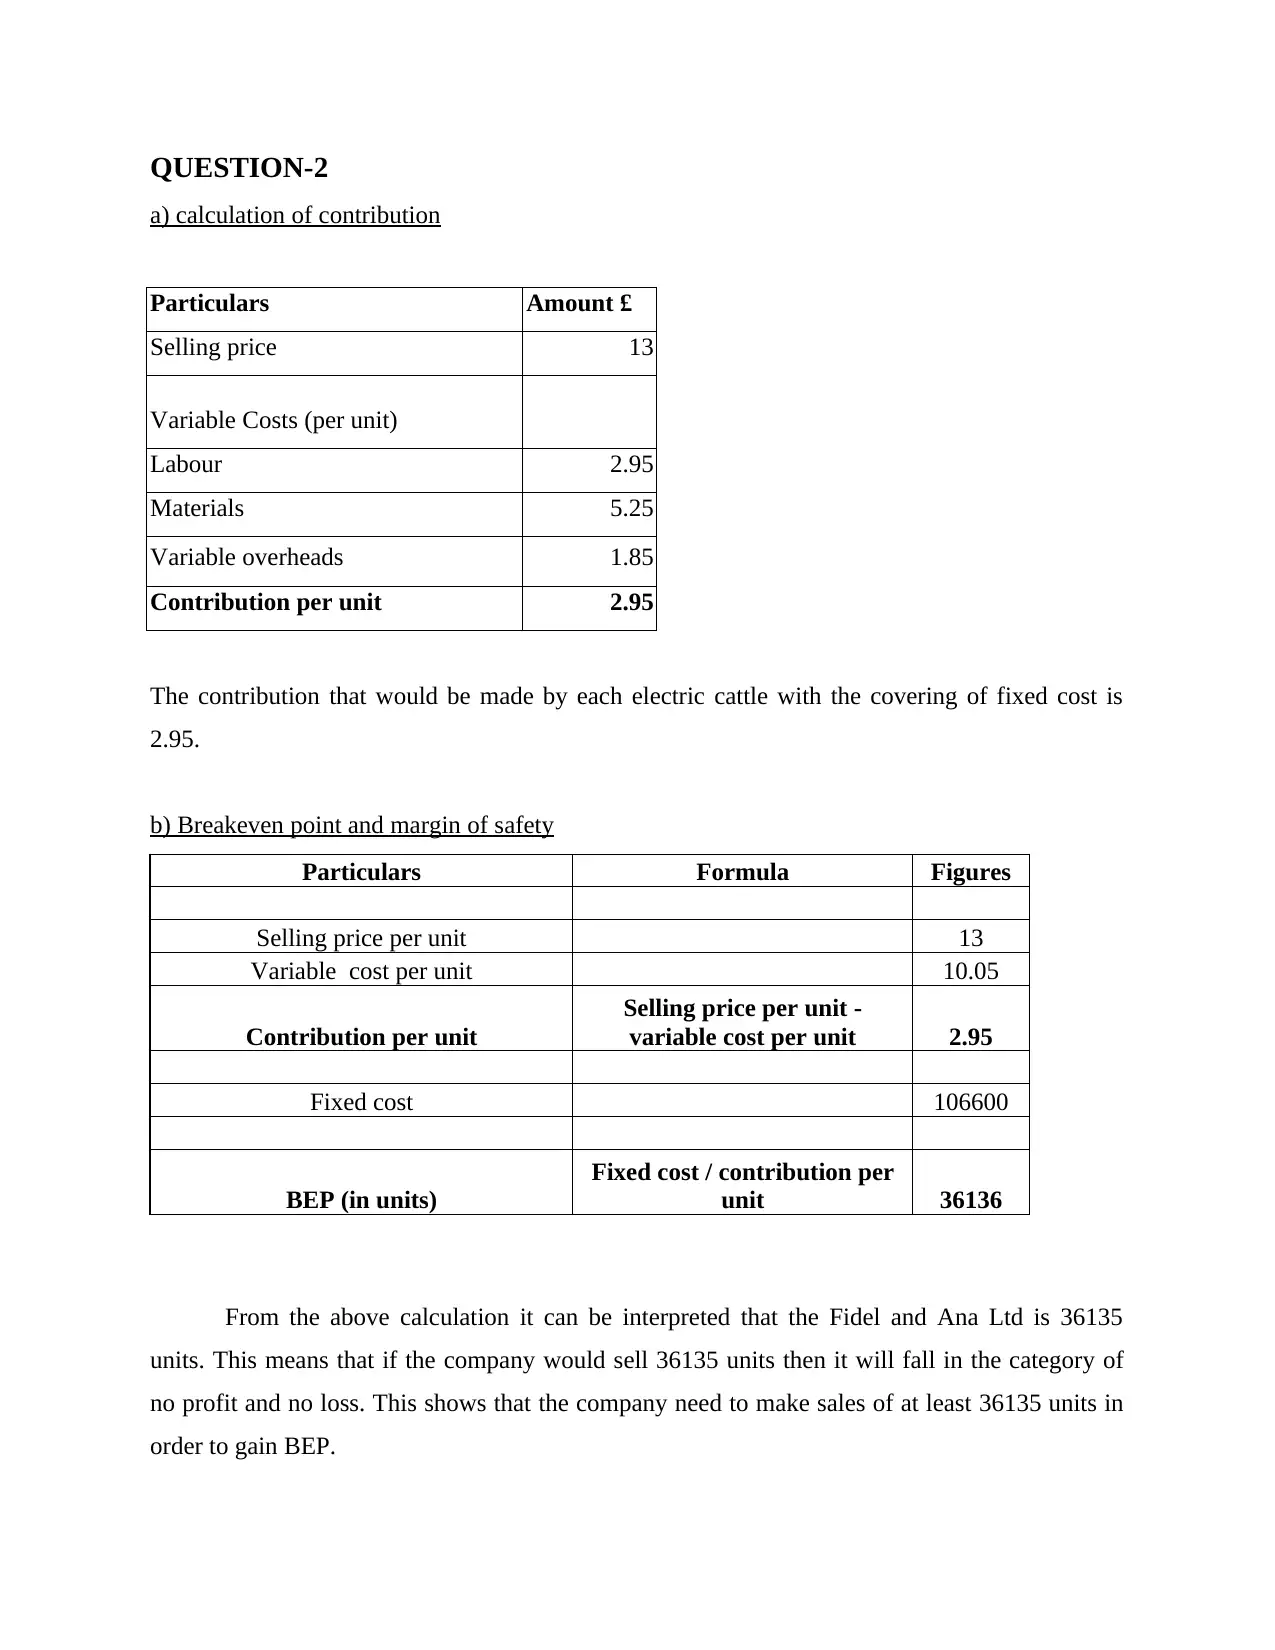
QUESTION-2
a) calculation of contribution
Particulars Amount £
Selling price 13
Variable Costs (per unit)
Labour 2.95
Materials 5.25
Variable overheads 1.85
Contribution per unit 2.95
The contribution that would be made by each electric cattle with the covering of fixed cost is
2.95.
b) Breakeven point and margin of safety
Particulars Formula Figures
Selling price per unit 13
Variable cost per unit 10.05
Contribution per unit
Selling price per unit -
variable cost per unit 2.95
Fixed cost 106600
BEP (in units)
Fixed cost / contribution per
unit 36136
From the above calculation it can be interpreted that the Fidel and Ana Ltd is 36135
units. This means that if the company would sell 36135 units then it will fall in the category of
no profit and no loss. This shows that the company need to make sales of at least 36135 units in
order to gain BEP.
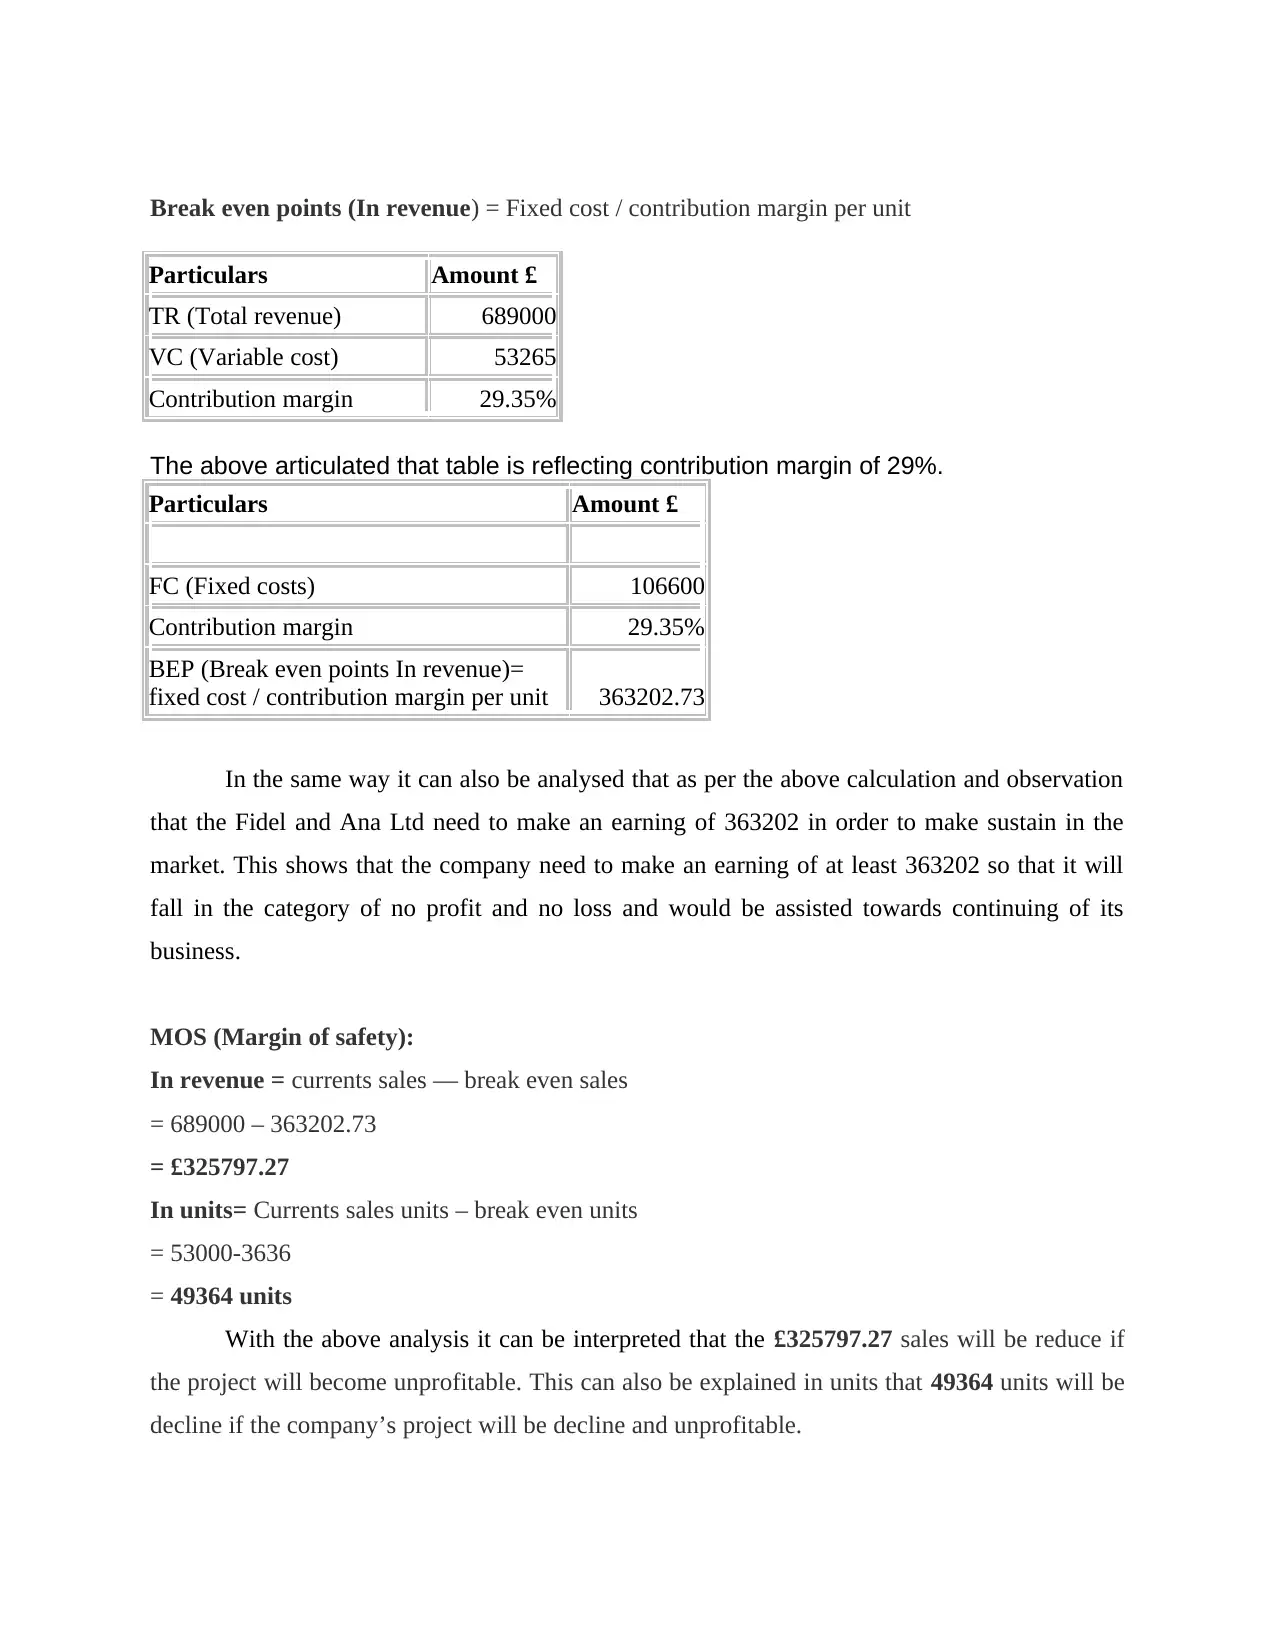
Break even points (In revenue) = Fixed cost / contribution margin per unit
Particulars Amount £
TR (Total revenue) 689000
VC (Variable cost) 53265
Contribution margin 29.35%
The above articulated that table is reflecting contribution margin of 29%.
Particulars Amount £
FC (Fixed costs) 106600
Contribution margin 29.35%
BEP (Break even points In revenue)=
fixed cost / contribution margin per unit 363202.73
In the same way it can also be analysed that as per the above calculation and observation
that the Fidel and Ana Ltd need to make an earning of 363202 in order to make sustain in the
market. This shows that the company need to make an earning of at least 363202 so that it will
fall in the category of no profit and no loss and would be assisted towards continuing of its
business.
MOS (Margin of safety):
In revenue = currents sales — break even sales
= 689000 – 363202.73
= £325797.27
In units= Currents sales units – break even units
= 53000-3636
= 49364 units
With the above analysis it can be interpreted that the £325797.27 sales will be reduce if
the project will become unprofitable. This can also be explained in units that 49364 units will be
decline if the company’s project will be decline and unprofitable.
Particulars Amount £
TR (Total revenue) 689000
VC (Variable cost) 53265
Contribution margin 29.35%
The above articulated that table is reflecting contribution margin of 29%.
Particulars Amount £
FC (Fixed costs) 106600
Contribution margin 29.35%
BEP (Break even points In revenue)=
fixed cost / contribution margin per unit 363202.73
In the same way it can also be analysed that as per the above calculation and observation
that the Fidel and Ana Ltd need to make an earning of 363202 in order to make sustain in the
market. This shows that the company need to make an earning of at least 363202 so that it will
fall in the category of no profit and no loss and would be assisted towards continuing of its
business.
MOS (Margin of safety):
In revenue = currents sales — break even sales
= 689000 – 363202.73
= £325797.27
In units= Currents sales units – break even units
= 53000-3636
= 49364 units
With the above analysis it can be interpreted that the £325797.27 sales will be reduce if
the project will become unprofitable. This can also be explained in units that 49364 units will be
decline if the company’s project will be decline and unprofitable.
⊘ This is a preview!⊘
Do you want full access?
Subscribe today to unlock all pages.
Trusted by 1+ million students worldwide
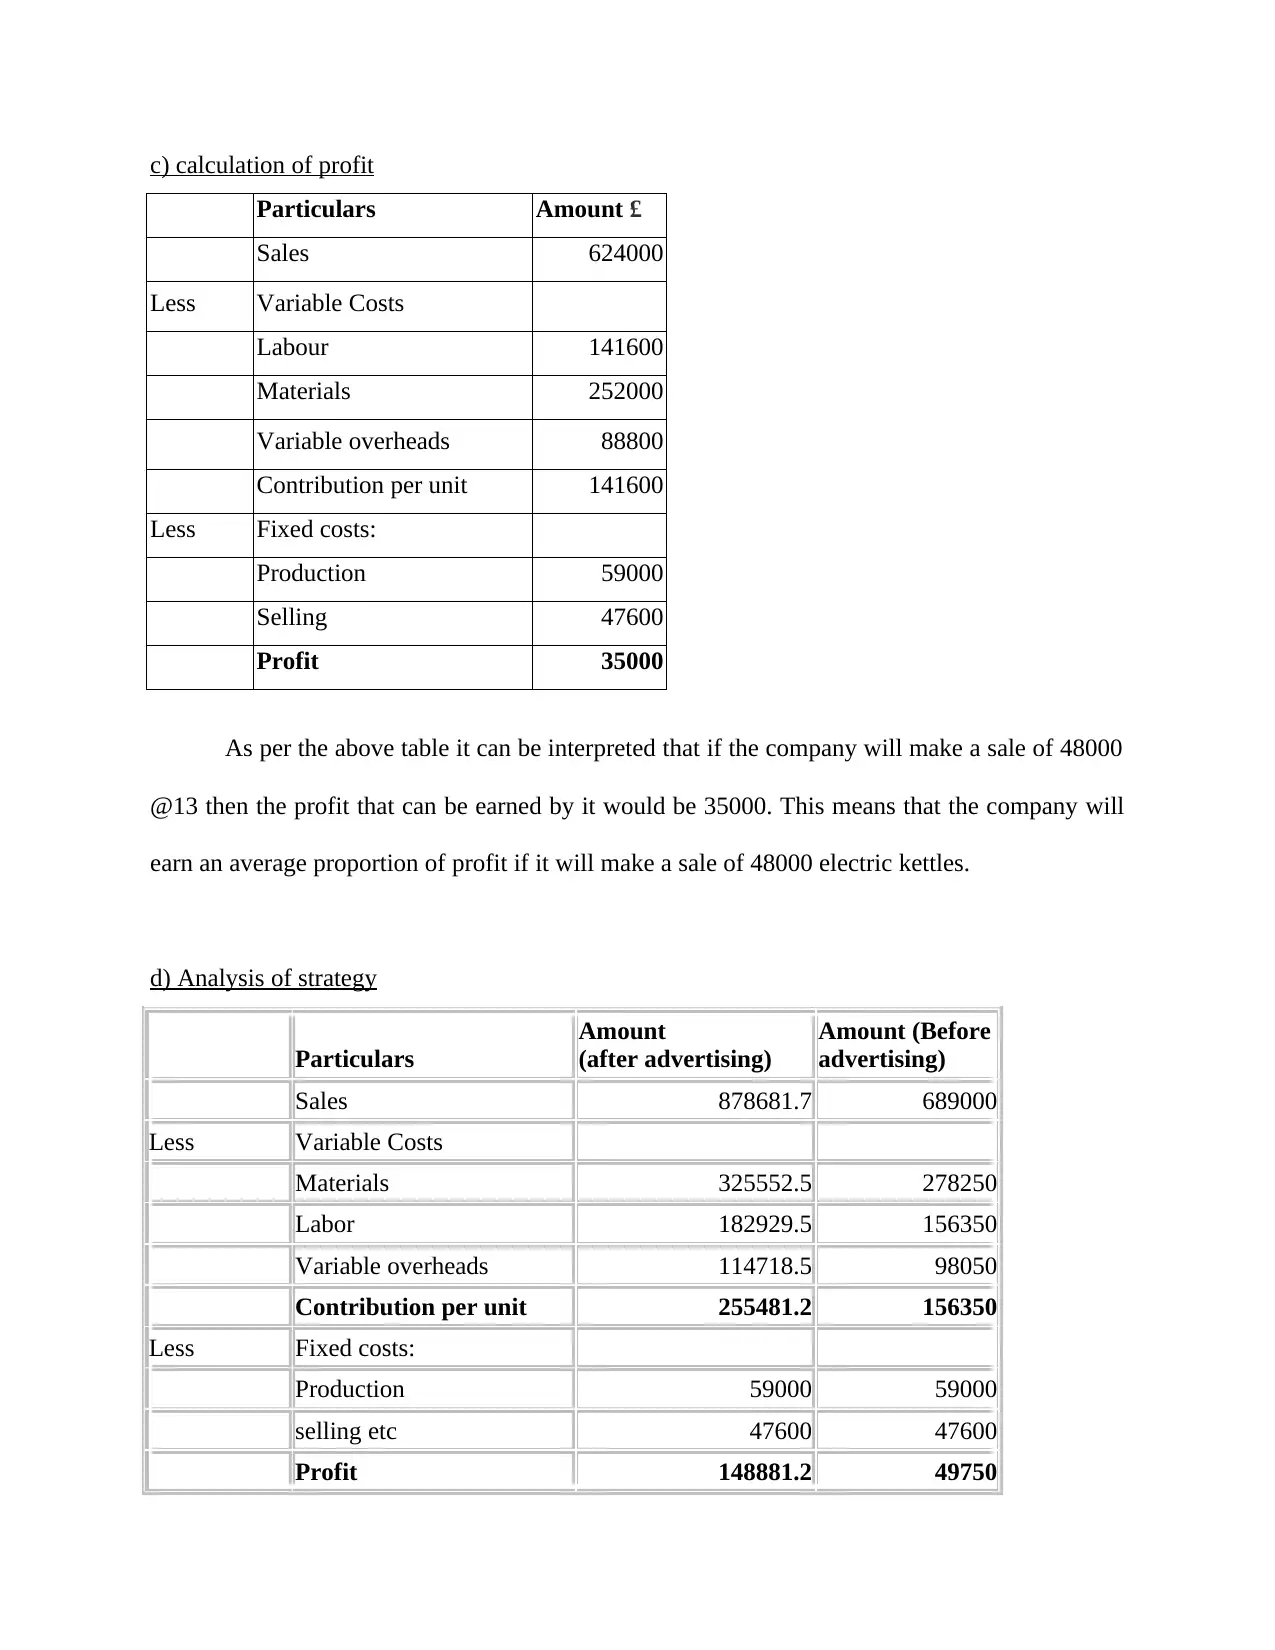
c) calculation of profit
Particulars Amount £
Sales 624000
Less Variable Costs
Labour 141600
Materials 252000
Variable overheads 88800
Contribution per unit 141600
Less Fixed costs:
Production 59000
Selling 47600
Profit 35000
As per the above table it can be interpreted that if the company will make a sale of 48000
@13 then the profit that can be earned by it would be 35000. This means that the company will
earn an average proportion of profit if it will make a sale of 48000 electric kettles.
d) Analysis of strategy
Particulars
Amount
(after advertising)
Amount (Before
advertising)
Sales 878681.7 689000
Less Variable Costs
Materials 325552.5 278250
Labor 182929.5 156350
Variable overheads 114718.5 98050
Contribution per unit 255481.2 156350
Less Fixed costs:
Production 59000 59000
selling etc 47600 47600
Profit 148881.2 49750
Paraphrase This Document
Need a fresh take? Get an instant paraphrase of this document with our AI Paraphraser
e) assumption in relation with the breakeven model
The breakeven analysis refers to that point of sales and aspect within the business that
would assist eth business in terms of analysing the situation of no profit and no loss (Tannen,
2020). This means that it is the unit or the value which if earned by company then it will fall in
the category of no profit and loss.
There are certain assumption which would be made implied in the BEP analysis. These
would include: the fixed cost would remain same with all the level of output, the all other cost
would be counted as either the fixed or the variable, the sales volume is the only aspect that
would affect the cost and sales revenue, other factors including the production, technology,
efficiency would remain unchanged, the business would be considered with the constant product
mix which shows that the company will produce only one type of the product, the sales price
remain constant throughout the level of output, constant inventory at the end of accounting
period and various other (Kostjukova, 2018).
With the persistence of these assumption it would be right to state that this model is not
equally applicable to all the form of business. This is because practically it is not possible that
the cost and aspect of technology would remain same (SHROTRIYA, 2019). Likewise, the
concept that the company would have the same product mix would not be possible because no
company would make the production of only one kind of product. In the same way the aspect the
sales volume would not only have an impact towards the cost and sales revenue because there are
various other factors that may have an impact towards the sales revenue and may impact the
expenses of the company. the assumption that inventory would remain same as per the BEP
model would also not be practically implacable because the value of inventory would remain
fluctuating and not need to be constant throughout the year.
As every business would run and operate in a varied form that would be right to state that
the company’s BEP would not be remain same and its assumption would not remain equally
applicable to every kind of business (Lohmann, 2020). This is because every business has
different working and operational procedure which clearly state that the assumption of the BEP
will not be equally applicable towards every company.
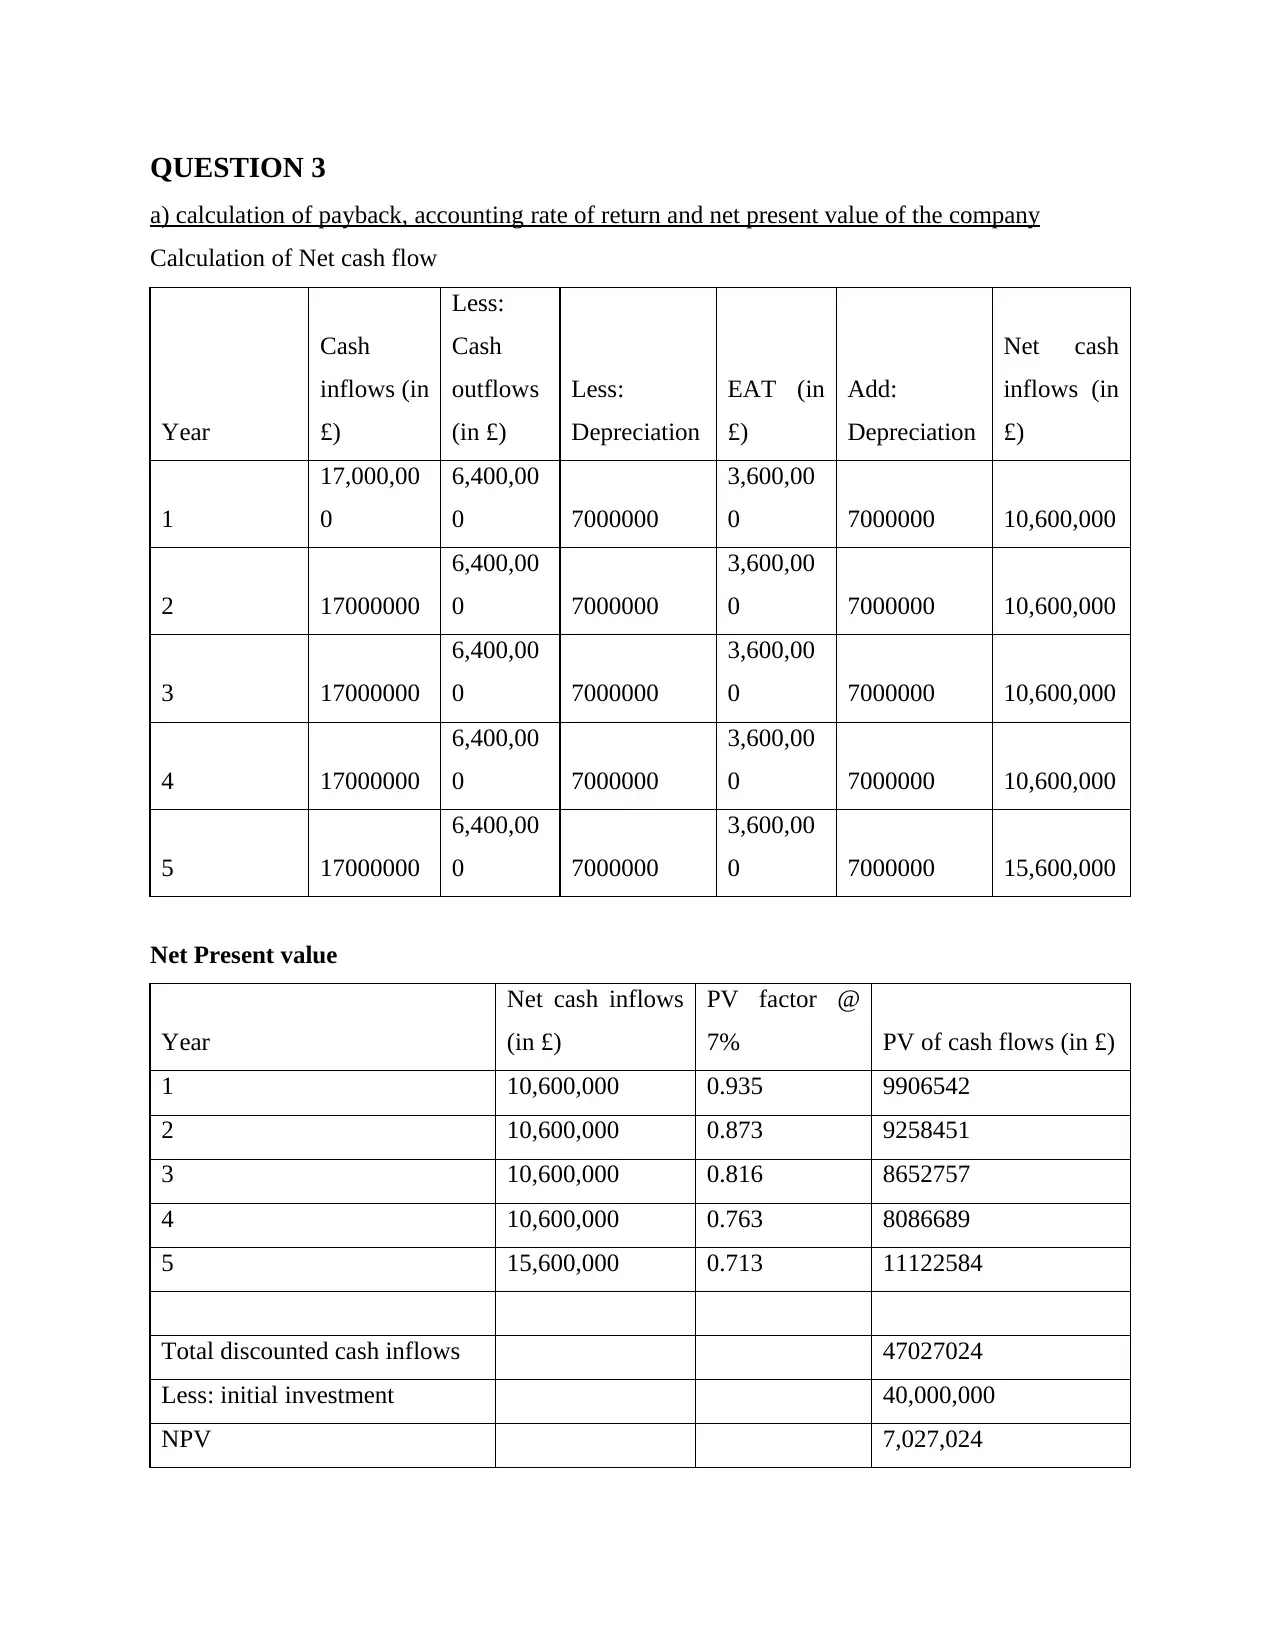
QUESTION 3
a) calculation of payback, accounting rate of return and net present value of the company
Calculation of Net cash flow
Year
Cash
inflows (in
£)
Less:
Cash
outflows
(in £)
Less:
Depreciation
EAT (in
£)
Add:
Depreciation
Net cash
inflows (in
£)
1
17,000,00
0
6,400,00
0 7000000
3,600,00
0 7000000 10,600,000
2 17000000
6,400,00
0 7000000
3,600,00
0 7000000 10,600,000
3 17000000
6,400,00
0 7000000
3,600,00
0 7000000 10,600,000
4 17000000
6,400,00
0 7000000
3,600,00
0 7000000 10,600,000
5 17000000
6,400,00
0 7000000
3,600,00
0 7000000 15,600,000
Net Present value
Year
Net cash inflows
(in £)
PV factor @
7% PV of cash flows (in £)
1 10,600,000 0.935 9906542
2 10,600,000 0.873 9258451
3 10,600,000 0.816 8652757
4 10,600,000 0.763 8086689
5 15,600,000 0.713 11122584
Total discounted cash inflows 47027024
Less: initial investment 40,000,000
NPV 7,027,024
⊘ This is a preview!⊘
Do you want full access?
Subscribe today to unlock all pages.
Trusted by 1+ million students worldwide
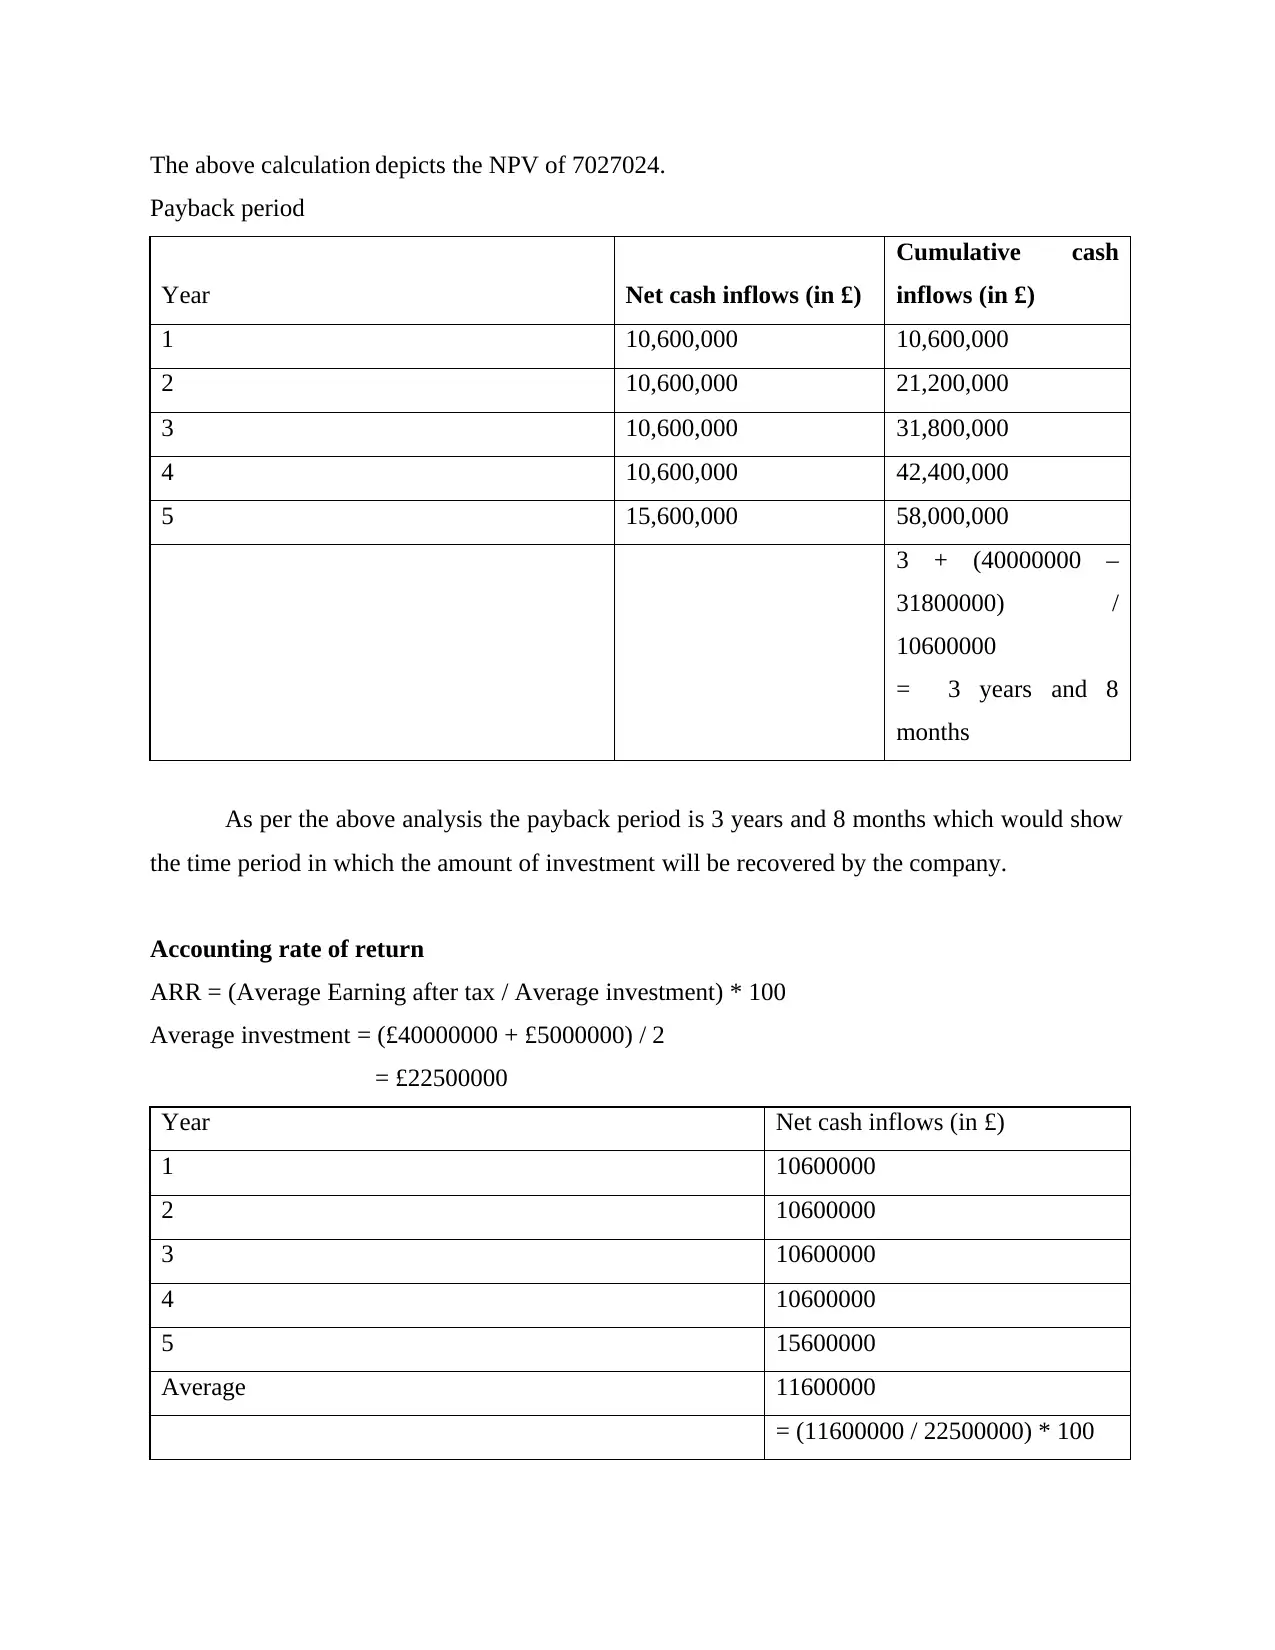
The above calculation depicts the NPV of 7027024.
Payback period
Year Net cash inflows (in £)
Cumulative cash
inflows (in £)
1 10,600,000 10,600,000
2 10,600,000 21,200,000
3 10,600,000 31,800,000
4 10,600,000 42,400,000
5 15,600,000 58,000,000
3 + (40000000 –
31800000) /
10600000
= 3 years and 8
months
As per the above analysis the payback period is 3 years and 8 months which would show
the time period in which the amount of investment will be recovered by the company.
Accounting rate of return
ARR = (Average Earning after tax / Average investment) * 100
Average investment = (£40000000 + £5000000) / 2
= £22500000
Year Net cash inflows (in £)
1 10600000
2 10600000
3 10600000
4 10600000
5 15600000
Average 11600000
= (11600000 / 22500000) * 100
Paraphrase This Document
Need a fresh take? Get an instant paraphrase of this document with our AI Paraphraser
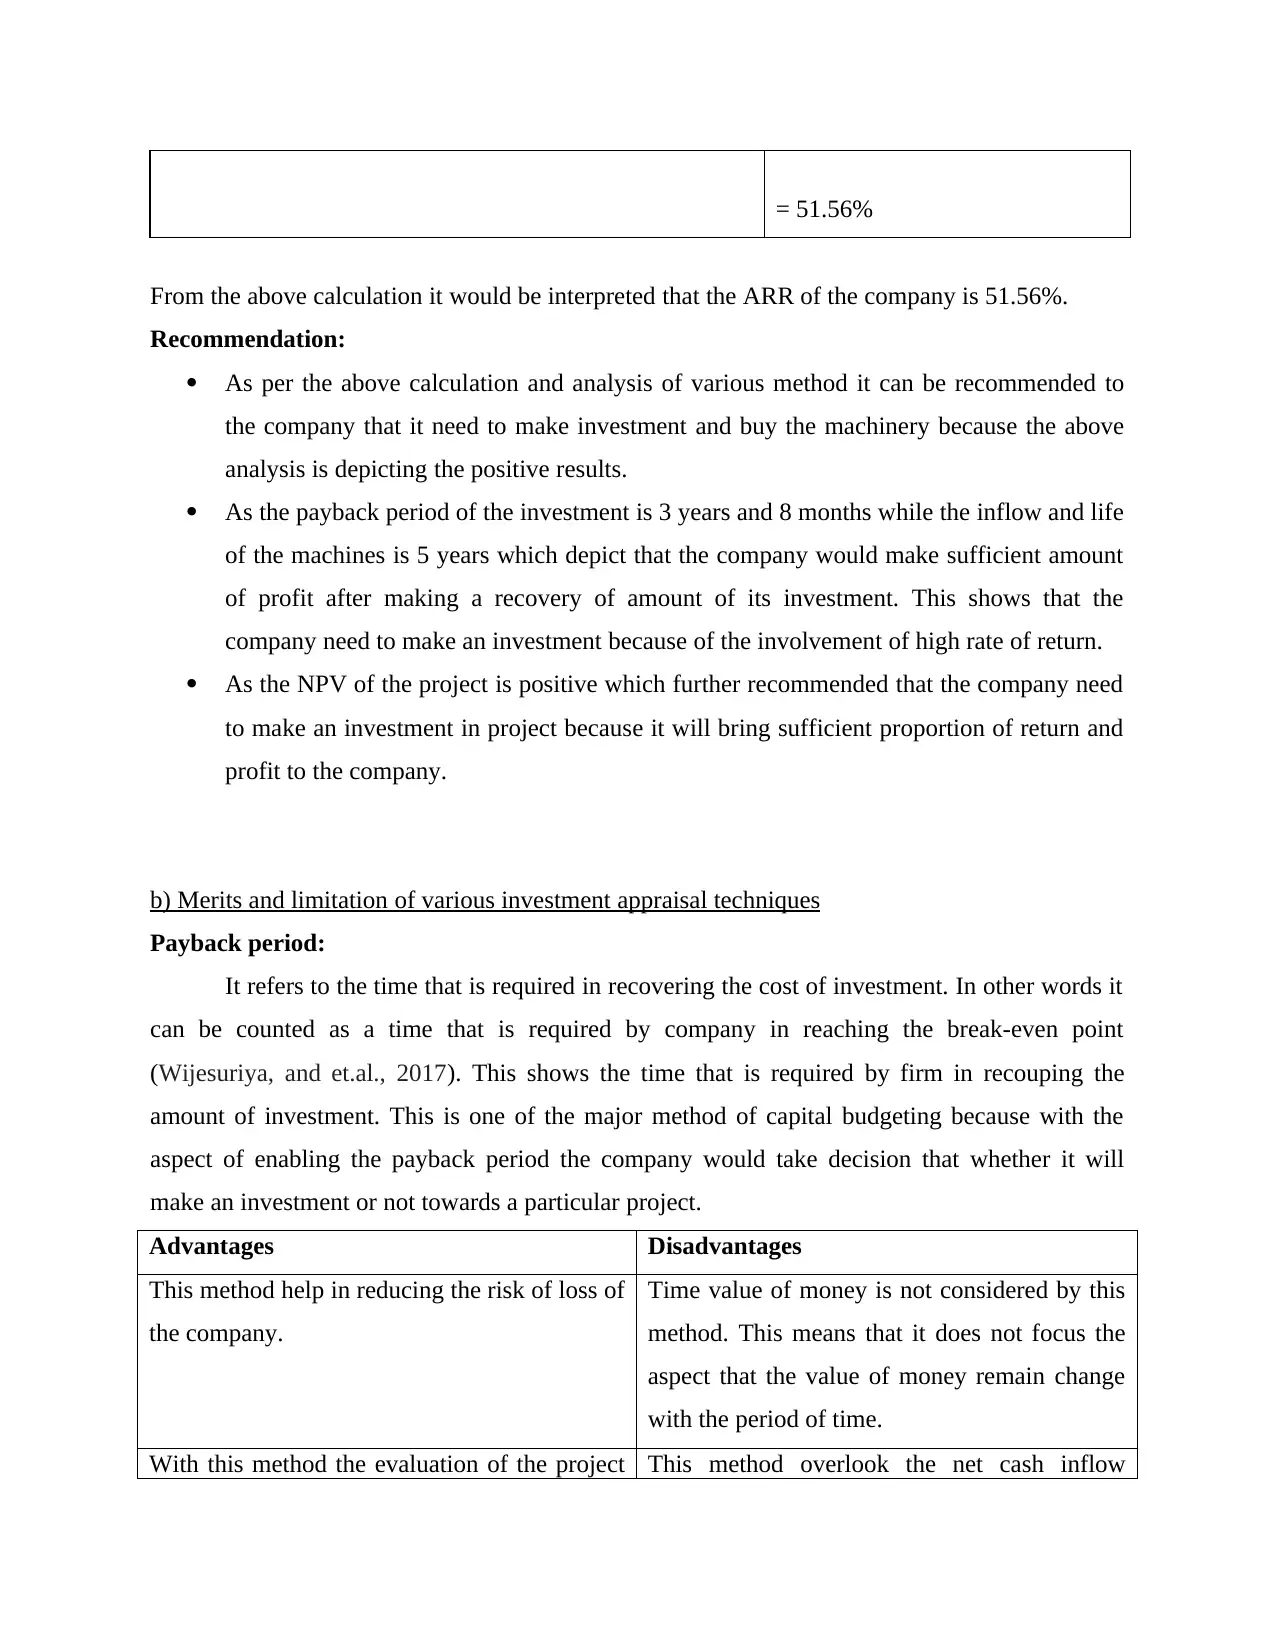
= 51.56%
From the above calculation it would be interpreted that the ARR of the company is 51.56%.
Recommendation:
As per the above calculation and analysis of various method it can be recommended to
the company that it need to make investment and buy the machinery because the above
analysis is depicting the positive results.
As the payback period of the investment is 3 years and 8 months while the inflow and life
of the machines is 5 years which depict that the company would make sufficient amount
of profit after making a recovery of amount of its investment. This shows that the
company need to make an investment because of the involvement of high rate of return.
As the NPV of the project is positive which further recommended that the company need
to make an investment in project because it will bring sufficient proportion of return and
profit to the company.
b) Merits and limitation of various investment appraisal techniques
Payback period:
It refers to the time that is required in recovering the cost of investment. In other words it
can be counted as a time that is required by company in reaching the break-even point
(Wijesuriya, and et.al., 2017). This shows the time that is required by firm in recouping the
amount of investment. This is one of the major method of capital budgeting because with the
aspect of enabling the payback period the company would take decision that whether it will
make an investment or not towards a particular project.
Advantages Disadvantages
This method help in reducing the risk of loss of
the company.
Time value of money is not considered by this
method. This means that it does not focus the
aspect that the value of money remain change
with the period of time.
With this method the evaluation of the project This method overlook the net cash inflow
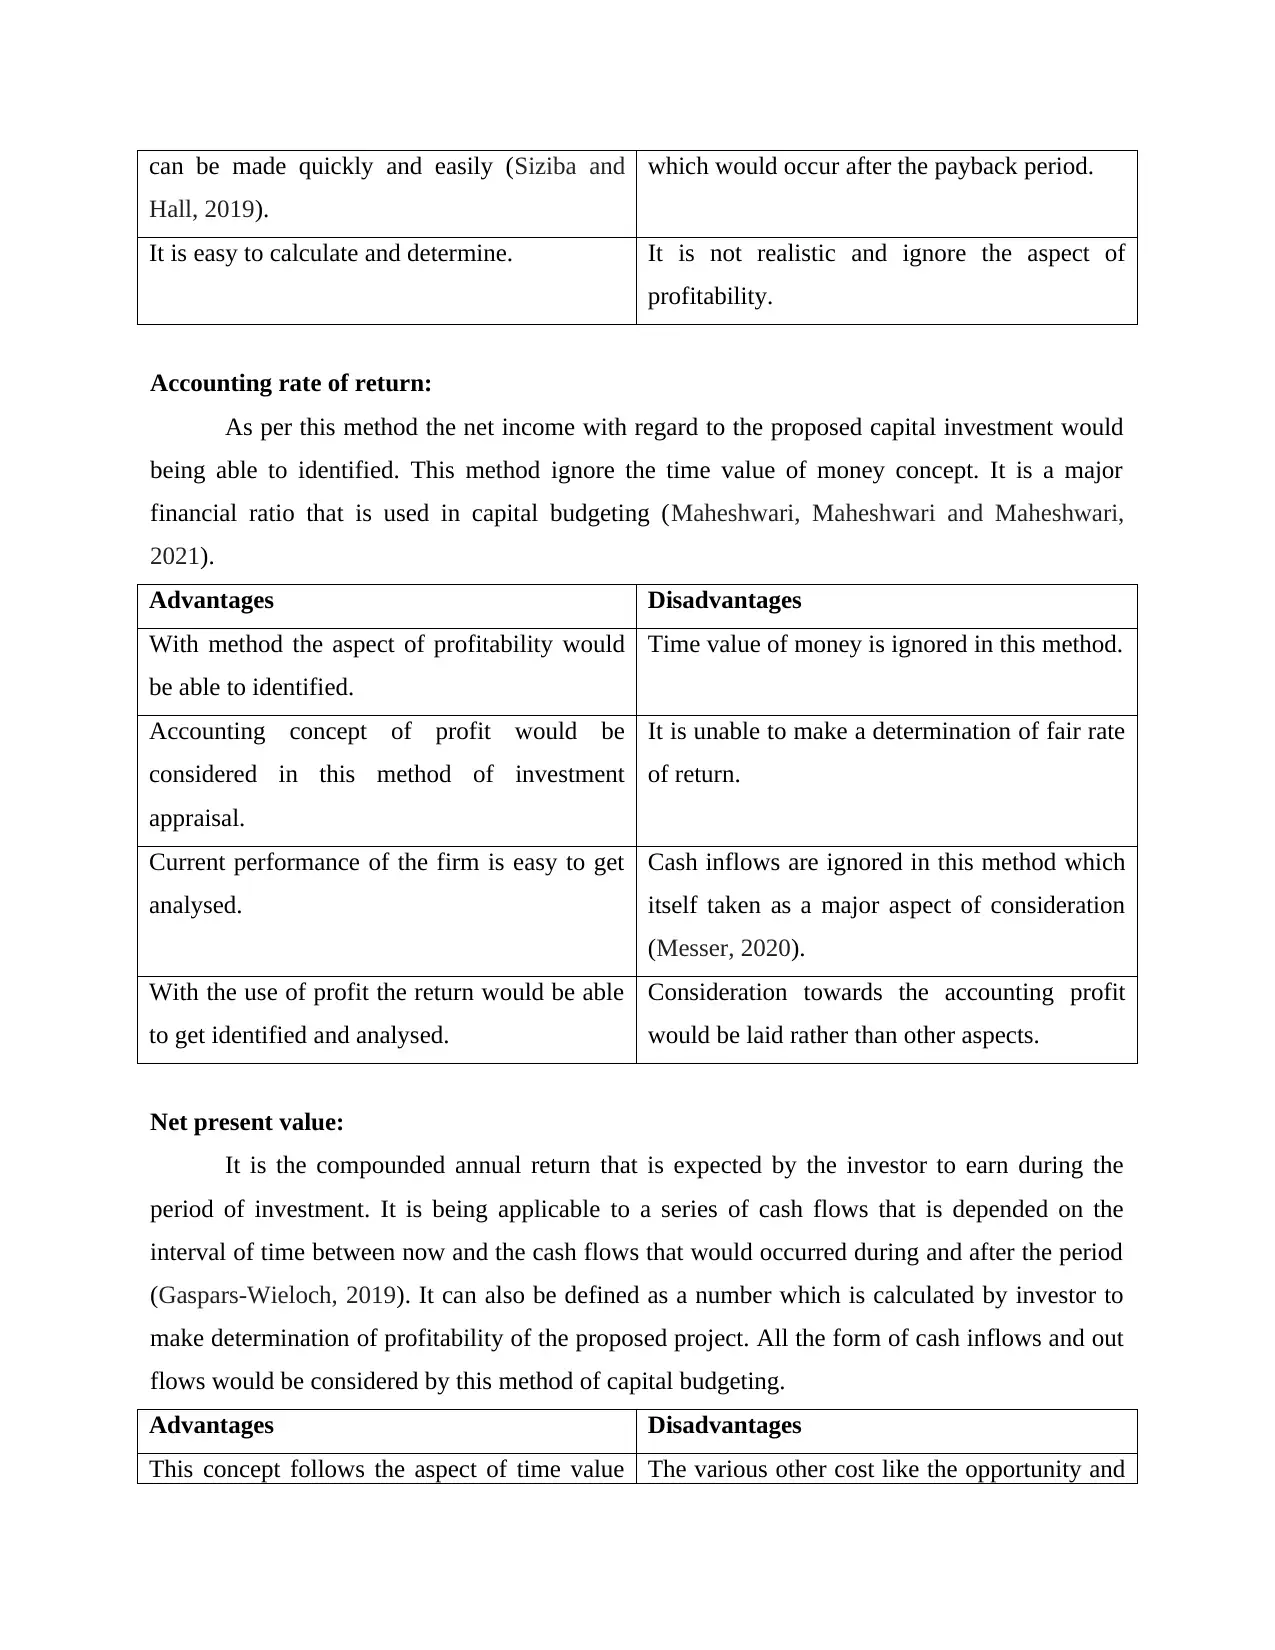
can be made quickly and easily (Siziba and
Hall, 2019).
which would occur after the payback period.
It is easy to calculate and determine. It is not realistic and ignore the aspect of
profitability.
Accounting rate of return:
As per this method the net income with regard to the proposed capital investment would
being able to identified. This method ignore the time value of money concept. It is a major
financial ratio that is used in capital budgeting (Maheshwari, Maheshwari and Maheshwari,
2021).
Advantages Disadvantages
With method the aspect of profitability would
be able to identified.
Time value of money is ignored in this method.
Accounting concept of profit would be
considered in this method of investment
appraisal.
It is unable to make a determination of fair rate
of return.
Current performance of the firm is easy to get
analysed.
Cash inflows are ignored in this method which
itself taken as a major aspect of consideration
(Messer, 2020).
With the use of profit the return would be able
to get identified and analysed.
Consideration towards the accounting profit
would be laid rather than other aspects.
Net present value:
It is the compounded annual return that is expected by the investor to earn during the
period of investment. It is being applicable to a series of cash flows that is depended on the
interval of time between now and the cash flows that would occurred during and after the period
(Gaspars-Wieloch, 2019). It can also be defined as a number which is calculated by investor to
make determination of profitability of the proposed project. All the form of cash inflows and out
flows would be considered by this method of capital budgeting.
Advantages Disadvantages
This concept follows the aspect of time value The various other cost like the opportunity and
⊘ This is a preview!⊘
Do you want full access?
Subscribe today to unlock all pages.
Trusted by 1+ million students worldwide
1 out of 17
Related Documents


Your All-in-One AI-Powered Toolkit for Academic Success.
+13062052269
info@desklib.com
Available 24*7 on WhatsApp / Email
![[object Object]](/_next/static/media/star-bottom.7253800d.svg)
Unlock your academic potential
Copyright © 2020–2026 A2Z Services. All Rights Reserved. Developed and managed by ZUCOL.