Comparative Financial Analysis: TopGlove vs. Hartalega & Supermax
VerifiedAdded on 2020/06/06
|9
|1630
|127
Report
AI Summary
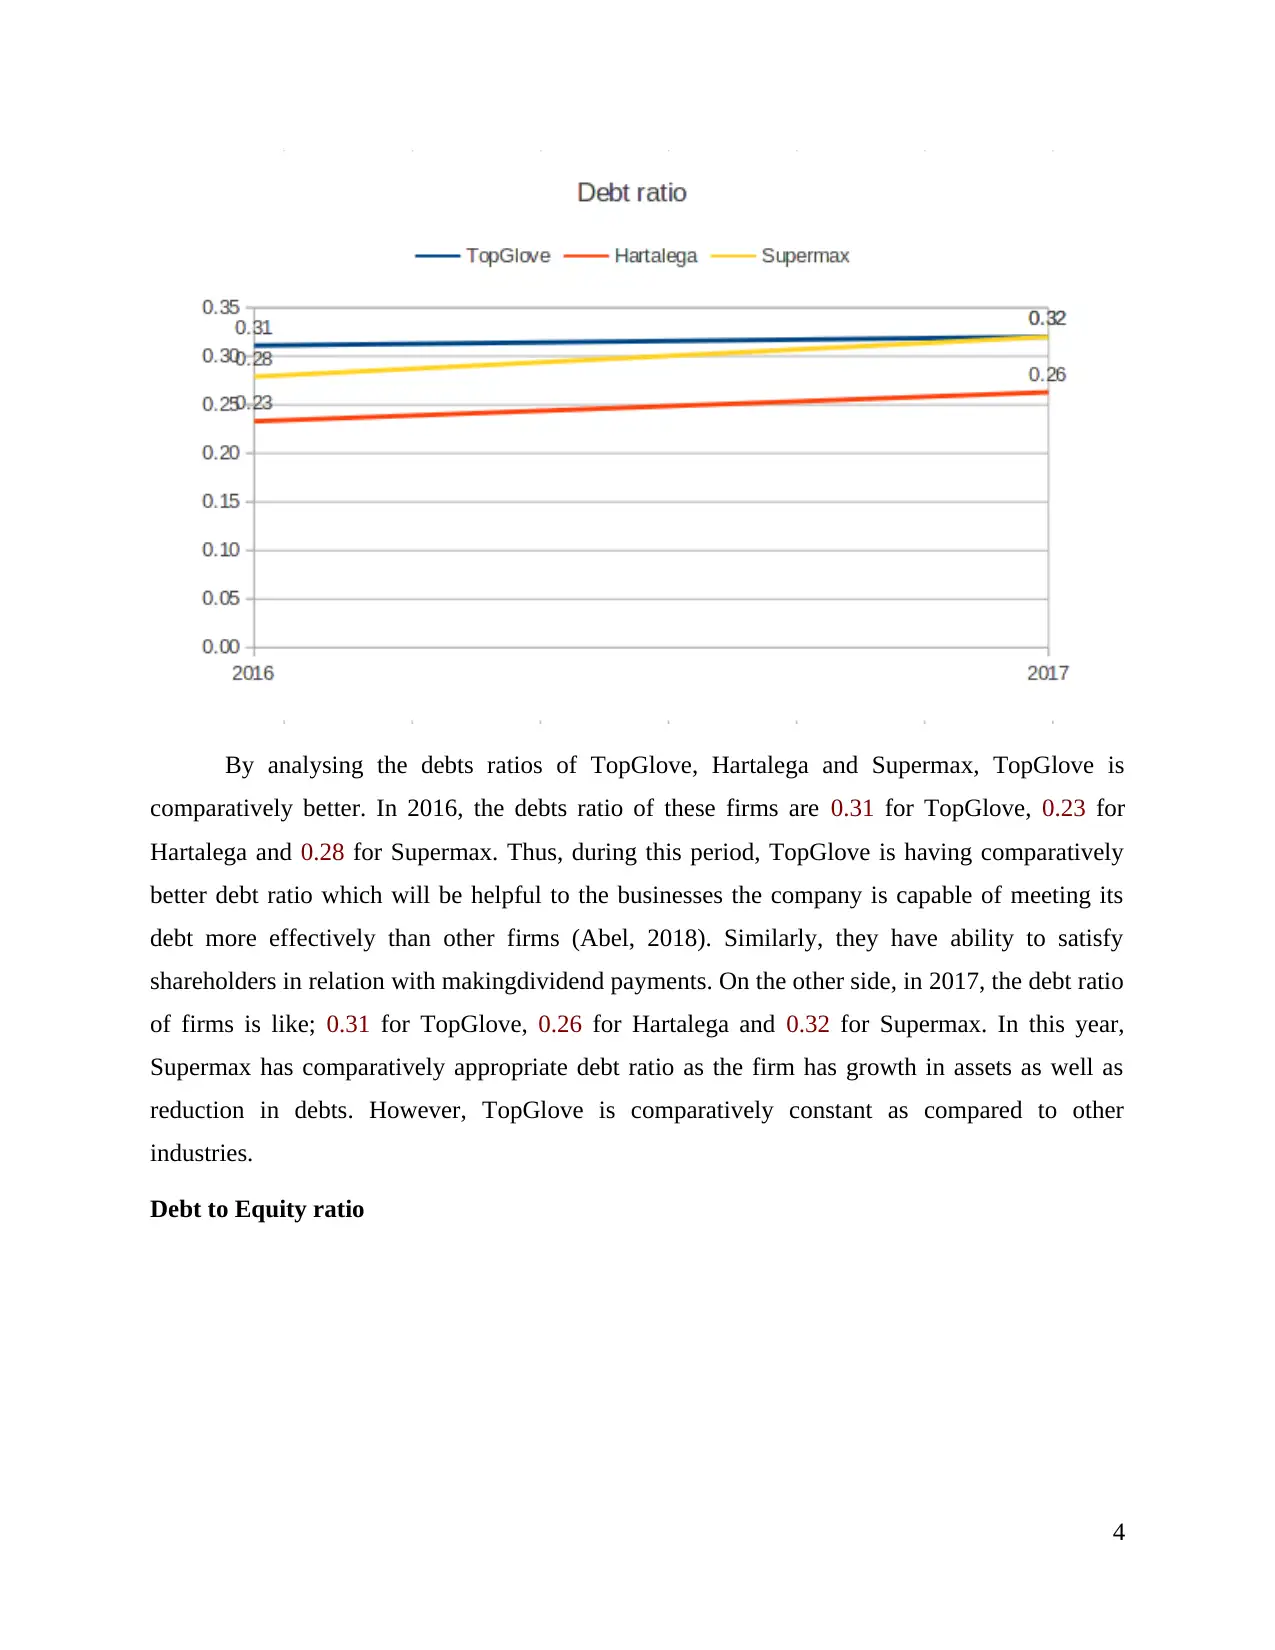
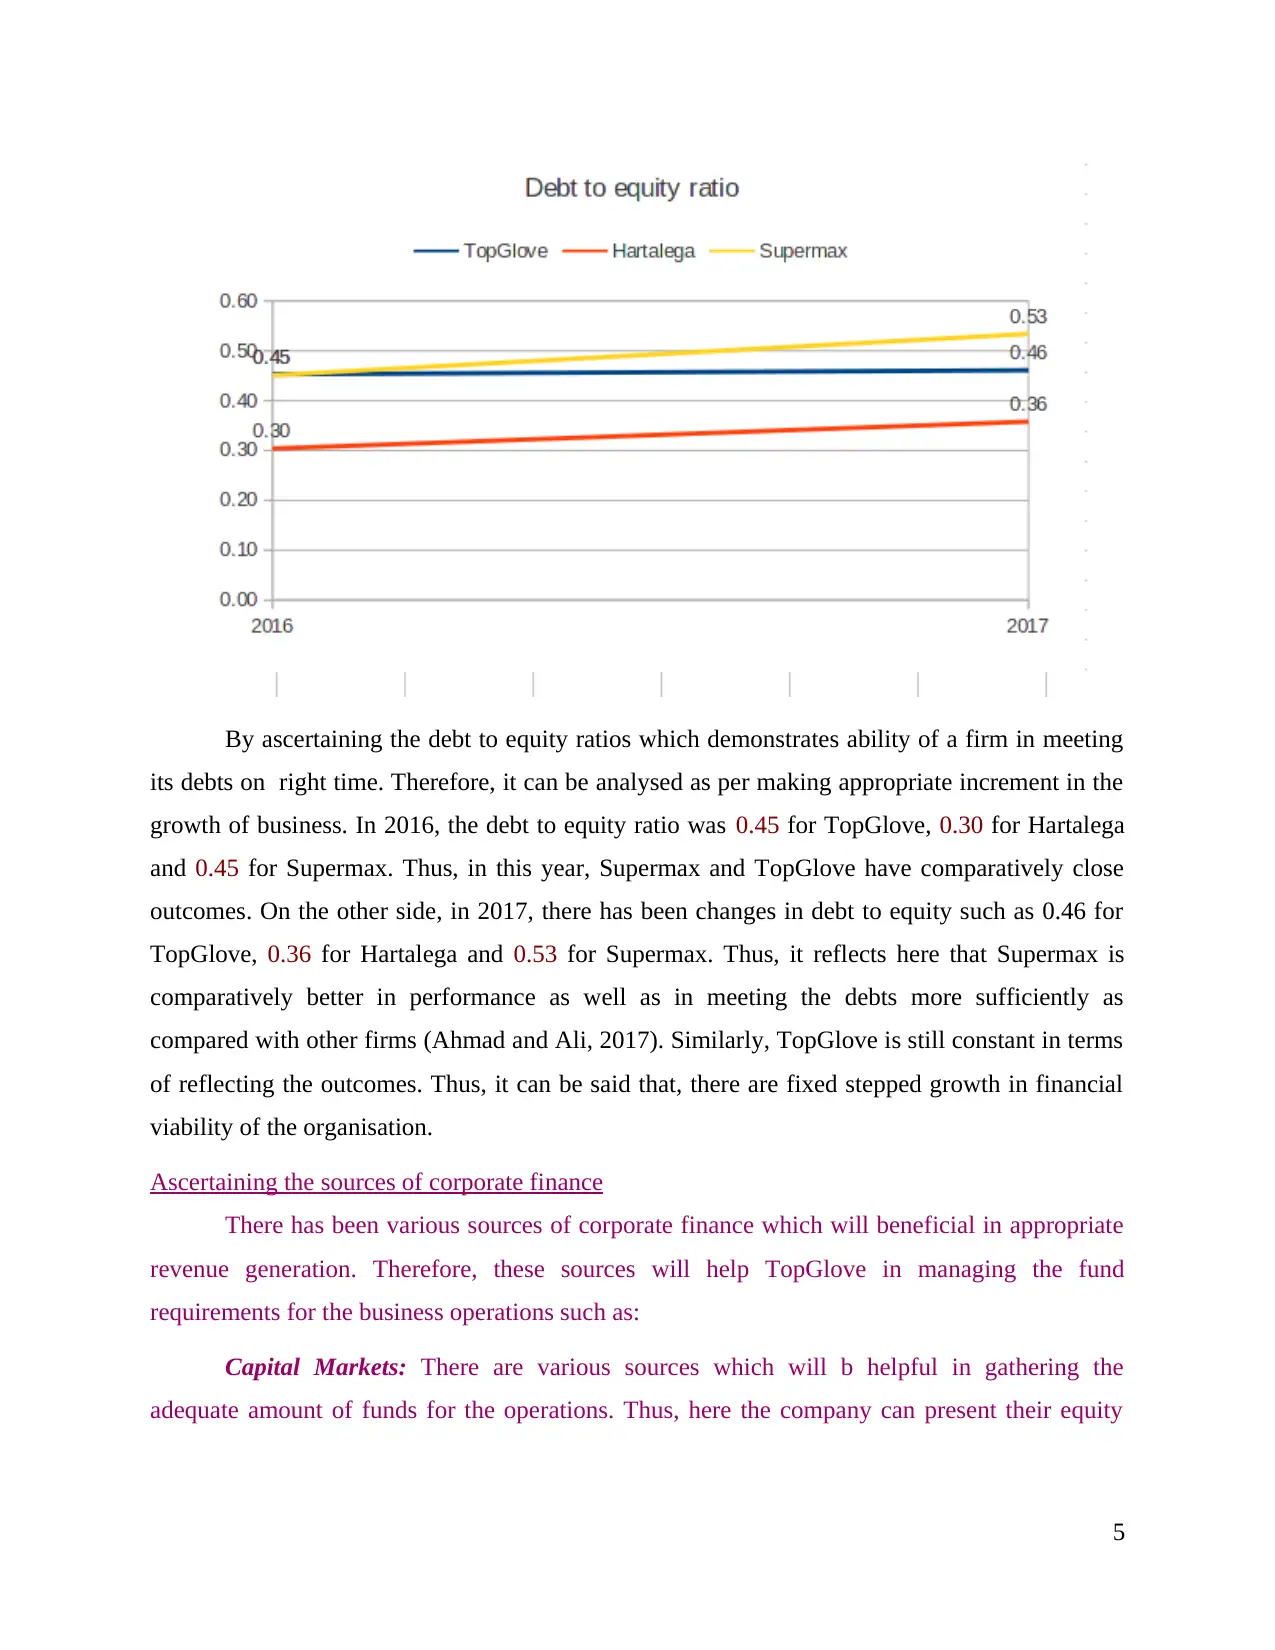
This report provides a comparative financial analysis of TopGlove, Hartalega, and Supermax, focusing on their share price performance and leverage ratios. The analysis includes data from 2016 to 2018, comparing the companies' debt ratios and debt-to-equity ratios to assess their financial health and market value. The report examines TopGlove's position in the market, highlighting its share value relative to competitors. It also explores various sources of corporate finance, such as capital markets, loan stocks, government sources, and venture capital, providing insights into how TopGlove manages its fund requirements. The conclusion suggests improvements in dividend policies and debt management for TopGlove, while acknowledging Supermax as a strong competitor. The report also emphasizes the need for corporate governance development and an appropriate capital structure for long-term business success.

BUSINESS ACCOUNTING
AND FINANCE
AND FINANCE
Paraphrase This Document
Need a fresh take? Get an instant paraphrase of this document with our AI Paraphraser

TABLE OF CONTENTS
INTRODUCTION...........................................................................................................................1
MAIN BODY...................................................................................................................................1
3. Share price performance (CHART) compared with rest of the market..............................1
4. Leverage ratio and evaluation of sources of corporate financing used by company..........2
Ascertaining the sources of corporate finance........................................................................5
CONCLUSION................................................................................................................................6
REFERENCES................................................................................................................................7

INTRODUCTION
To operate a successful business will be challenging in terms of maintaining fame and
brand image in the market. There will be influence of various rivalries and problems which
create obstacles in smooth running of operations. In the present assessment, financial analysis
over TopGlove with its competitors Hartalega and Supermax will be compared on the basis of
their annual performance. It consists of various ratios and methods of analysing the financial
statements. Moreover, information derived from such analysis will be helpful in meeting the
operational needs to manage financial health of entity. Additionally, there will be suggestions to
managerial professionals of organisation relevant with making investment of 100,000,000 MYR.
This corporation is the world's largest rubber glove manufacturing organisation which has
acquired 38 manufacturing units in Malaysia. Therefore, there will be comparison of the
financial health of all these organisations to ascertain appropriate changes for operational
activities.
MAIN BODY
3. Share price performance (CHART) compared with rest of the market
To determine financial value of TopGlove in the market, there has been comparison with
Hartalega and Supermax as per their Equity share price value.
Years TopGlove Hartalega Supermax
2016 5.16 4.69 2.05
2017 7.91 10.68 2
2018 9.90 5.83 2.97
1
⊘ This is a preview!⊘
Do you want full access?
Subscribe today to unlock all pages.

Trusted by 1+ million students worldwide

Commentary: In relation with analysing the market value of these organisations,
TopGlove is having comparatively appropriate share value as compared with Hartalega. On the
other side, in relation with Supermax, the share value is comparatively poor. In 2016, the share
values of firms are 0.29 for TopGlove, 0.08 for Hartalega and 0.29 was of Supermax. It indicates
that TopGlove is needed to have a large number of investors which will be helpful to the firm for
rising its efficiency as well as market value (TOP GLOVE CORP BHD, 2018). In 2017, the share
values of TopGlove was 0.26, Hartalega was 0.09 and Supermax for 0.42. Same as, 2018
TopGlove at 0.3, Hartalega as 0.12 and Supermax as 0.54. (Supermax annual report, 2018).
4. Leverage ratio and evaluation of sources of corporate financing used by company
In relation with analysing the leverage ratios of organisation, there are various operations
which will be helpful to make proper development of policies and strategies that will be fruitful
in better corporate governance (D'Mello, Gruskin and Kulchania, 2018). Moreover, there will be
consideration of debt ratio and debt to equity ratio which include components like debts, equity
and total assets. There will be comparison of TopGlove with Hartalega and Supermax for the
period of 2016 and 2017.
TopGlove Hartalega Supermax
2
Paraphrase This Document
Need a fresh take? Get an instant paraphrase of this document with our AI Paraphraser

Particula
rs
Form
ulas 2016 Ratio 2017 Ratio 2016 Ratio 2017 Ratio 2016 Ratio 2017 Ratio
Leverage
ratio
Debt
ratio
Total
debt 823 0.31 924 0.35 457 0.23 602 0.26 459 0.28 570 0.32
Total
assets 2649 2936 1961 2287 1644 1789
Debt to
equity
ratio
Total
debt 823 0.45 924 0.46 457 0.3 602 0.36 459 0.45 570 0.53
Total
equit
y 1818 2003 1502 1682 1018 1067
Commentary
The finance health of all these organisations are having appropriate increment and growth
as per their leverage ratios. Moreover, these ratios will be helpful in making an appropriate
increment as well as development of financial viability in business (Kwan, 2017). However, the
ratios have been determined and analysed as per their performance during 2016 and 2017 which
will be based on these ratios such as:
Debt ratio
3

By analysing the debts ratios of TopGlove, Hartalega and Supermax, TopGlove is
comparatively better. In 2016, the debts ratio of these firms are 0.31 for TopGlove, 0.23 for
Hartalega and 0.28 for Supermax. Thus, during this period, TopGlove is having comparatively
better debt ratio which will be helpful to the businesses the company is capable of meeting its
debt more effectively than other firms (Abel, 2018). Similarly, they have ability to satisfy
shareholders in relation with makingdividend payments. On the other side, in 2017, the debt ratio
of firms is like; 0.31 for TopGlove, 0.26 for Hartalega and 0.32 for Supermax. In this year,
Supermax has comparatively appropriate debt ratio as the firm has growth in assets as well as
reduction in debts. However, TopGlove is comparatively constant as compared to other
industries.
Debt to Equity ratio
4
⊘ This is a preview!⊘
Do you want full access?
Subscribe today to unlock all pages.

Trusted by 1+ million students worldwide

By ascertaining the debt to equity ratios which demonstrates ability of a firm in meeting
its debts on right time. Therefore, it can be analysed as per making appropriate increment in the
growth of business. In 2016, the debt to equity ratio was 0.45 for TopGlove, 0.30 for Hartalega
and 0.45 for Supermax. Thus, in this year, Supermax and TopGlove have comparatively close
outcomes. On the other side, in 2017, there has been changes in debt to equity such as 0.46 for
TopGlove, 0.36 for Hartalega and 0.53 for Supermax. Thus, it reflects here that Supermax is
comparatively better in performance as well as in meeting the debts more sufficiently as
compared with other firms (Ahmad and Ali, 2017). Similarly, TopGlove is still constant in terms
of reflecting the outcomes. Thus, it can be said that, there are fixed stepped growth in financial
viability of the organisation.
Ascertaining the sources of corporate finance
There has been various sources of corporate finance which will beneficial in appropriate
revenue generation. Therefore, these sources will help TopGlove in managing the fund
requirements for the business operations such as:
Capital Markets: There are various sources which will b helpful in gathering the
adequate amount of funds for the operations. Thus, here the company can present their equity
5
Paraphrase This Document
Need a fresh take? Get an instant paraphrase of this document with our AI Paraphraser

share in the market which will be purchased by the shareholders. It includes, equity shares,
preference shares, bonds etc.
Loan Stock: To generate the favourable amount of capital funds to operate the business
activities these requirements will be meet by the organisation as if they took a necessary amount
of loans from banks. Thus, on which they have to make payment for periodical interest.
Government sources: The grants made by government in relation with supporting the
business or trade practices of organisation. Thus, it will be helpful for them in meeting the
adequate requirements.
Venture capital: The funds which have been generated by the firm through its
operational activities will be helpful for the business activities. Thus, these are the revenue or
income which have been generated by the firm through its operational efforts.
CONCLUSION
On the basis of above report, it can be concluded here that the firms are challenging each
other on the basis of their financial health. To make an accurate decision which will lead the firm
to have effective success for the long period, there has been analysis over various operations.
Moreover, it will be suggested to professionals for TopGlove that they must make appropriate
improvements in dividend policies as well as bring the satisfactory gains to the firm. Similarly,
there is also need to manage the debts of business which will be effective in balancing the
efficiency of business. Moreover, in comparison with the competitors of firm, Supermax is quiet
challenging for business as per appropriate financial health. Additionally, it can be said that there
is the need to have development of corporate government and accurate capital structure which
will be effective for long run of business as well as to balance their market value.
6

REFERENCES
Books and Journals
Abel, A. B., 2018. Optimal Debt and Profitability in the Trade‐Off Theory. The Journal of
Finance. 73(1). pp.95-143.
Ahmad, W. and Ali, N. A. M., 2017. Pecking Order Theory: Evidence from Malaysia and
Thailand Food and Beverages Industry. Jurnal Intelek. 12(1).
D'Mello, R., Gruskin, M. and Kulchania, M., 2018. Shareholders valuation of long-term debt and
decline in firms' leverage ratio. Journal of Corporate Finance. 48. pp.352-374.
Kwan, C. H., 2017. Comments on “Local Government Debt and Firm Leverage: Evidence from
China,”. Asian Economic Policy Review. 12(2). pp.235-236.
Online
Supermax annual report. 2018. [Online]. Available
through :<https://www.klsescreener.com/v2/announcements/view/18542129>.
TOP GLOVE CORP BHD. 2018. [Online]. Available through
:<https://klse.i3investor.com/servlets/stk/7113.jsp>.
7
⊘ This is a preview!⊘
Do you want full access?
Subscribe today to unlock all pages.

Trusted by 1+ million students worldwide
1 out of 9
Related Documents

Your All-in-One AI-Powered Toolkit for Academic Success.
+13062052269
info@desklib.com
Available 24*7 on WhatsApp / Email
Unlock your academic potential
Copyright © 2020–2025 A2Z Services. All Rights Reserved. Developed and managed by ZUCOL.