Tourism and Hospitality Research Analysis of Tourist Satisfaction

Verified

Added on  2023/05/30

|15
|2674
|84
Report
AI Summary
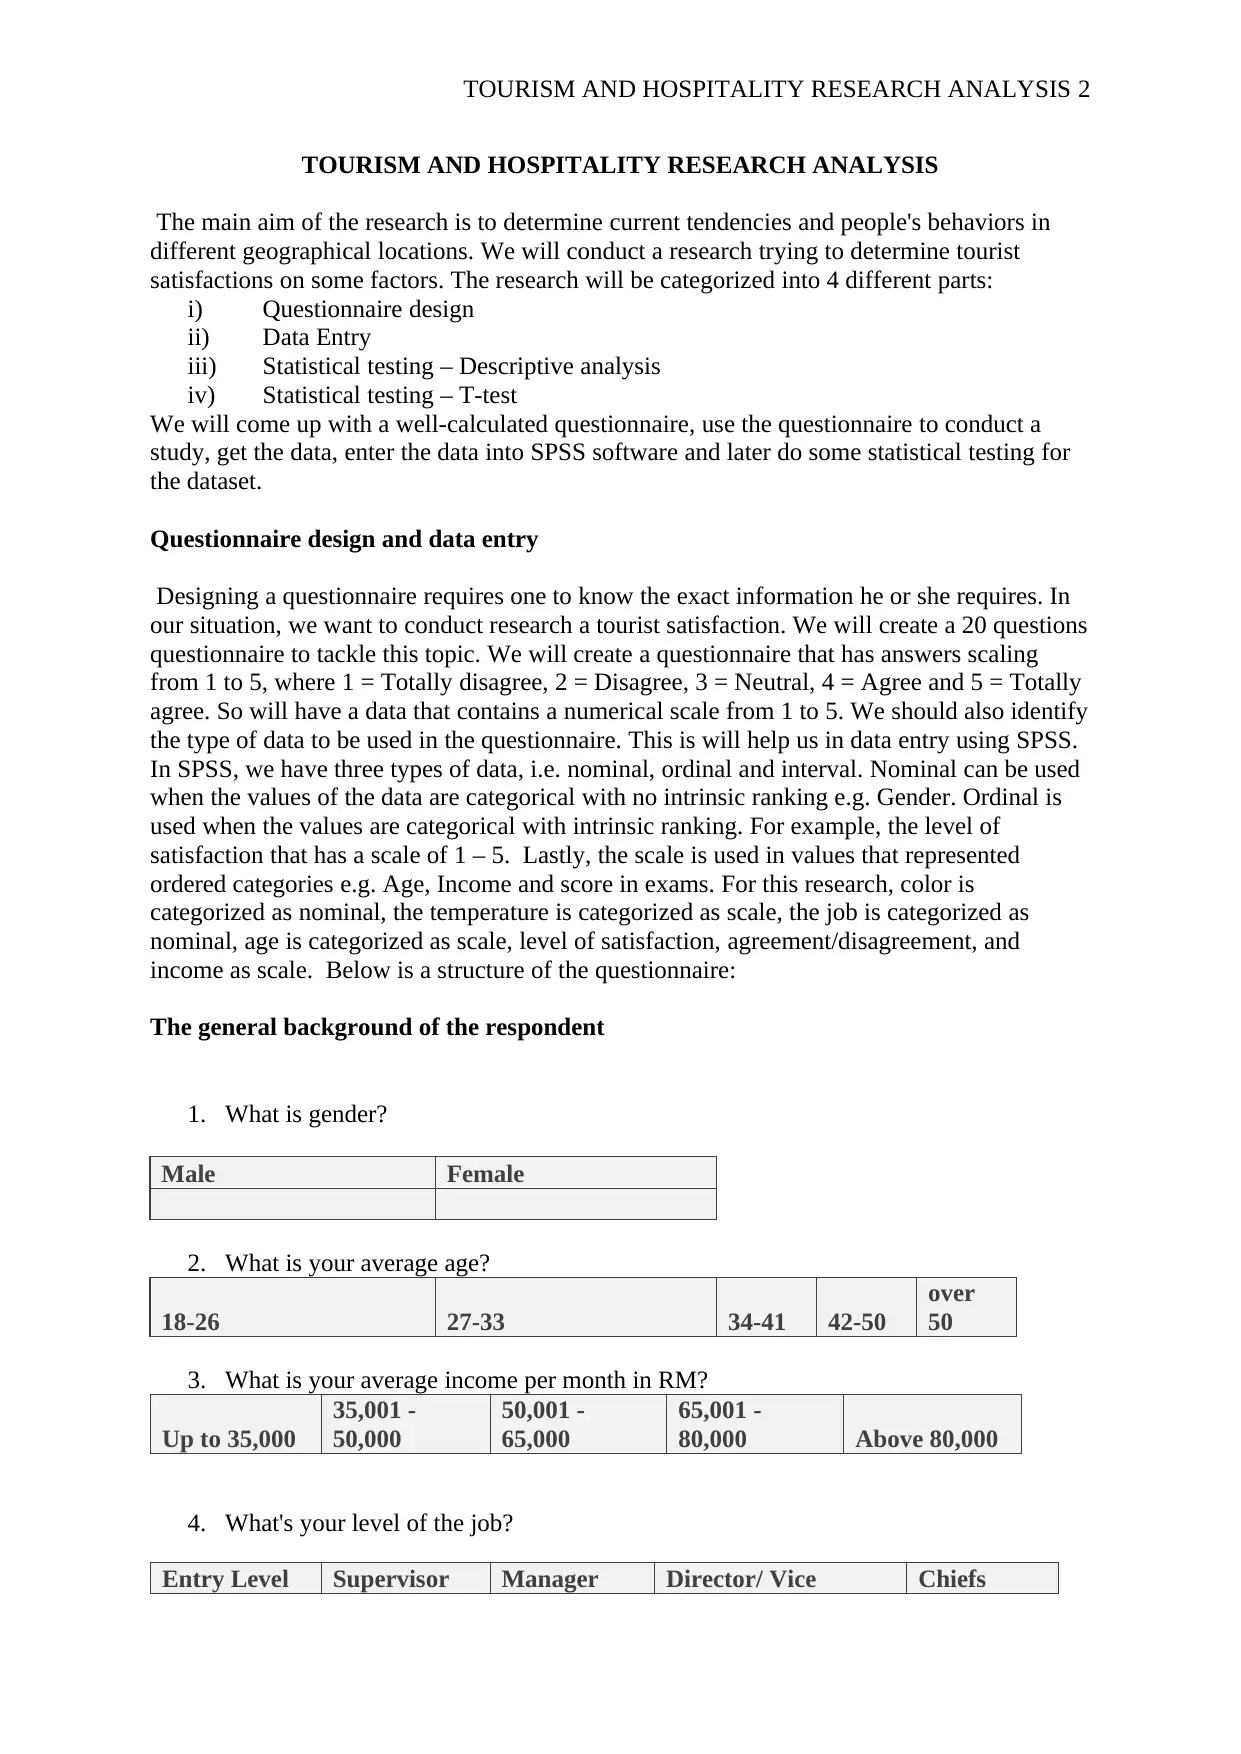
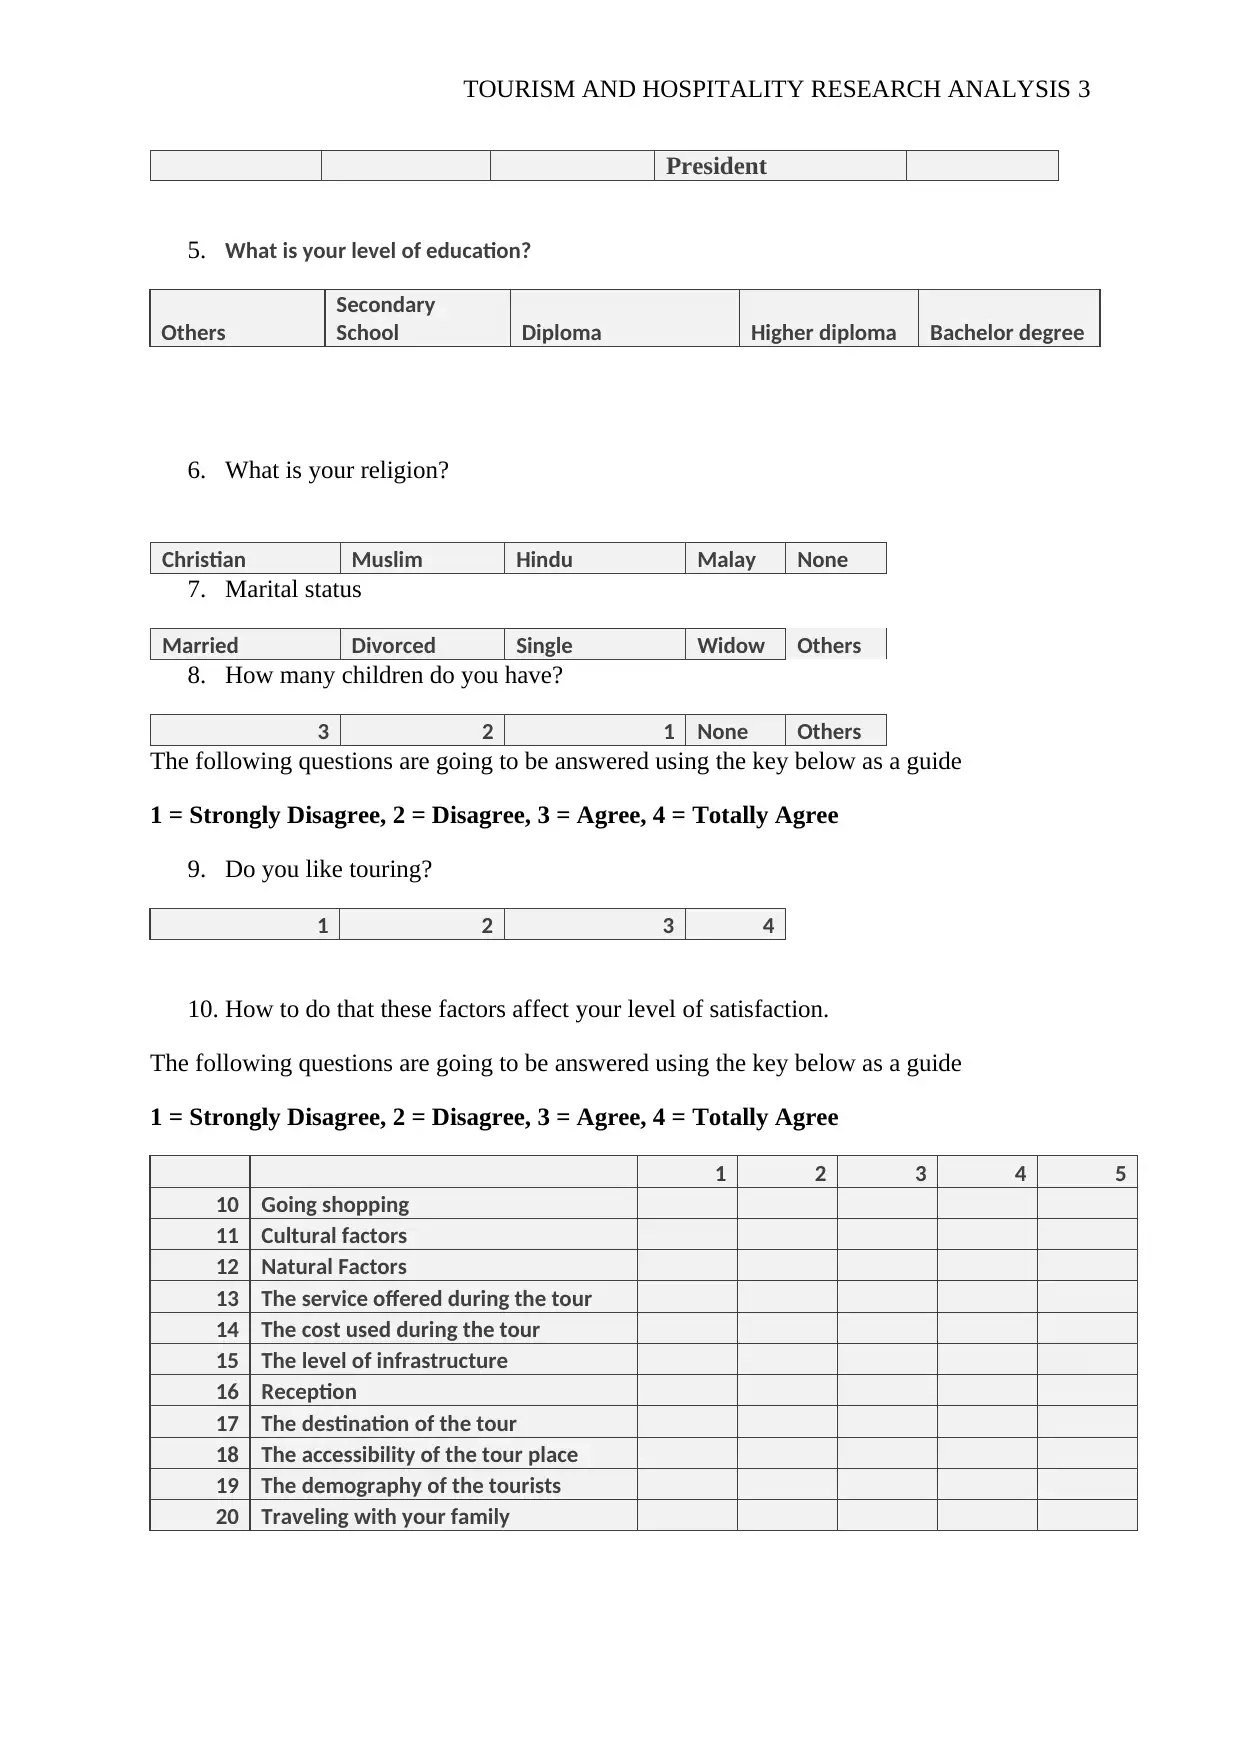
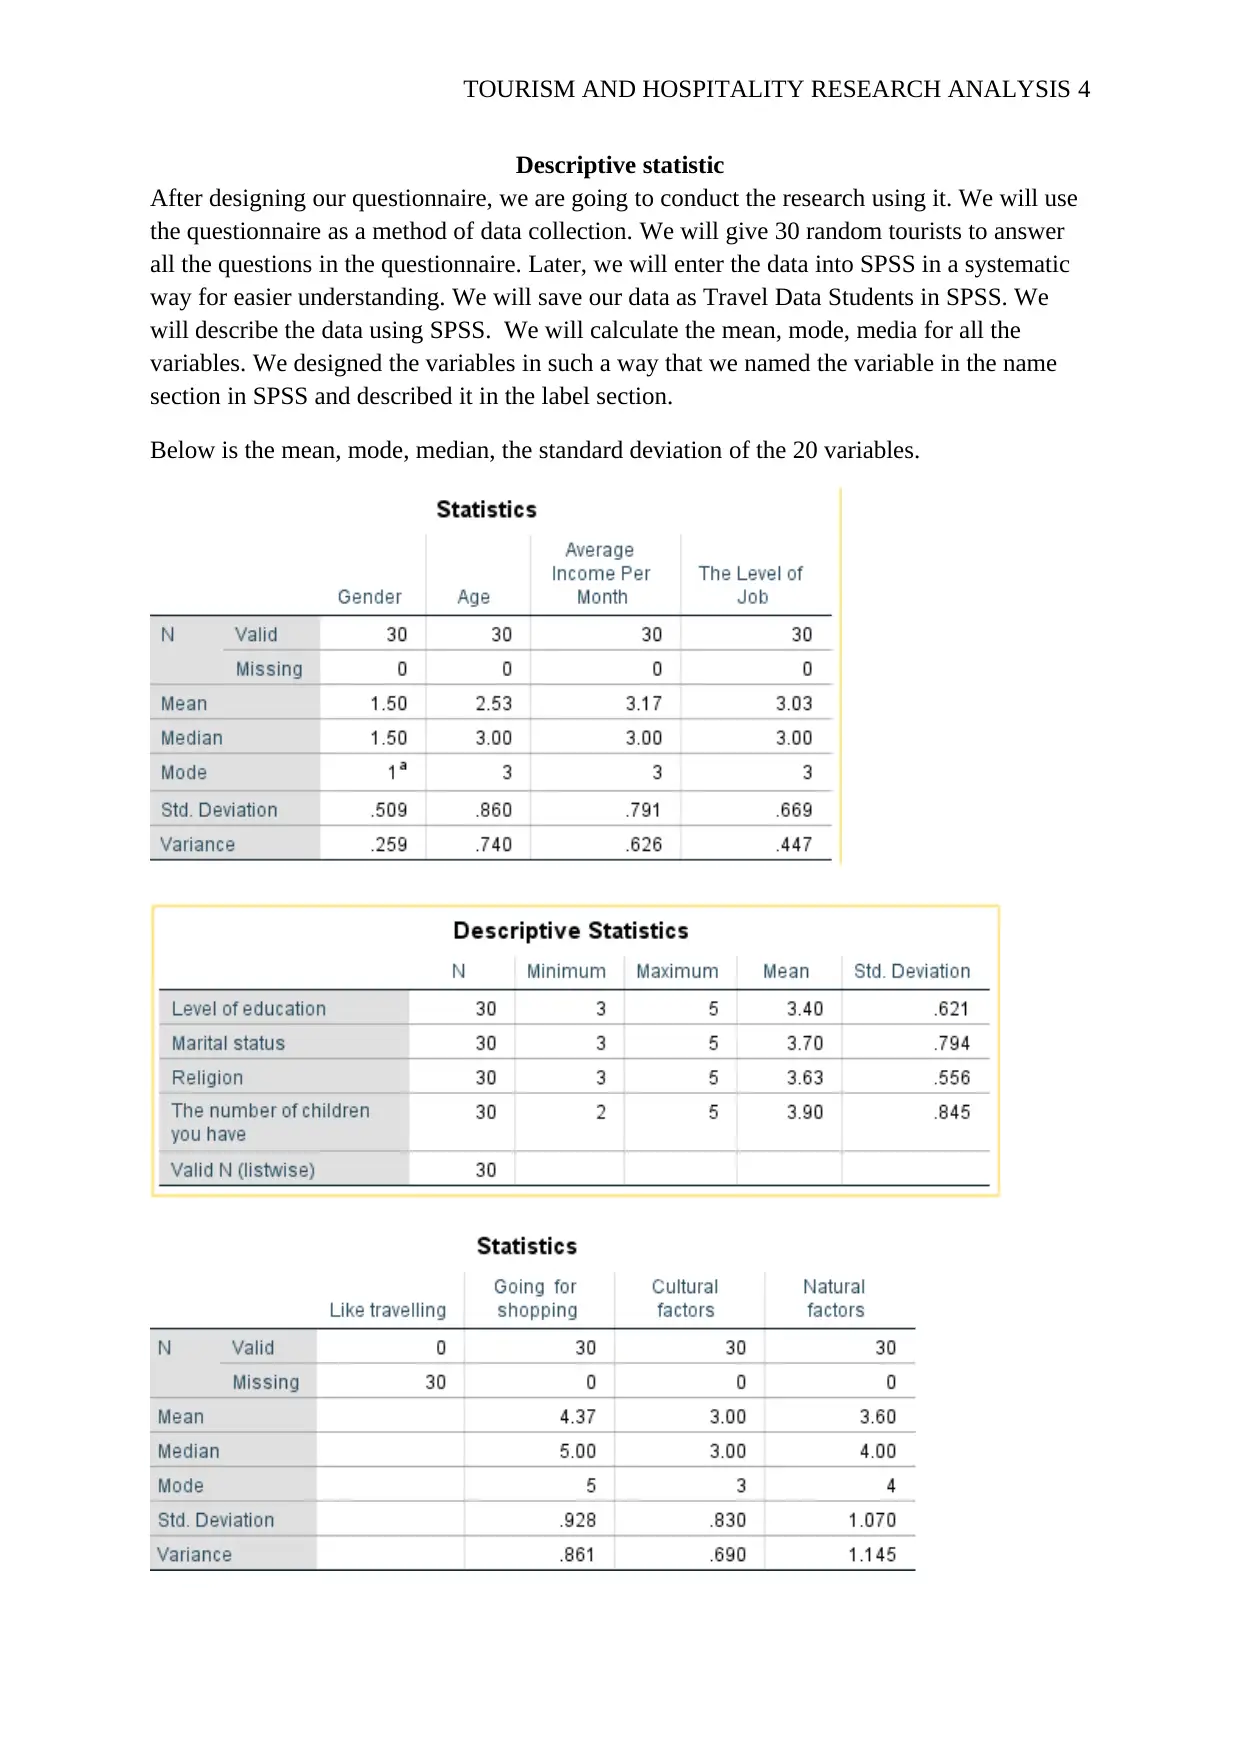
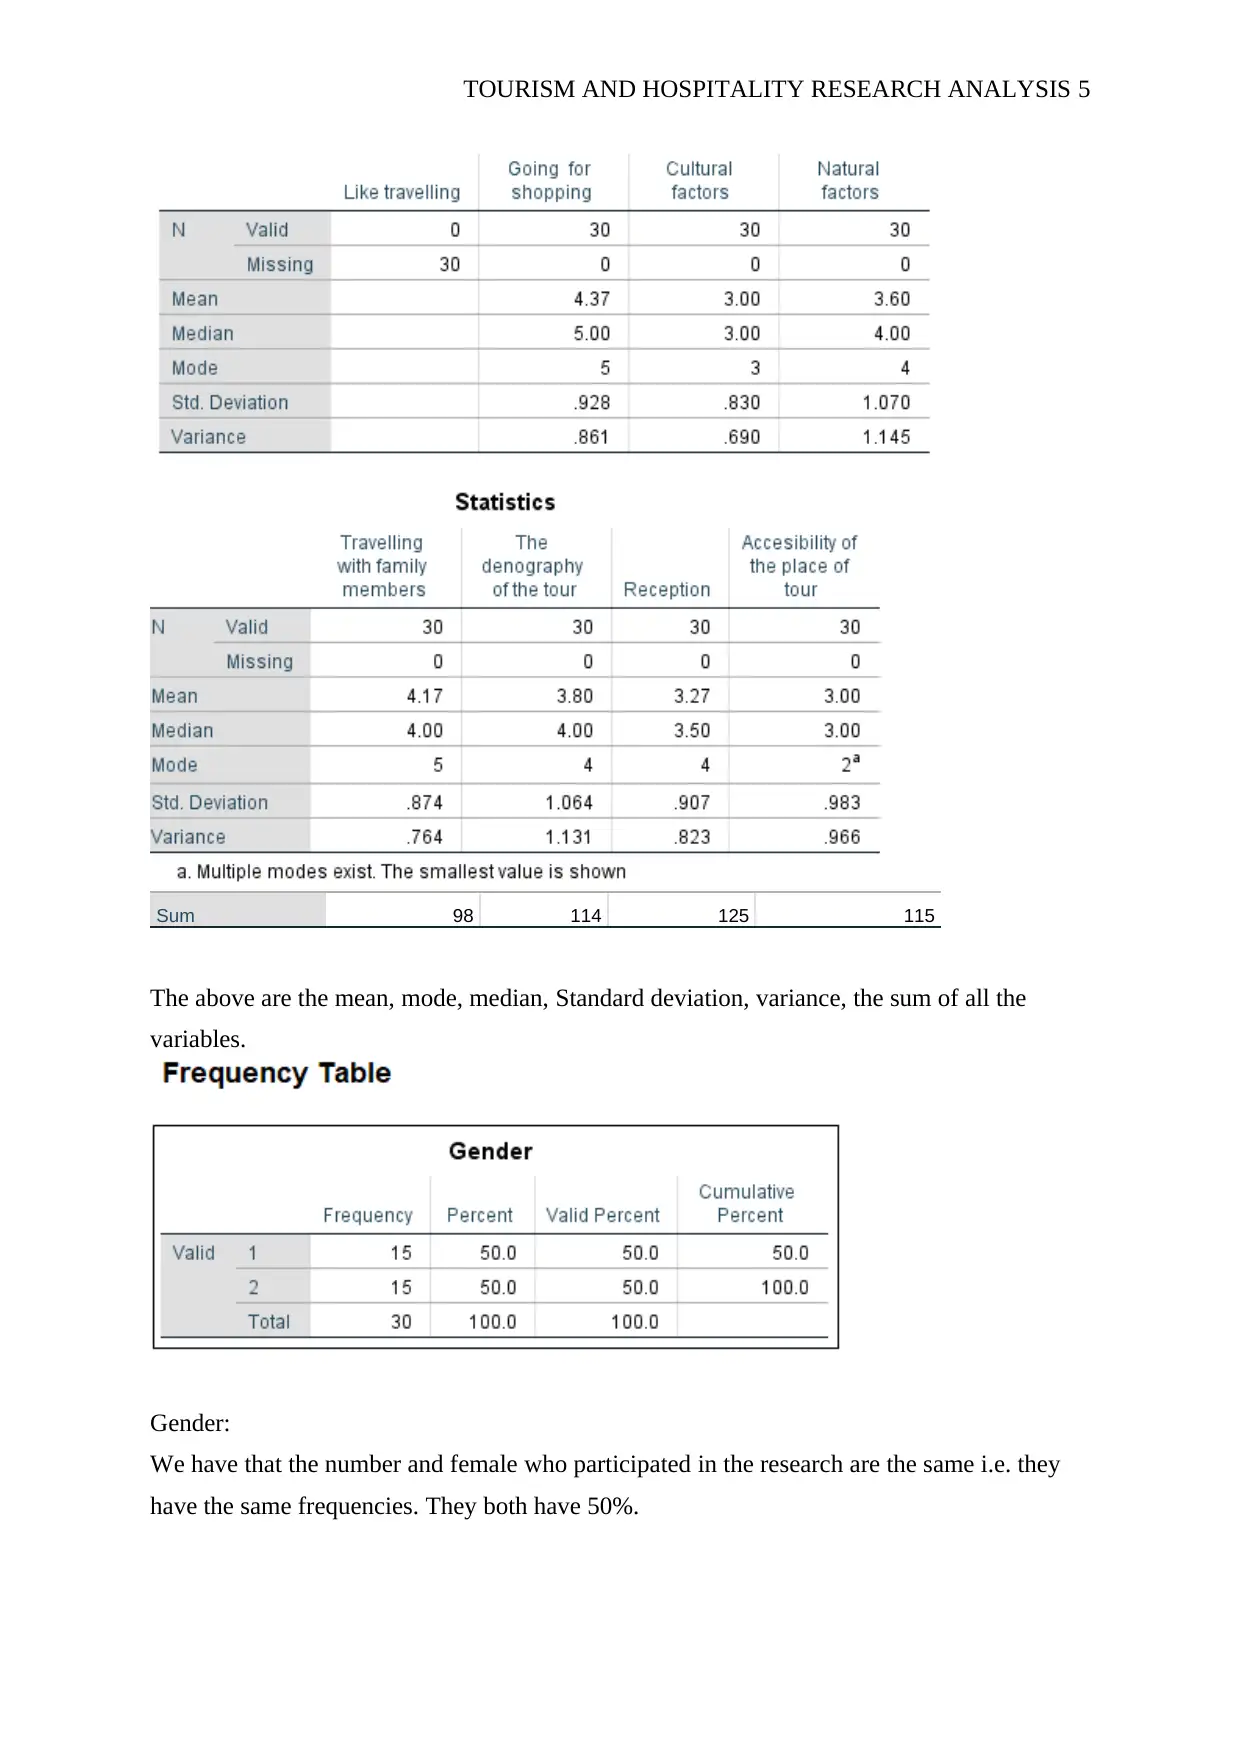
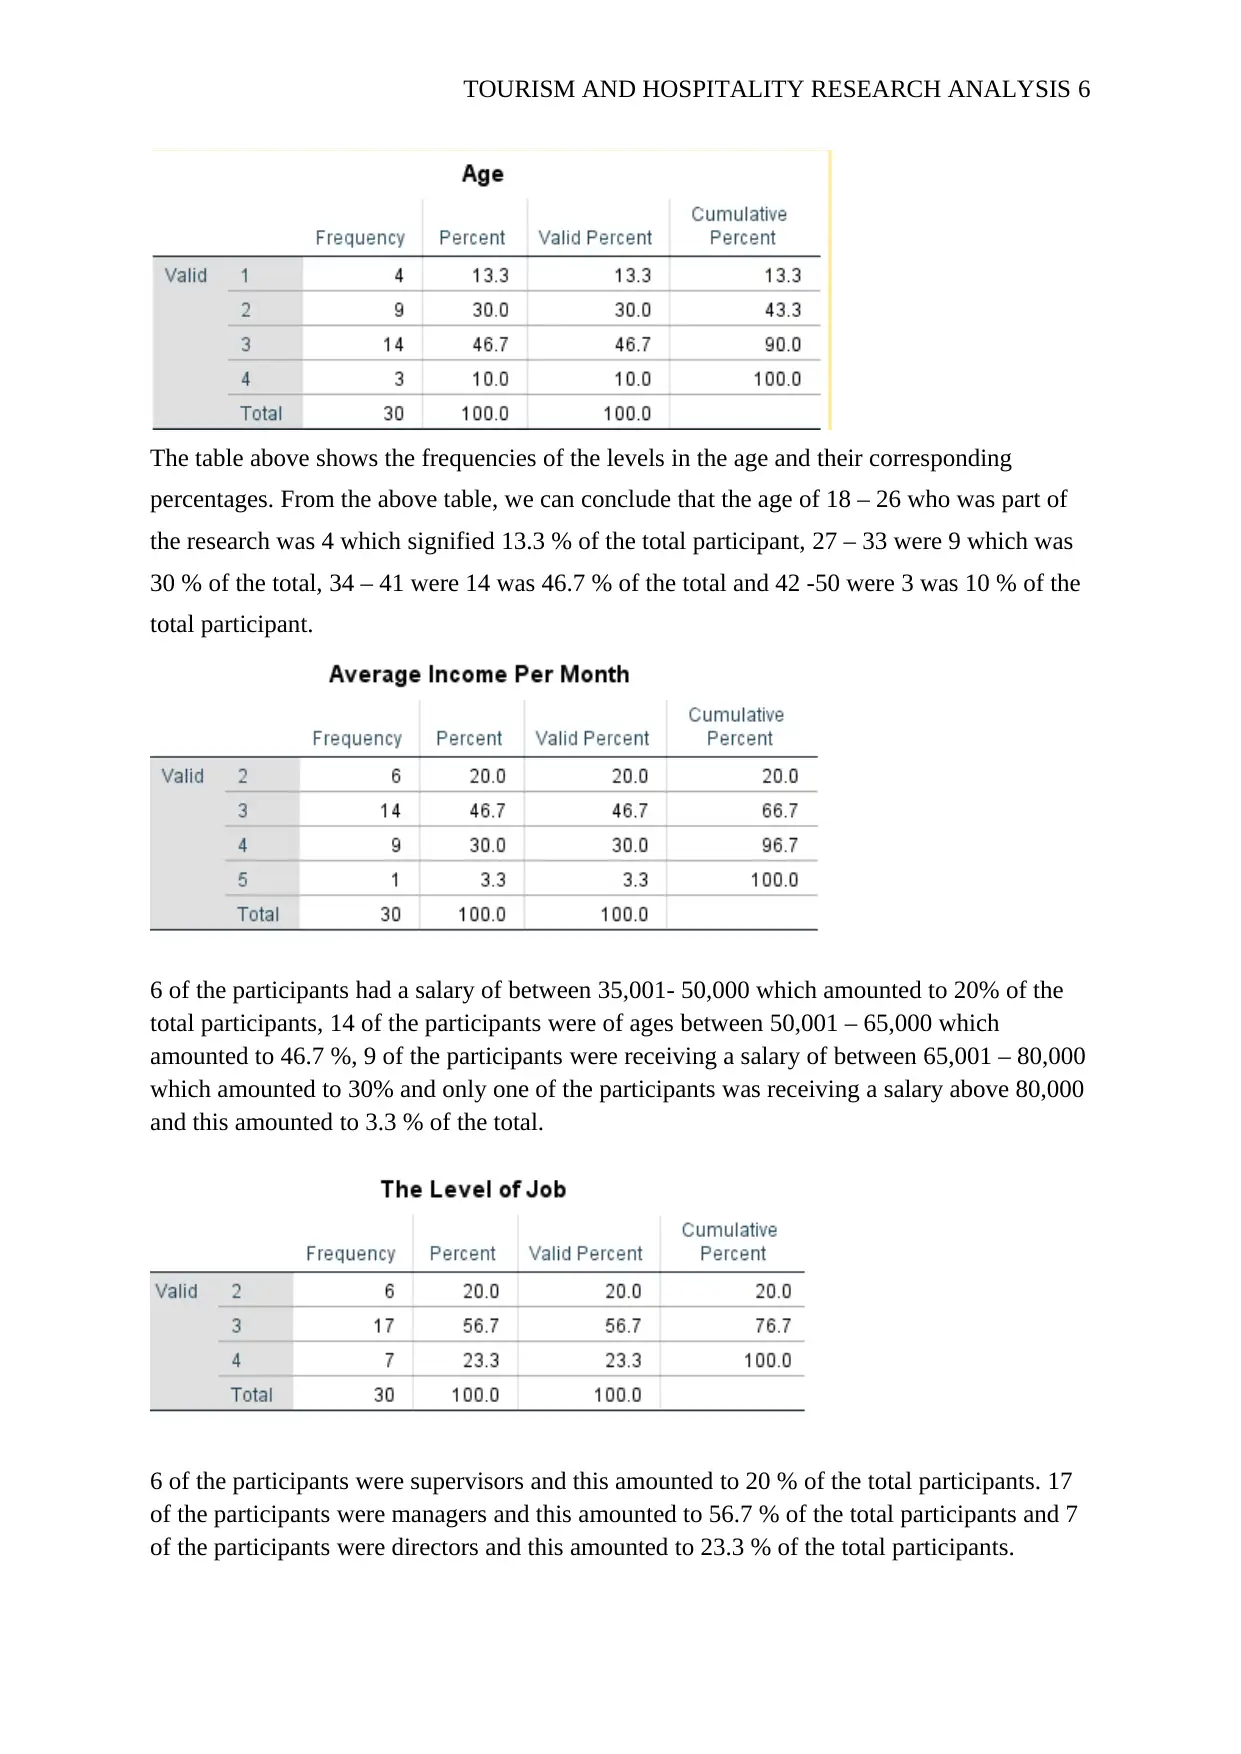
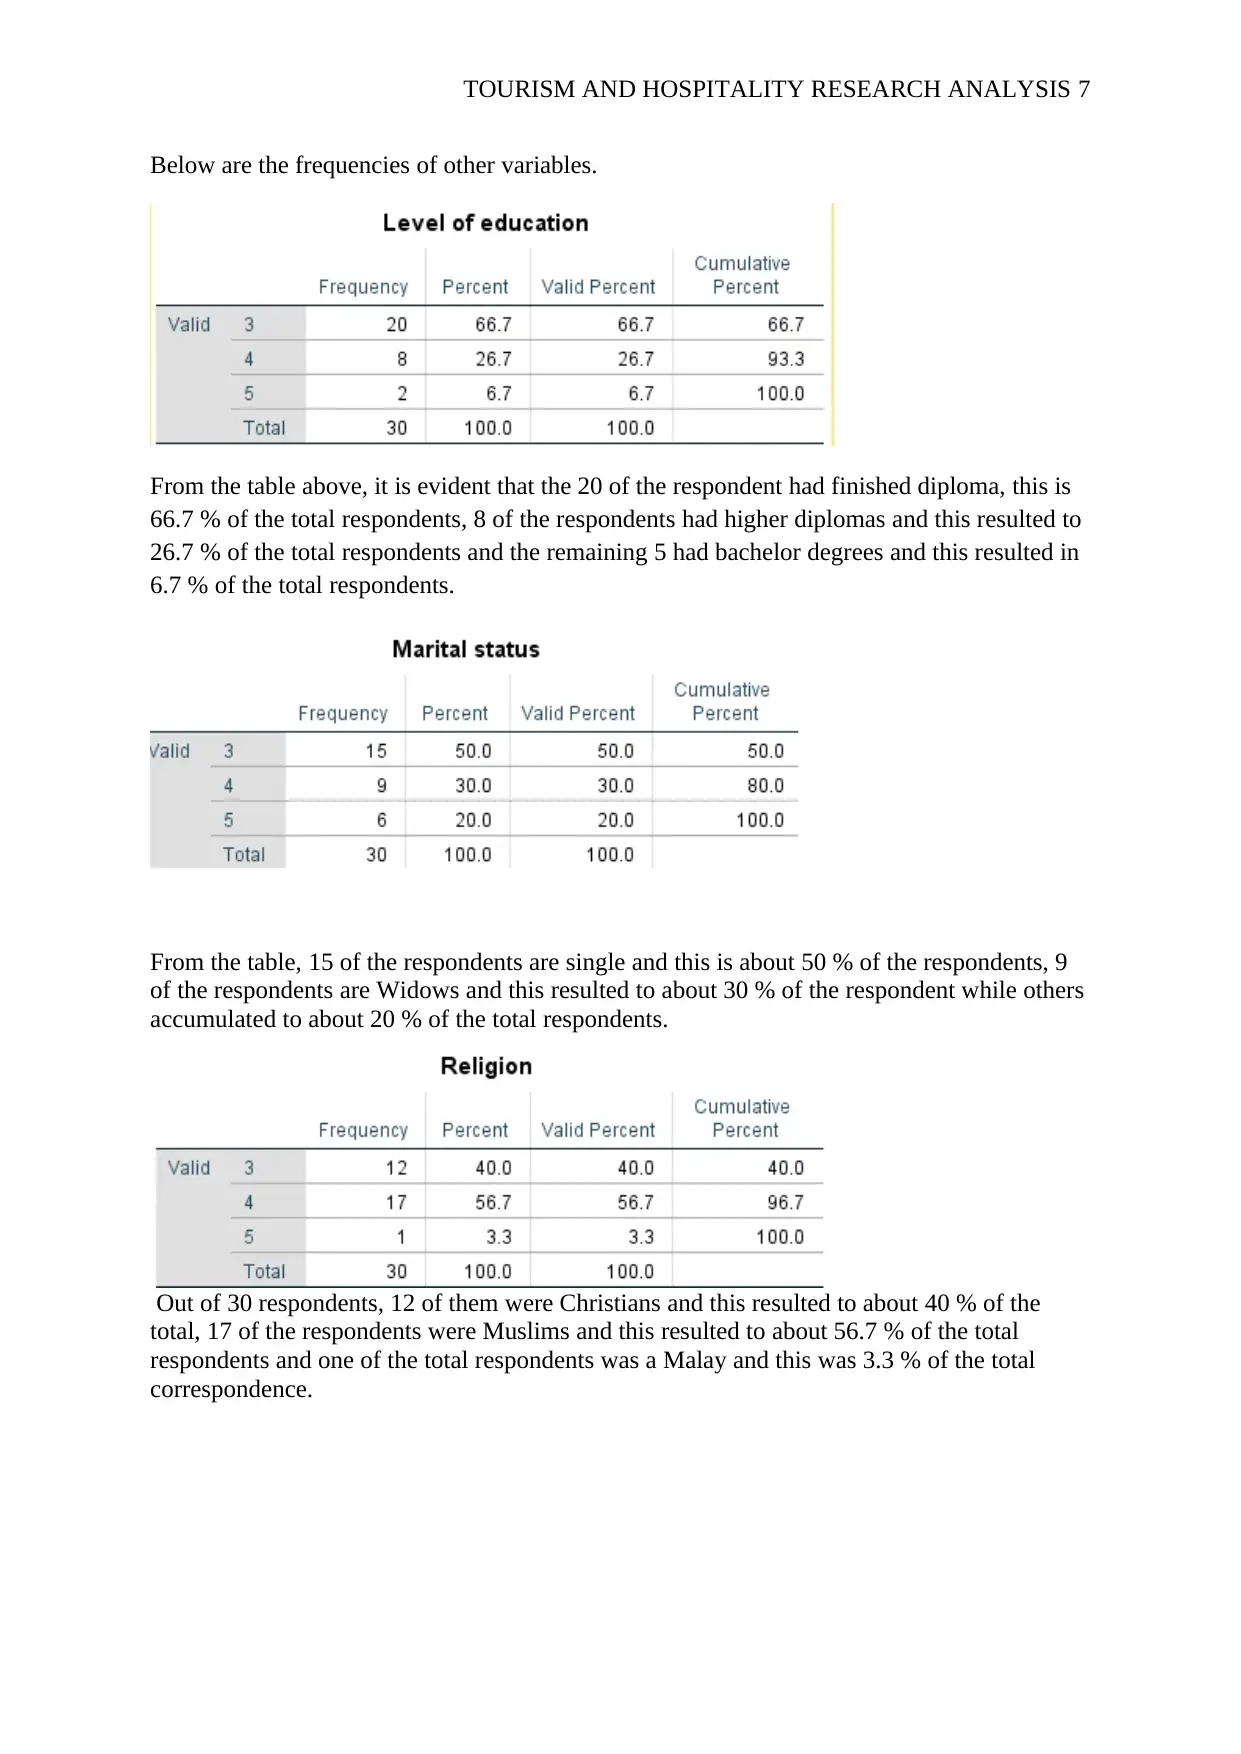
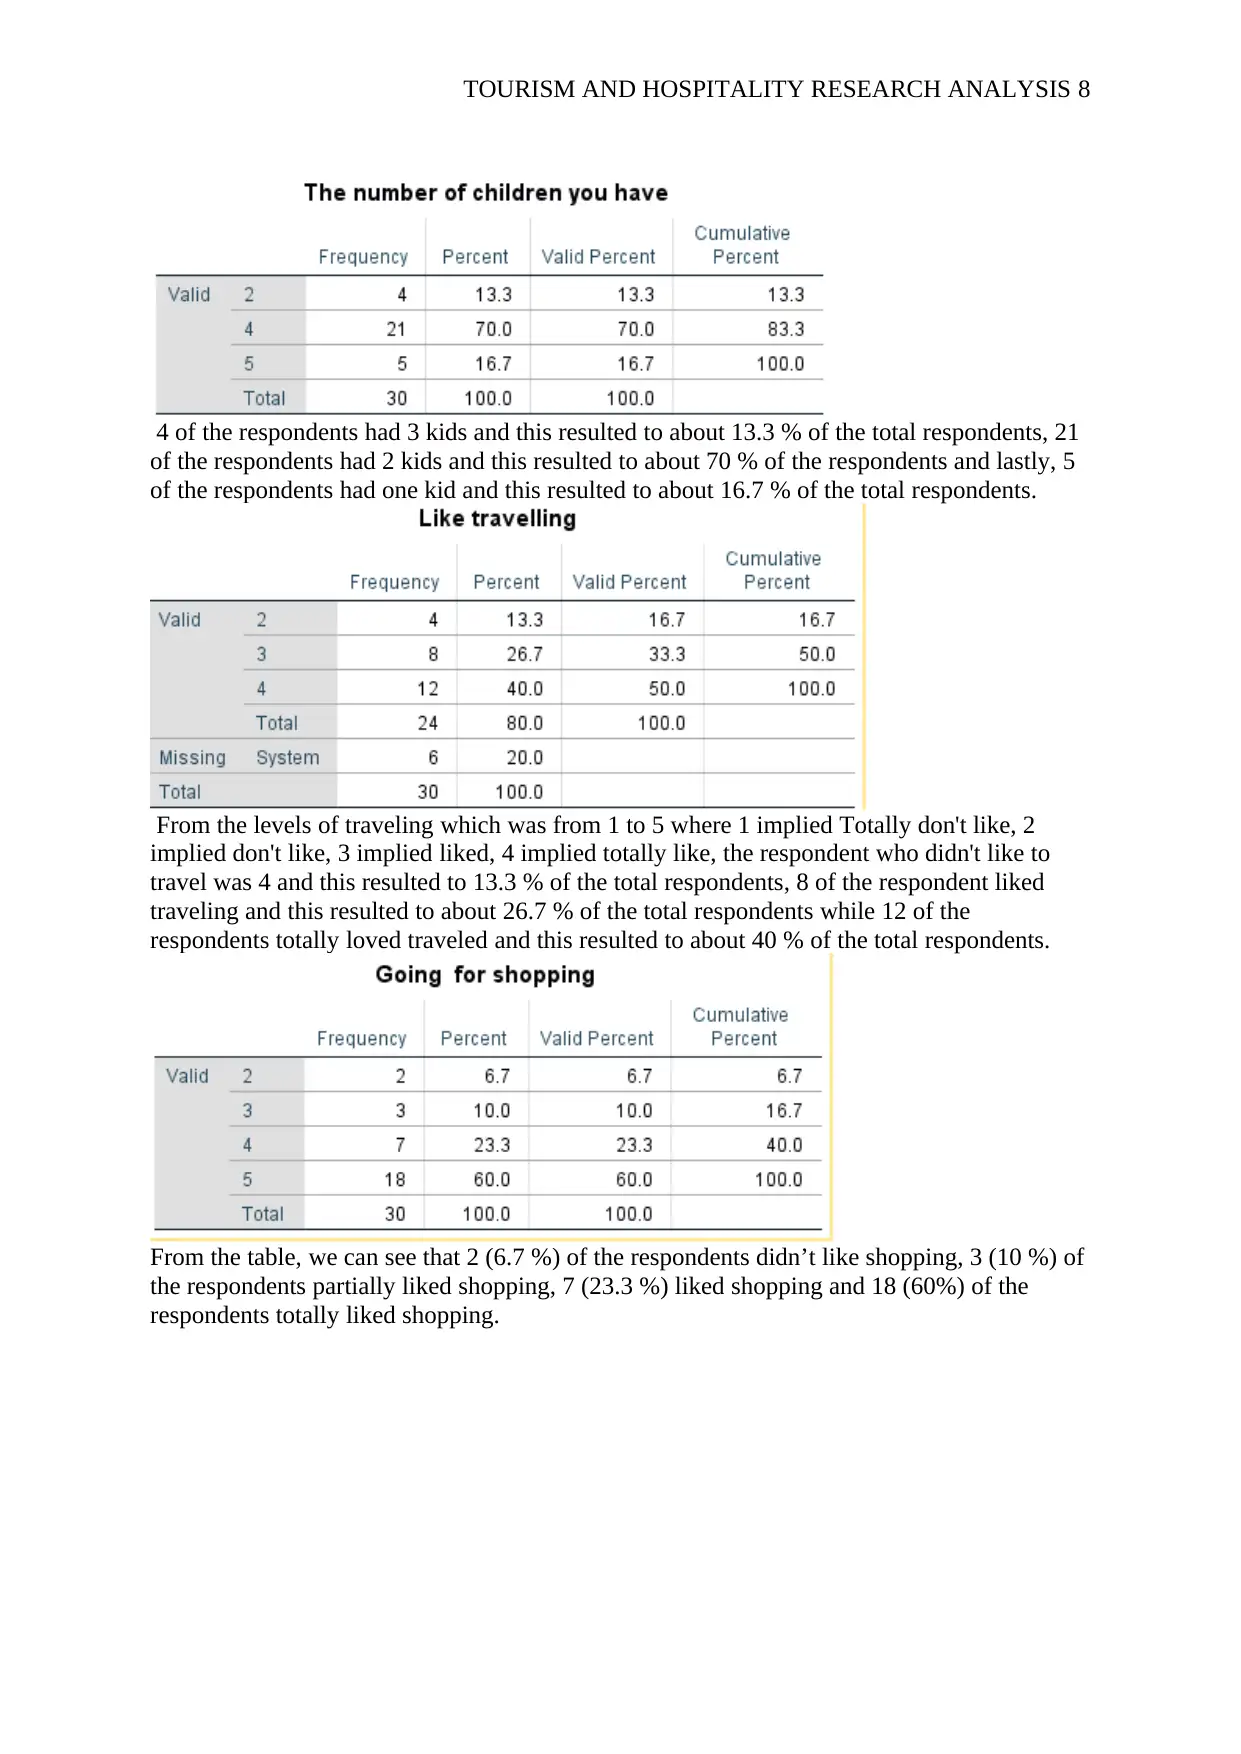
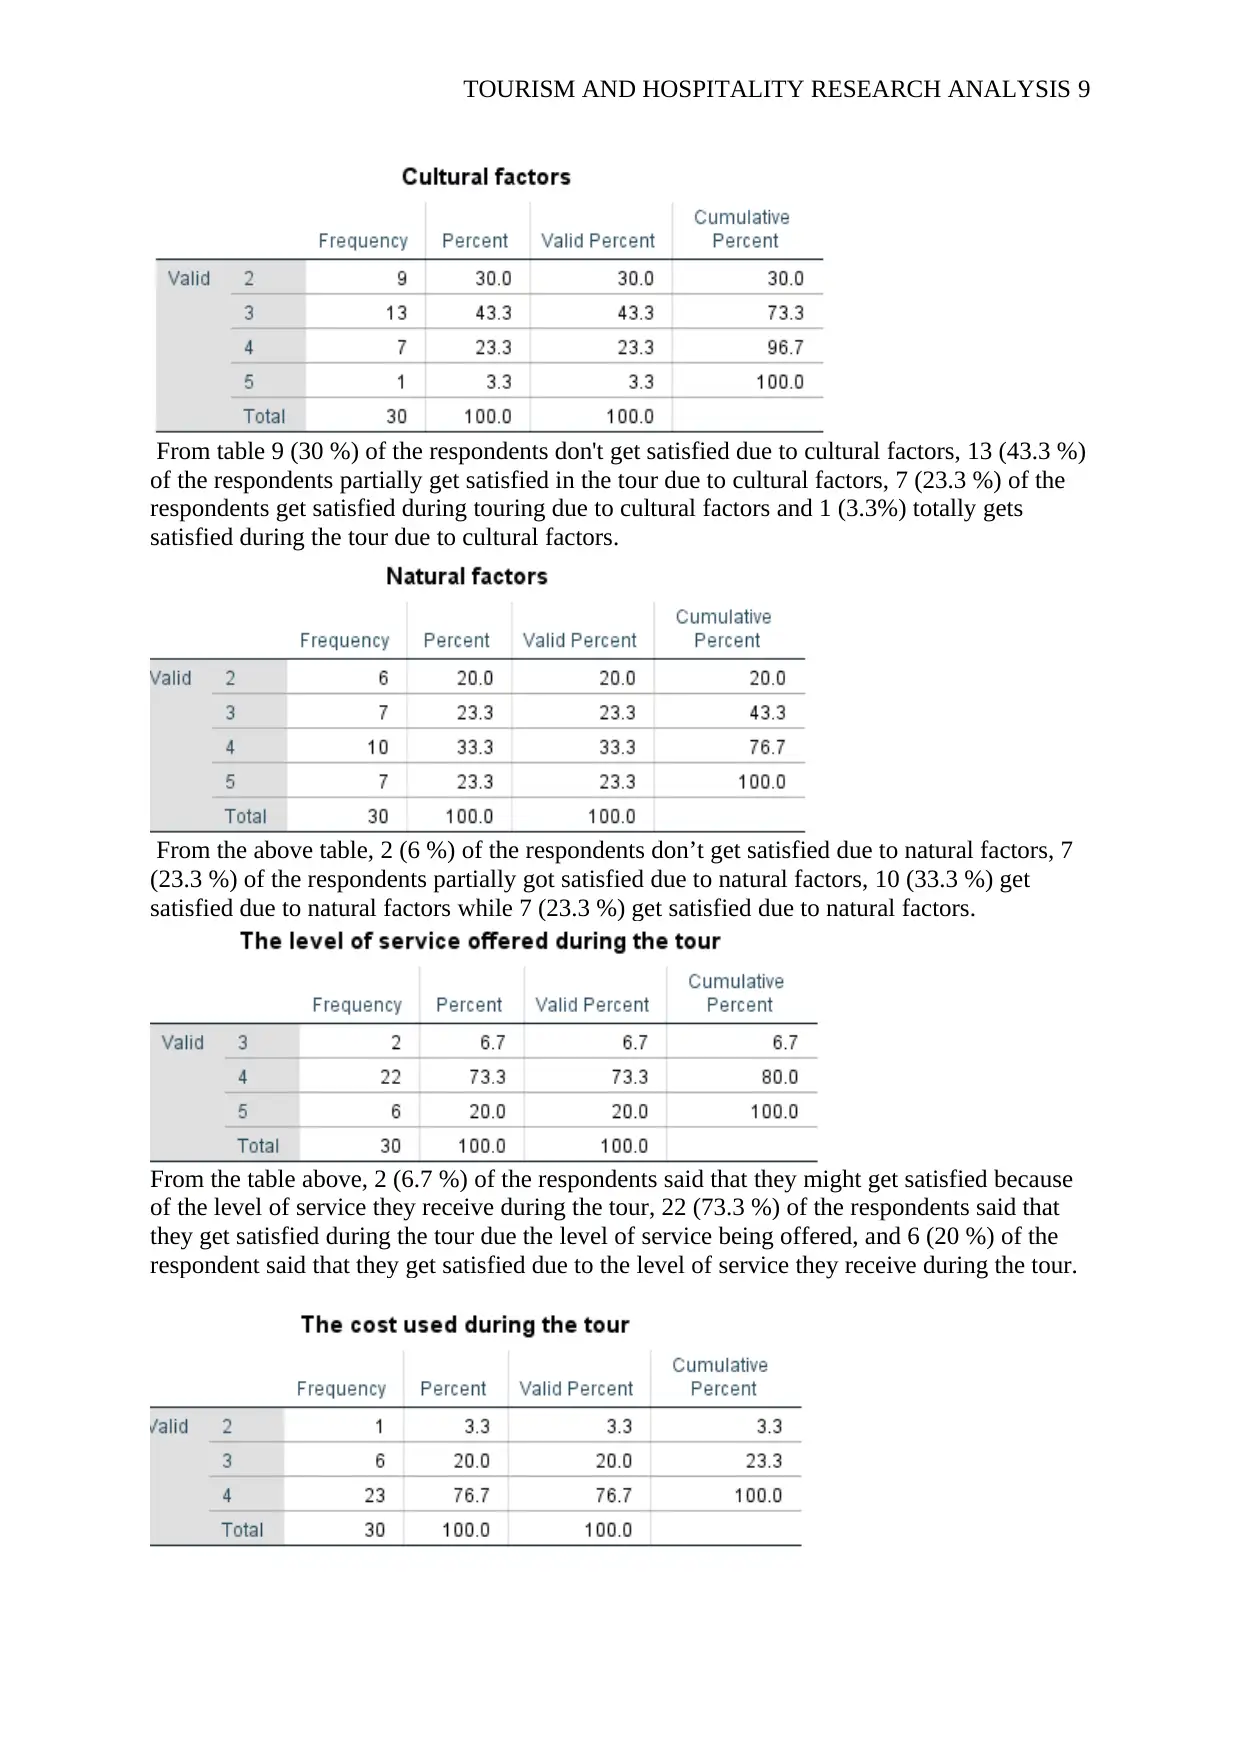
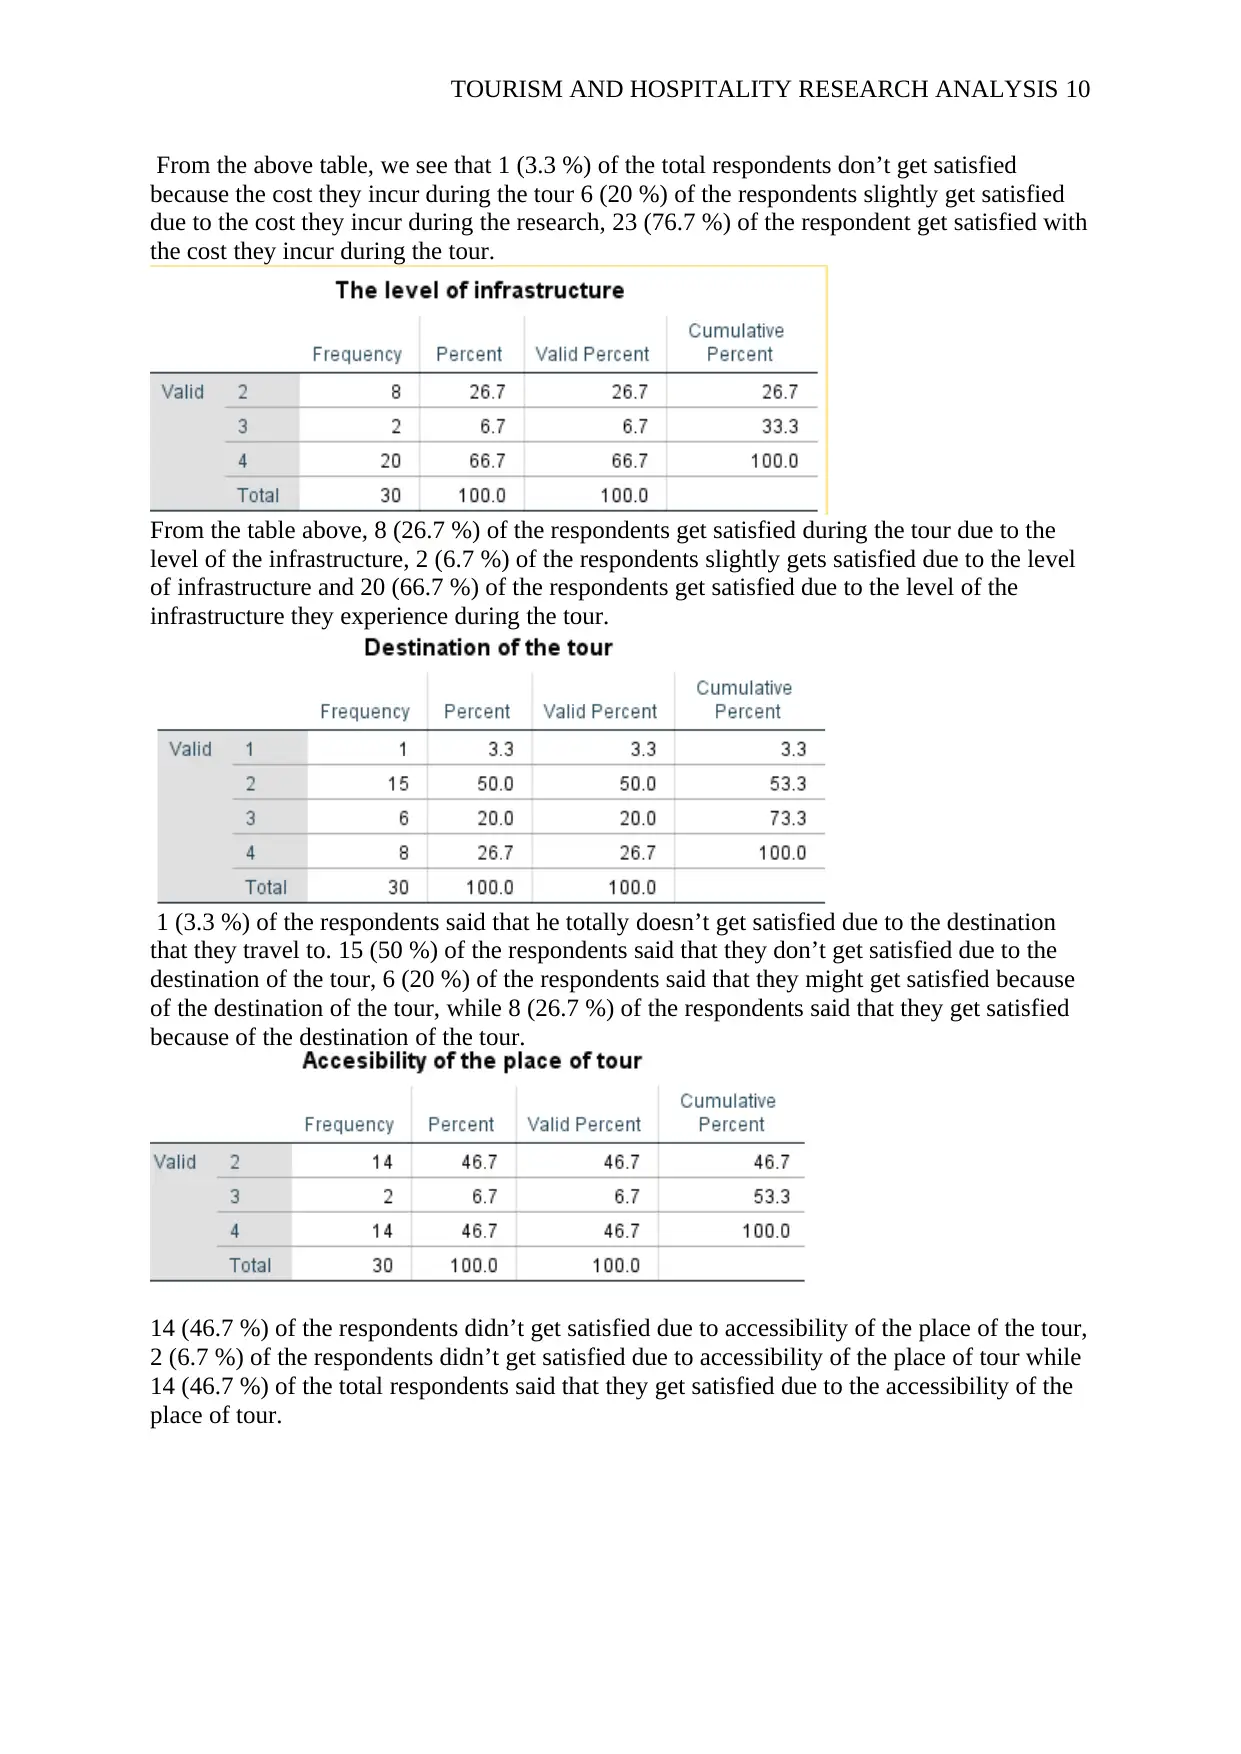
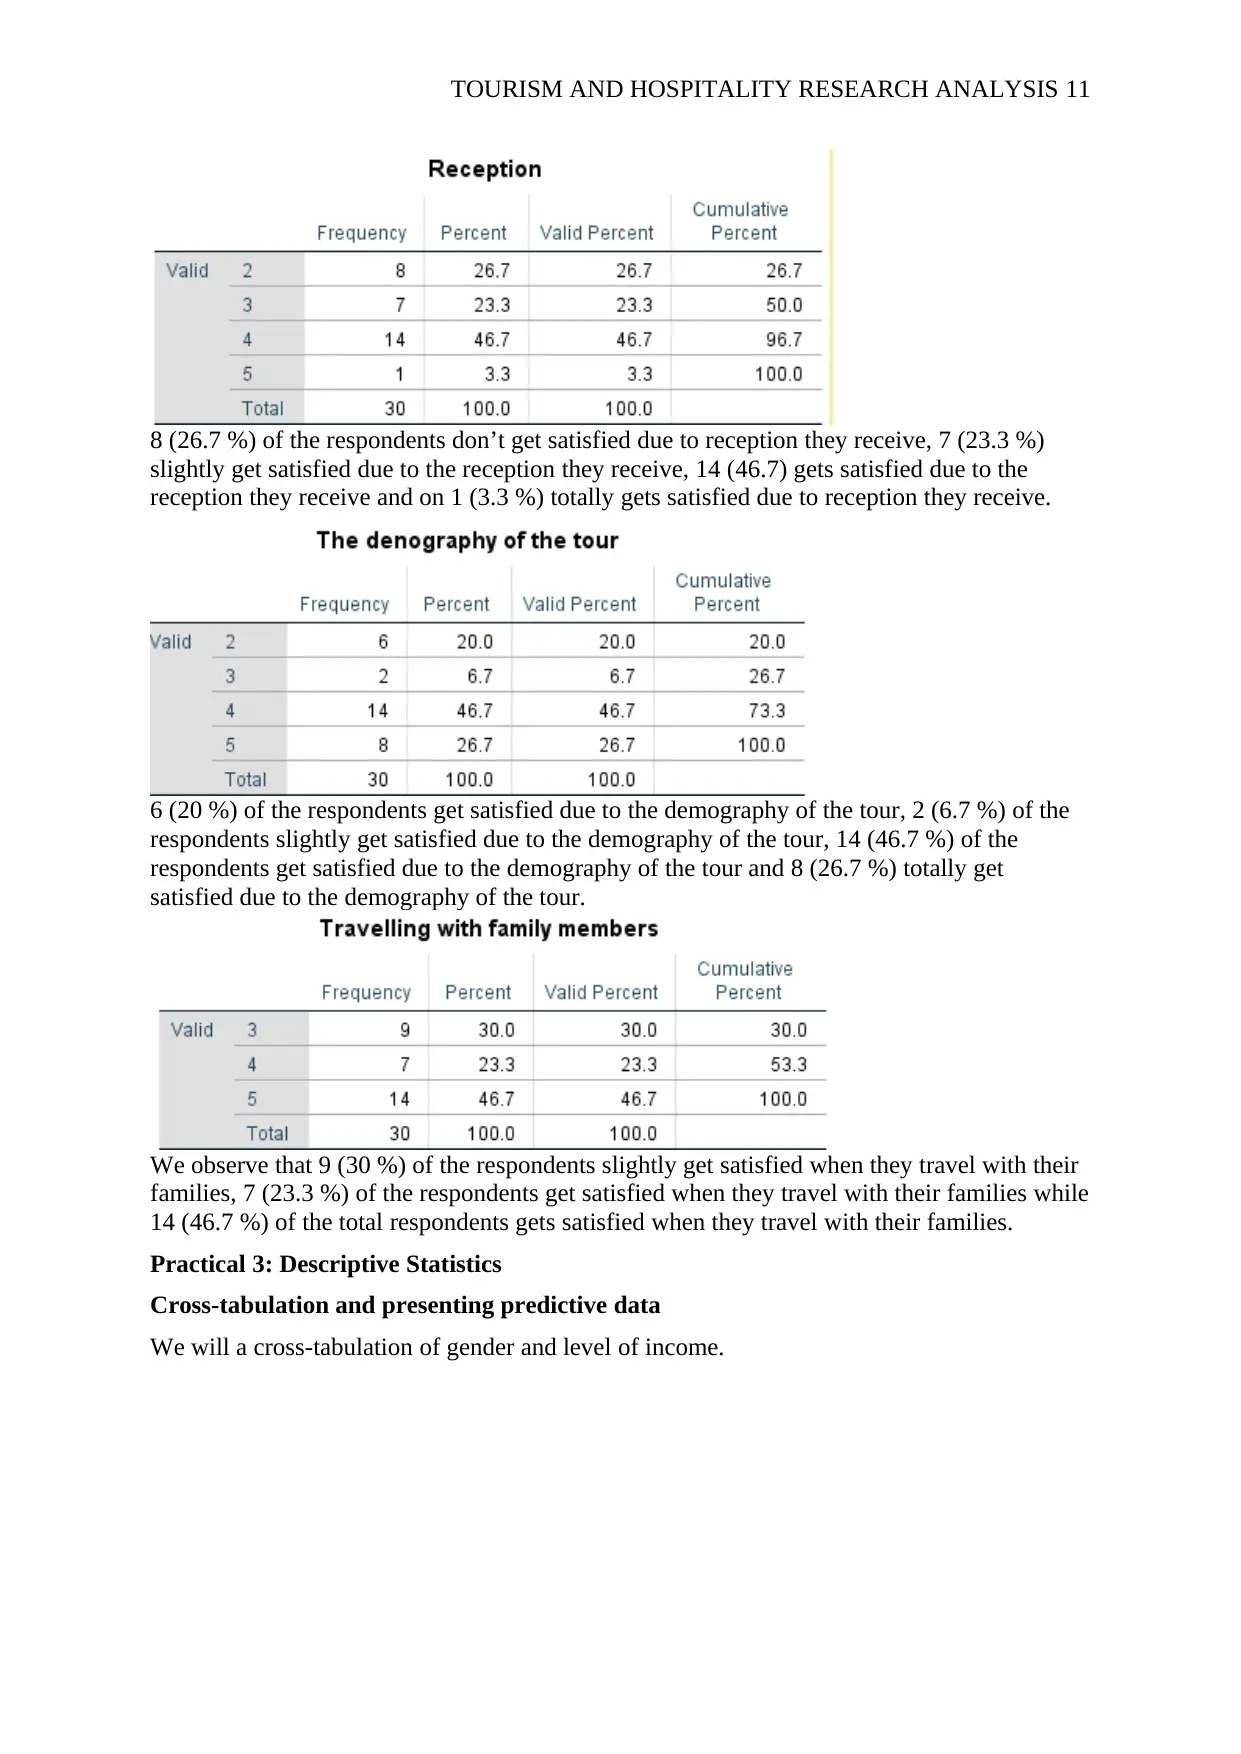
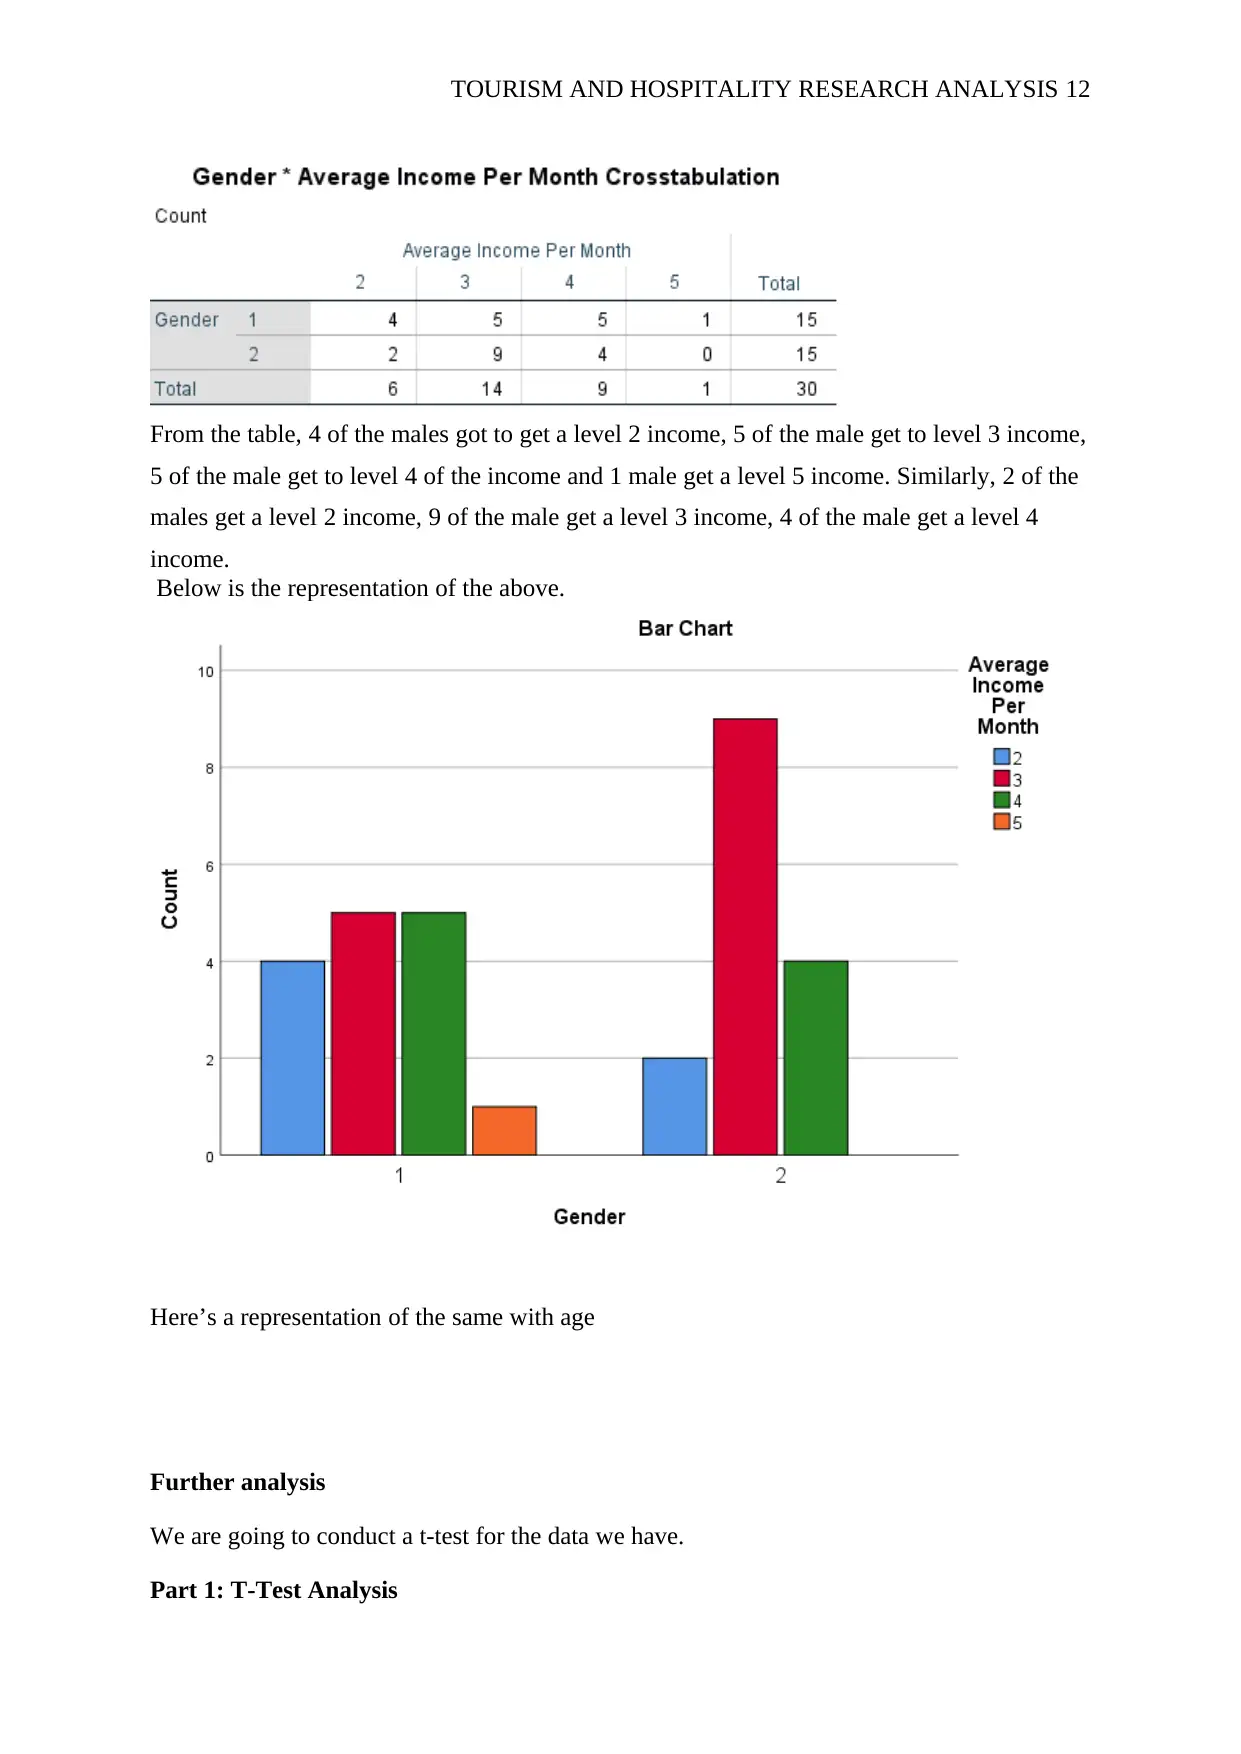
This research report analyzes tourist satisfaction within the tourism and hospitality sector using a mixed-methods approach. The research begins with a questionnaire design incorporating both nominal, ordinal, and scale data types to gather information on demographics and satisfaction levels related to various factors such as shopping, cultural aspects, natural features, service quality, cost, infrastructure, destination, accessibility, and reception. Data collected from 30 random tourists is then entered into SPSS for descriptive statistical analysis, including calculating the mean, mode, median, standard deviation, and frequencies for each variable. Cross-tabulation is used to explore relationships between variables, such as gender and income level, providing insights into tourist preferences and satisfaction drivers. The report presents detailed findings on demographic characteristics of the respondents and their satisfaction levels concerning different aspects of their tourism experiences.
Document Page
TOURISM AND HOSPITALITY RESEARCH ANALYSIS 1
STUDENTS NAME
NAME OF THE COURSE
PROFESSOR NAME
NAME OF THE SCHOOL
CITY OF THE SCHOOL
DATE
tabler-icon-diamond-filled.svg

Paraphrase This Document

Need a fresh take? Get an instant paraphrase of this document with our AI Paraphraser
Document Page
TOURISM AND HOSPITALITY RESEARCH ANALYSIS 2
TOURISM AND HOSPITALITY RESEARCH ANALYSIS
The main aim of the research is to determine current tendencies and people's behaviors in
different geographical locations. We will conduct a research trying to determine tourist
satisfactions on some factors. The research will be categorized into 4 different parts:
i) Questionnaire design
ii) Data Entry
iii) Statistical testing – Descriptive analysis
iv) Statistical testing – T-test
We will come up with a well-calculated questionnaire, use the questionnaire to conduct a
study, get the data, enter the data into SPSS software and later do some statistical testing for
the dataset.
Questionnaire design and data entry
Designing a questionnaire requires one to know the exact information he or she requires. In
our situation, we want to conduct research a tourist satisfaction. We will create a 20 questions
questionnaire to tackle this topic. We will create a questionnaire that has answers scaling
from 1 to 5, where 1 = Totally disagree, 2 = Disagree, 3 = Neutral, 4 = Agree and 5 = Totally
agree. So will have a data that contains a numerical scale from 1 to 5. We should also identify
the type of data to be used in the questionnaire. This is will help us in data entry using SPSS.
In SPSS, we have three types of data, i.e. nominal, ordinal and interval. Nominal can be used
when the values of the data are categorical with no intrinsic ranking e.g. Gender. Ordinal is
used when the values are categorical with intrinsic ranking. For example, the level of
satisfaction that has a scale of 1 – 5. Lastly, the scale is used in values that represented
ordered categories e.g. Age, Income and score in exams. For this research, color is
categorized as nominal, the temperature is categorized as scale, the job is categorized as
nominal, age is categorized as scale, level of satisfaction, agreement/disagreement, and
income as scale. Below is a structure of the questionnaire:
The general background of the respondent
1. What is gender?
Male Female
2. What is your average age?
18-26 27-33 34-41 42-50
over
50
3. What is your average income per month in RM?
Up to 35,000
35,001 -
50,000
50,001 -
65,000
65,001 -
80,000 Above 80,000
4. What's your level of the job?
Entry Level Supervisor Manager Director/ Vice Chiefs
Document Page
TOURISM AND HOSPITALITY RESEARCH ANALYSIS 3
President
5. What is your level of education?
Others
Secondary
School Diploma Higher diploma Bachelor degree
6. What is your religion?
Christian Muslim Hindu Malay None
7. Marital status
Married Divorced Single Widow Others
8. How many children do you have?
3 2 1 None Others
The following questions are going to be answered using the key below as a guide
1 = Strongly Disagree, 2 = Disagree, 3 = Agree, 4 = Totally Agree
9. Do you like touring?
1 2 3 4
10. How to do that these factors affect your level of satisfaction.
The following questions are going to be answered using the key below as a guide
1 = Strongly Disagree, 2 = Disagree, 3 = Agree, 4 = Totally Agree
1 2 3 4 5
10 Going shopping
11 Cultural factors
12 Natural Factors
13 The service offered during the tour
14 The cost used during the tour
15 The level of infrastructure
16 Reception
17 The destination of the tour
18 The accessibility of the tour place
19 The demography of the tourists
20 Traveling with your family
Document Page
TOURISM AND HOSPITALITY RESEARCH ANALYSIS 4
Descriptive statistic
After designing our questionnaire, we are going to conduct the research using it. We will use
the questionnaire as a method of data collection. We will give 30 random tourists to answer
all the questions in the questionnaire. Later, we will enter the data into SPSS in a systematic
way for easier understanding. We will save our data as Travel Data Students in SPSS. We
will describe the data using SPSS. We will calculate the mean, mode, media for all the
variables. We designed the variables in such a way that we named the variable in the name
section in SPSS and described it in the label section.
Below is the mean, mode, median, the standard deviation of the 20 variables.
tabler-icon-diamond-filled.svg

Paraphrase This Document

Need a fresh take? Get an instant paraphrase of this document with our AI Paraphraser
Document Page
TOURISM AND HOSPITALITY RESEARCH ANALYSIS 5
Sum 98 114 125 115
The above are the mean, mode, median, Standard deviation, variance, the sum of all the
variables.
Gender:
We have that the number and female who participated in the research are the same i.e. they
have the same frequencies. They both have 50%.
Document Page
TOURISM AND HOSPITALITY RESEARCH ANALYSIS 6
The table above shows the frequencies of the levels in the age and their corresponding
percentages. From the above table, we can conclude that the age of 18 – 26 who was part of
the research was 4 which signified 13.3 % of the total participant, 27 – 33 were 9 which was
30 % of the total, 34 – 41 were 14 was 46.7 % of the total and 42 -50 were 3 was 10 % of the
total participant.
6 of the participants had a salary of between 35,001- 50,000 which amounted to 20% of the
total participants, 14 of the participants were of ages between 50,001 – 65,000 which
amounted to 46.7 %, 9 of the participants were receiving a salary of between 65,001 – 80,000
which amounted to 30% and only one of the participants was receiving a salary above 80,000
and this amounted to 3.3 % of the total.
6 of the participants were supervisors and this amounted to 20 % of the total participants. 17
of the participants were managers and this amounted to 56.7 % of the total participants and 7
of the participants were directors and this amounted to 23.3 % of the total participants.
Document Page
TOURISM AND HOSPITALITY RESEARCH ANALYSIS 7
Below are the frequencies of other variables.
From the table above, it is evident that the 20 of the respondent had finished diploma, this is
66.7 % of the total respondents, 8 of the respondents had higher diplomas and this resulted to
26.7 % of the total respondents and the remaining 5 had bachelor degrees and this resulted in
6.7 % of the total respondents.
From the table, 15 of the respondents are single and this is about 50 % of the respondents, 9
of the respondents are Widows and this resulted to about 30 % of the respondent while others
accumulated to about 20 % of the total respondents.
Out of 30 respondents, 12 of them were Christians and this resulted to about 40 % of the
total, 17 of the respondents were Muslims and this resulted to about 56.7 % of the total
respondents and one of the total respondents was a Malay and this was 3.3 % of the total
correspondence.
tabler-icon-diamond-filled.svg

Paraphrase This Document

Need a fresh take? Get an instant paraphrase of this document with our AI Paraphraser
Document Page
TOURISM AND HOSPITALITY RESEARCH ANALYSIS 8
4 of the respondents had 3 kids and this resulted to about 13.3 % of the total respondents, 21
of the respondents had 2 kids and this resulted to about 70 % of the respondents and lastly, 5
of the respondents had one kid and this resulted to about 16.7 % of the total respondents.
From the levels of traveling which was from 1 to 5 where 1 implied Totally don't like, 2
implied don't like, 3 implied liked, 4 implied totally like, the respondent who didn't like to
travel was 4 and this resulted to 13.3 % of the total respondents, 8 of the respondent liked
traveling and this resulted to about 26.7 % of the total respondents while 12 of the
respondents totally loved traveled and this resulted to about 40 % of the total respondents.
From the table, we can see that 2 (6.7 %) of the respondents didn’t like shopping, 3 (10 %) of
the respondents partially liked shopping, 7 (23.3 %) liked shopping and 18 (60%) of the
respondents totally liked shopping.
Document Page
TOURISM AND HOSPITALITY RESEARCH ANALYSIS 9
From table 9 (30 %) of the respondents don't get satisfied due to cultural factors, 13 (43.3 %)
of the respondents partially get satisfied in the tour due to cultural factors, 7 (23.3 %) of the
respondents get satisfied during touring due to cultural factors and 1 (3.3%) totally gets
satisfied during the tour due to cultural factors.
From the above table, 2 (6 %) of the respondents don’t get satisfied due to natural factors, 7
(23.3 %) of the respondents partially got satisfied due to natural factors, 10 (33.3 %) get
satisfied due to natural factors while 7 (23.3 %) get satisfied due to natural factors.
From the table above, 2 (6.7 %) of the respondents said that they might get satisfied because
of the level of service they receive during the tour, 22 (73.3 %) of the respondents said that
they get satisfied during the tour due the level of service being offered, and 6 (20 %) of the
respondent said that they get satisfied due to the level of service they receive during the tour.
Document Page
TOURISM AND HOSPITALITY RESEARCH ANALYSIS 10
From the above table, we see that 1 (3.3 %) of the total respondents don’t get satisfied
because the cost they incur during the tour 6 (20 %) of the respondents slightly get satisfied
due to the cost they incur during the research, 23 (76.7 %) of the respondent get satisfied with
the cost they incur during the tour.
From the table above, 8 (26.7 %) of the respondents get satisfied during the tour due to the
level of the infrastructure, 2 (6.7 %) of the respondents slightly gets satisfied due to the level
of infrastructure and 20 (66.7 %) of the respondents get satisfied due to the level of the
infrastructure they experience during the tour.
1 (3.3 %) of the respondents said that he totally doesn’t get satisfied due to the destination
that they travel to. 15 (50 %) of the respondents said that they don’t get satisfied due to the
destination of the tour, 6 (20 %) of the respondents said that they might get satisfied because
of the destination of the tour, while 8 (26.7 %) of the respondents said that they get satisfied
because of the destination of the tour.
14 (46.7 %) of the respondents didn’t get satisfied due to accessibility of the place of the tour,
2 (6.7 %) of the respondents didn’t get satisfied due to accessibility of the place of tour while
14 (46.7 %) of the total respondents said that they get satisfied due to the accessibility of the
place of tour.
tabler-icon-diamond-filled.svg

Paraphrase This Document

Need a fresh take? Get an instant paraphrase of this document with our AI Paraphraser
Document Page
TOURISM AND HOSPITALITY RESEARCH ANALYSIS 11
8 (26.7 %) of the respondents don’t get satisfied due to reception they receive, 7 (23.3 %)
slightly get satisfied due to the reception they receive, 14 (46.7) gets satisfied due to the
reception they receive and on 1 (3.3 %) totally gets satisfied due to reception they receive.
6 (20 %) of the respondents get satisfied due to the demography of the tour, 2 (6.7 %) of the
respondents slightly get satisfied due to the demography of the tour, 14 (46.7 %) of the
respondents get satisfied due to the demography of the tour and 8 (26.7 %) totally get
satisfied due to the demography of the tour.
We observe that 9 (30 %) of the respondents slightly get satisfied when they travel with their
families, 7 (23.3 %) of the respondents get satisfied when they travel with their families while
14 (46.7 %) of the total respondents gets satisfied when they travel with their families.
Practical 3: Descriptive Statistics
Cross-tabulation and presenting predictive data
We will a cross-tabulation of gender and level of income.
Document Page
TOURISM AND HOSPITALITY RESEARCH ANALYSIS 12
From the table, 4 of the males got to get a level 2 income, 5 of the male get to level 3 income,
5 of the male get to level 4 of the income and 1 male get a level 5 income. Similarly, 2 of the
males get a level 2 income, 9 of the male get a level 3 income, 4 of the male get a level 4
income.
Below is the representation of the above.
Here’s a representation of the same with age
Further analysis
We are going to conduct a t-test for the data we have.
Part 1: T-Test Analysis
chevron_up_icon
1 out of 15
circle_padding
hide_on_mobile
zoom_out_icon
[object Object]