University Name: Tourism and Hospitality Simulation Report Analysis

Verified

Added on  2020/03/16

|6
|567
|57
Report
AI Summary
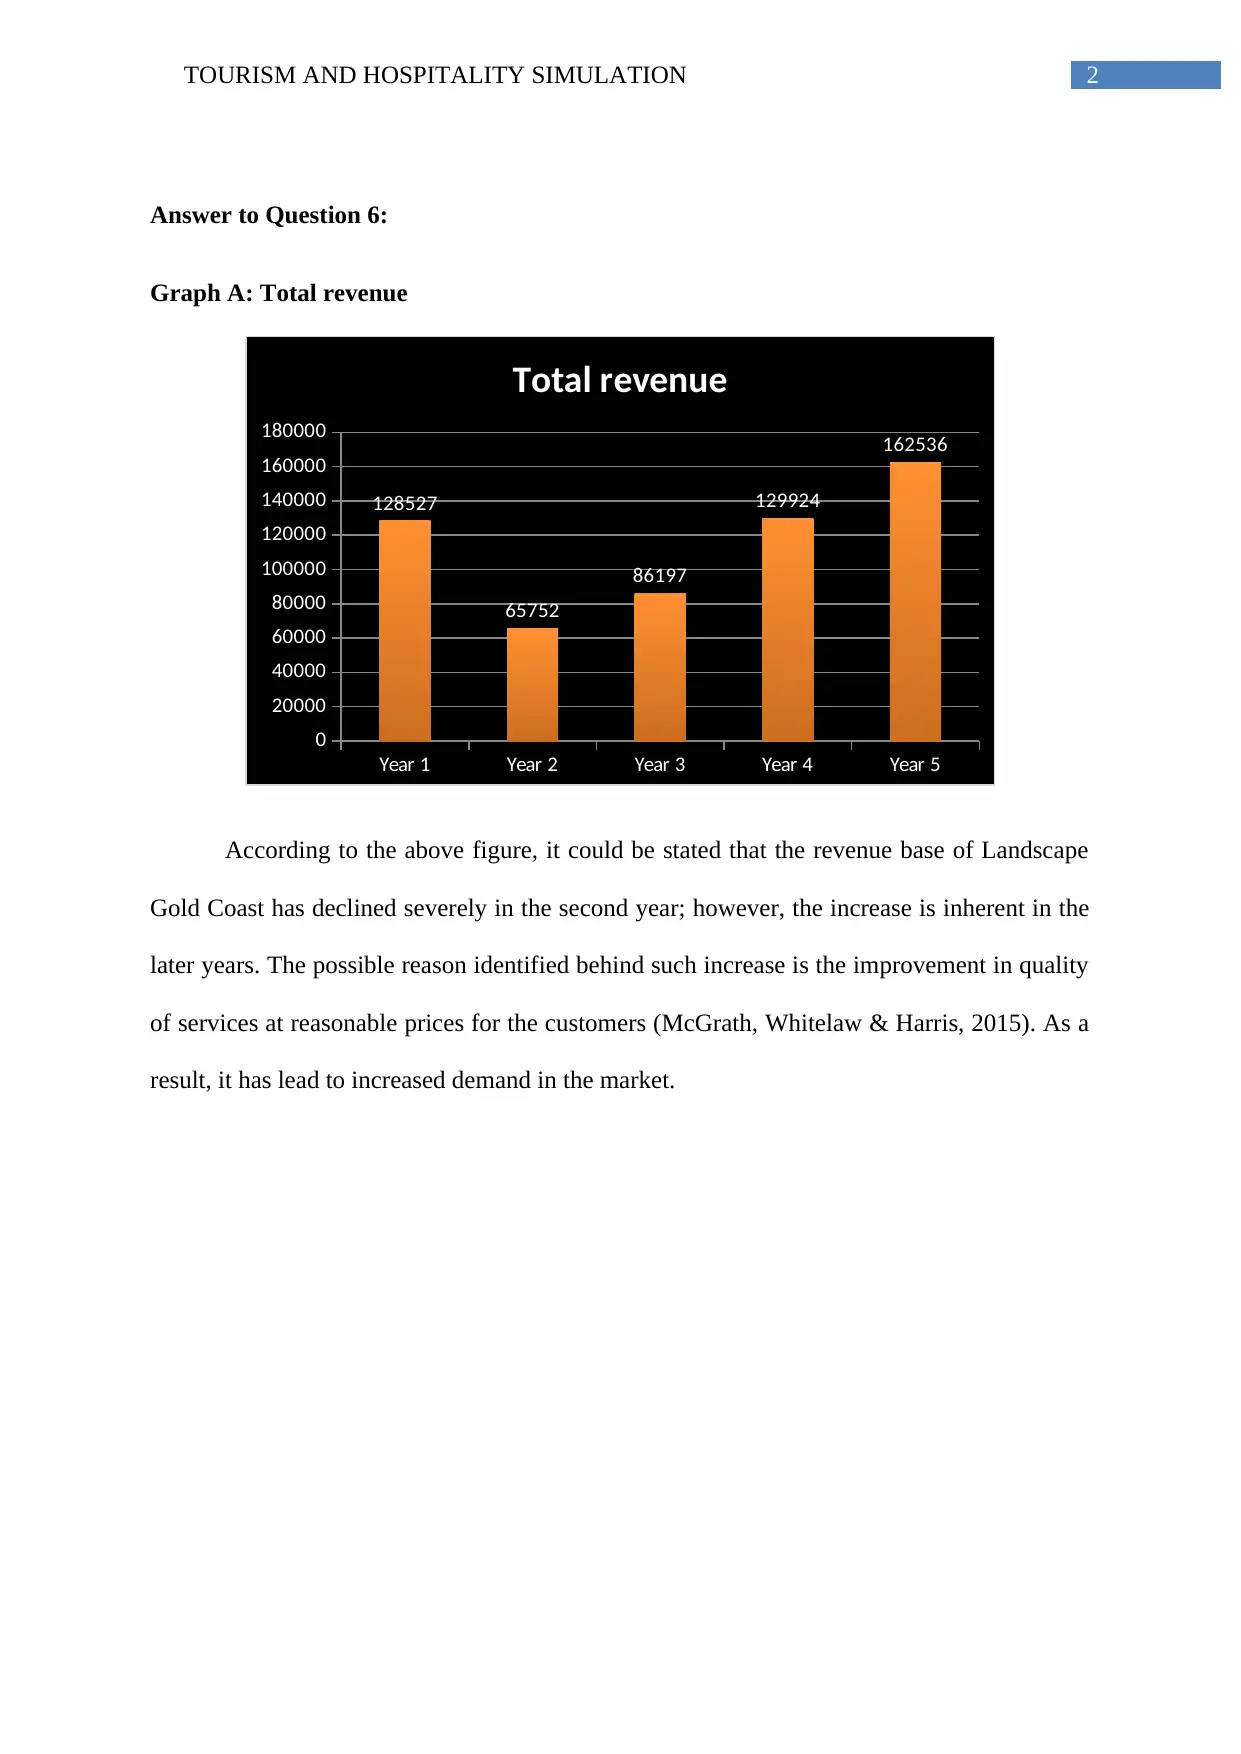
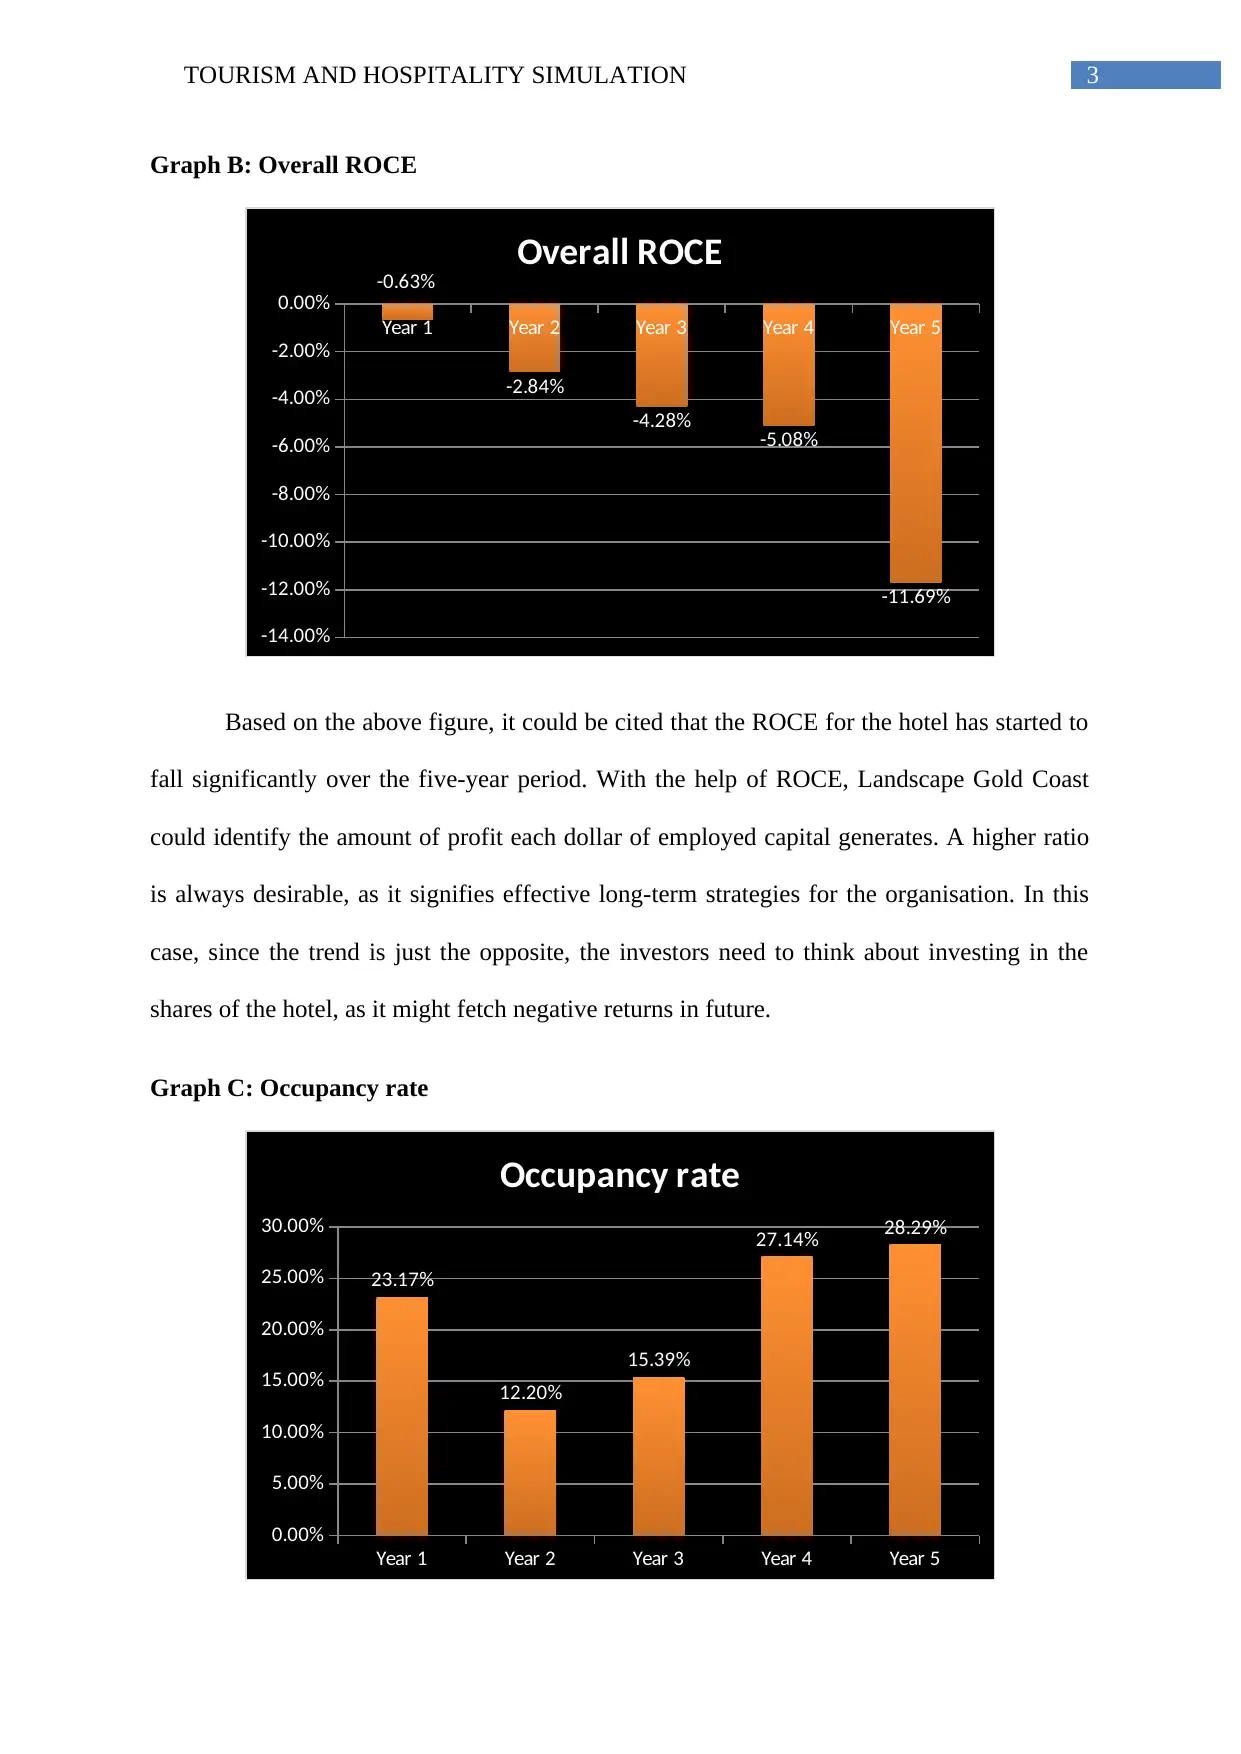
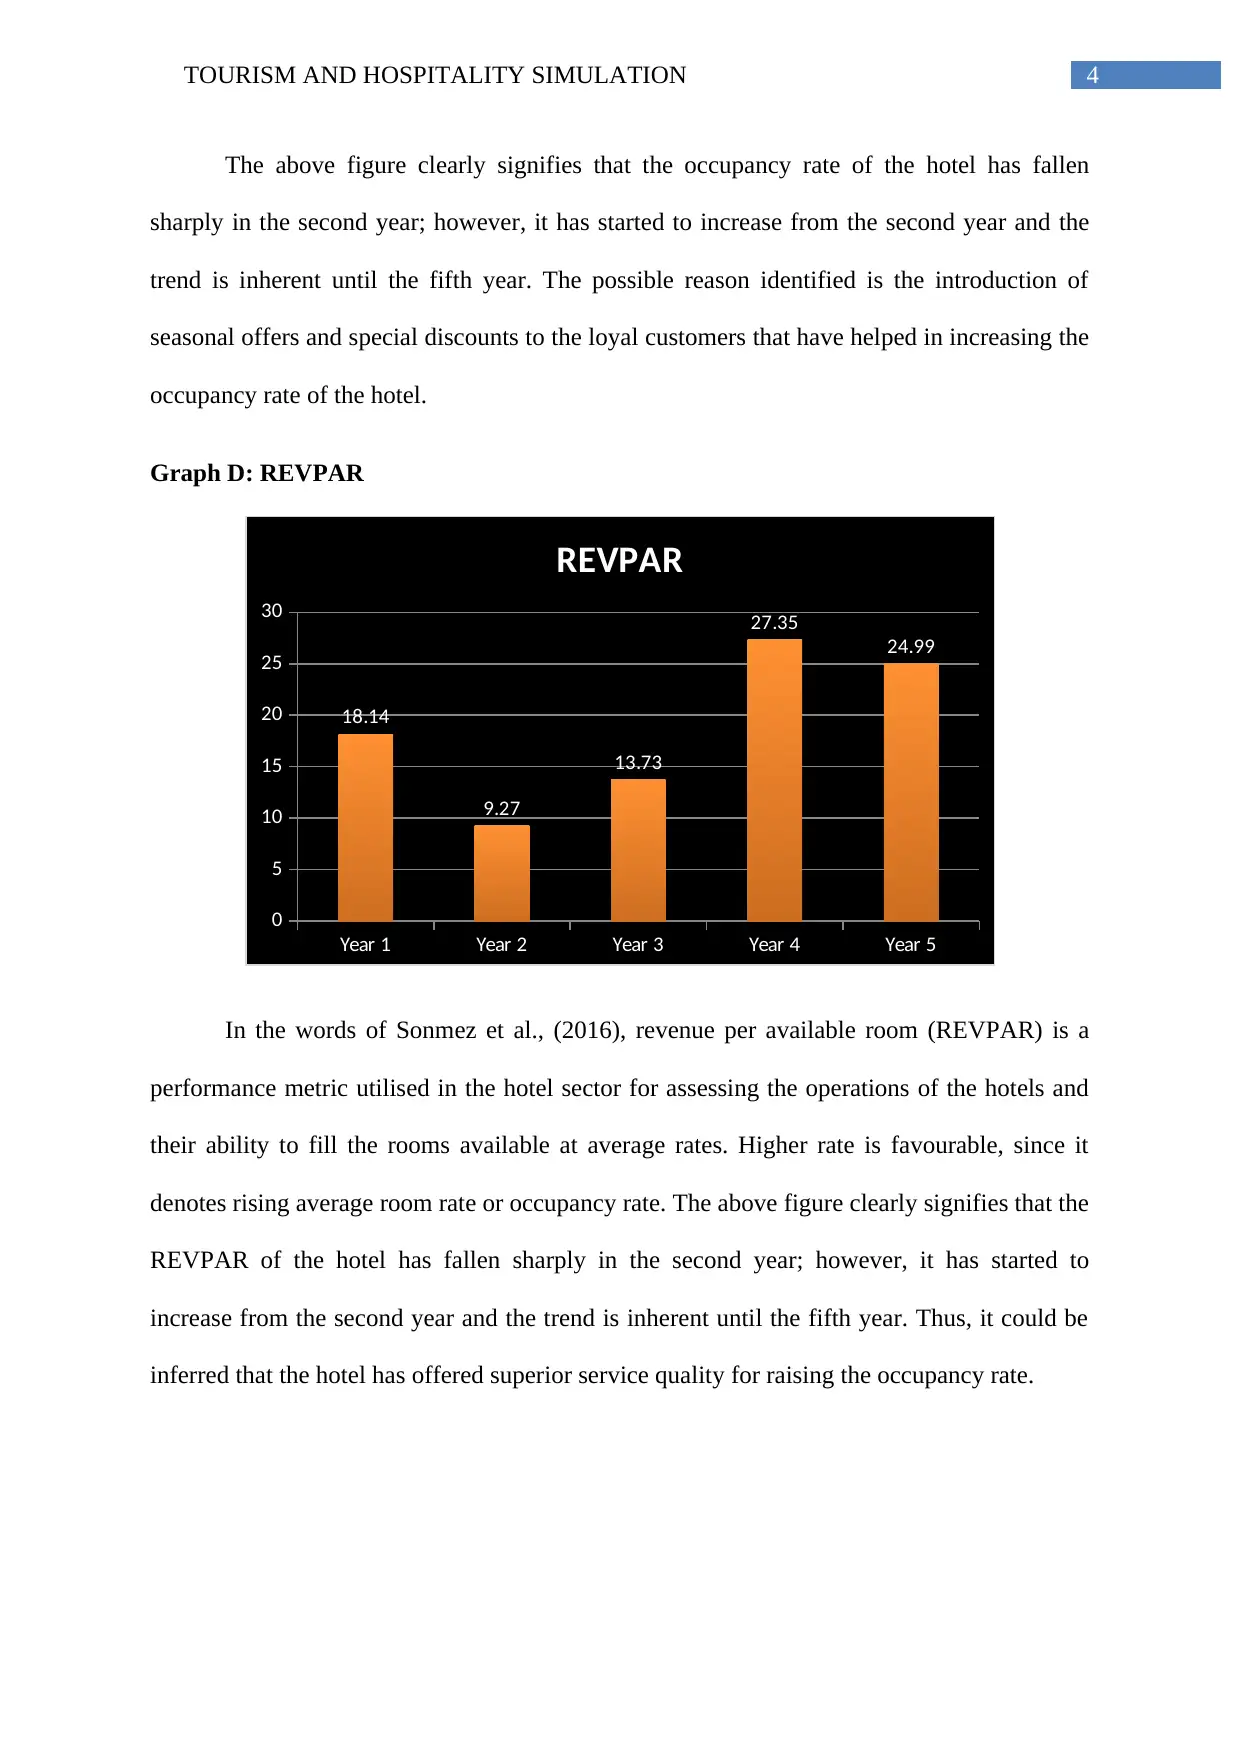
This report analyzes a tourism and hospitality simulation, focusing on key performance indicators and strategic insights. The report examines the revenue, occupancy rate, and REVPAR of a hotel, highlighting trends and potential reasons behind the fluctuations. The analysis includes an assessment of the Return on Capital Employed (ROCE), providing valuable insights into the hotel's financial performance. The report also explores the impact of seasonal offers and discounts on occupancy rates. The study uses graphs to visually represent the data, making the analysis accessible and easy to understand. The report also references relevant academic sources to support its findings. The report concludes with a comprehensive overview of the hotel's performance and strategic recommendations.
Document Page
Running head: TOURISM AND HOSPITALITY SIMULATION
Tourism and Hospitality Simulation
Name of the Student:
Name of the University:
Author’s Note:
Course ID:
tabler-icon-diamond-filled.svg

Paraphrase This Document

Need a fresh take? Get an instant paraphrase of this document with our AI Paraphraser
Document Page
1TOURISM AND HOSPITALITY SIMULATION
Table of Contents
Answer to Question 6:................................................................................................................2
Graph A: Total revenue..........................................................................................................2
Graph B: Overall ROCE........................................................................................................2
Graph C: Occupancy rate.......................................................................................................3
Graph D: REVPAR................................................................................................................4
References:.................................................................................................................................5
Document Page
2TOURISM AND HOSPITALITY SIMULATION
Answer to Question 6:
Graph A: Total revenue
Year 1 Year 2 Year 3 Year 4 Year 5
0
20000
40000
60000
80000
100000
120000
140000
160000
180000
128527
65752
86197
129924
162536
Total revenue
According to the above figure, it could be stated that the revenue base of Landscape
Gold Coast has declined severely in the second year; however, the increase is inherent in the
later years. The possible reason identified behind such increase is the improvement in quality
of services at reasonable prices for the customers (McGrath, Whitelaw & Harris, 2015). As a
result, it has lead to increased demand in the market.
Document Page
3TOURISM AND HOSPITALITY SIMULATION
Graph B: Overall ROCE
Year 1 Year 2 Year 3 Year 4 Year 5
-14.00%
-12.00%
-10.00%
-8.00%
-6.00%
-4.00%
-2.00%
0.00% -0.63%
-2.84%
-4.28% -5.08%
-11.69%
Overall ROCE
Based on the above figure, it could be cited that the ROCE for the hotel has started to
fall significantly over the five-year period. With the help of ROCE, Landscape Gold Coast
could identify the amount of profit each dollar of employed capital generates. A higher ratio
is always desirable, as it signifies effective long-term strategies for the organisation. In this
case, since the trend is just the opposite, the investors need to think about investing in the
shares of the hotel, as it might fetch negative returns in future.
Graph C: Occupancy rate
Year 1 Year 2 Year 3 Year 4 Year 5
0.00%
5.00%
10.00%
15.00%
20.00%
25.00%
30.00%
23.17%
12.20%
15.39%
27.14% 28.29%
Occupancy rate
tabler-icon-diamond-filled.svg

Paraphrase This Document

Need a fresh take? Get an instant paraphrase of this document with our AI Paraphraser
Document Page
4TOURISM AND HOSPITALITY SIMULATION
The above figure clearly signifies that the occupancy rate of the hotel has fallen
sharply in the second year; however, it has started to increase from the second year and the
trend is inherent until the fifth year. The possible reason identified is the introduction of
seasonal offers and special discounts to the loyal customers that have helped in increasing the
occupancy rate of the hotel.
Graph D: REVPAR
Year 1 Year 2 Year 3 Year 4 Year 5
0
5
10
15
20
25
30
18.14
9.27
13.73
27.35
24.99
REVPAR
In the words of Sonmez et al., (2016), revenue per available room (REVPAR) is a
performance metric utilised in the hotel sector for assessing the operations of the hotels and
their ability to fill the rooms available at average rates. Higher rate is favourable, since it
denotes rising average room rate or occupancy rate. The above figure clearly signifies that the
REVPAR of the hotel has fallen sharply in the second year; however, it has started to
increase from the second year and the trend is inherent until the fifth year. Thus, it could be
inferred that the hotel has offered superior service quality for raising the occupancy rate.
Document Page
5TOURISM AND HOSPITALITY SIMULATION
References:
McGrath, M., Whitelaw, P. A., & Harris, A. (2015, December). A Destination Management
Game Simulation for Novice Tourism and Hospitality Students. In ANZAM 2015:
Managing for peak performance: Proceedings of the 29th Annual Conference of the
Australian and New Zealand Academy of Management (pp. 1-14). ANZAM.
Sonmez, S., Apostolopoulos, Y., Lemke, M. K., & Hsieh, Y. J. (2016). Simulation Modeling
of Occupational Health of Tourism and Hospitality Workers.
chevron_up_icon
1 out of 6
circle_padding
hide_on_mobile
zoom_out_icon
[object Object]