Assessment 2: Questionnaire Design and Statistical Analysis Report

Verified

Added on  2023/01/09

|17
|1830
|42
Report
AI Summary
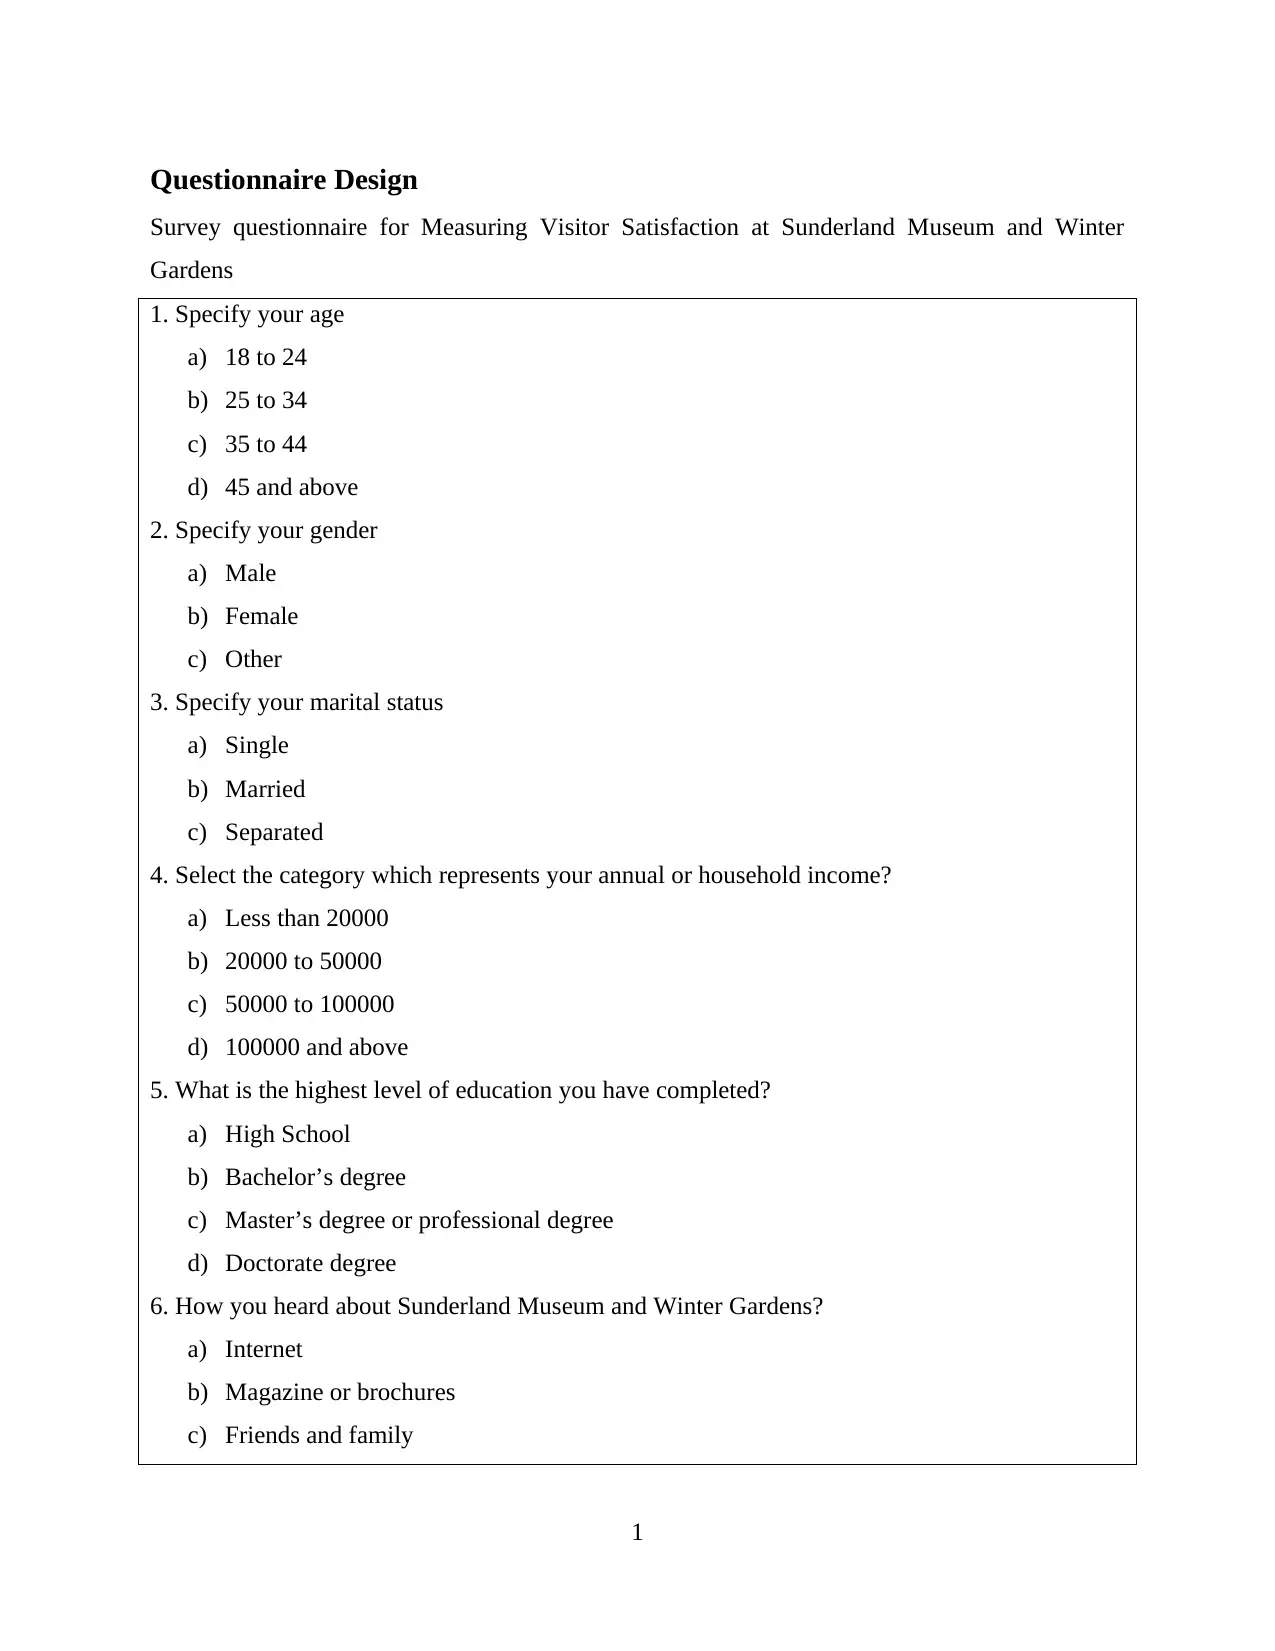
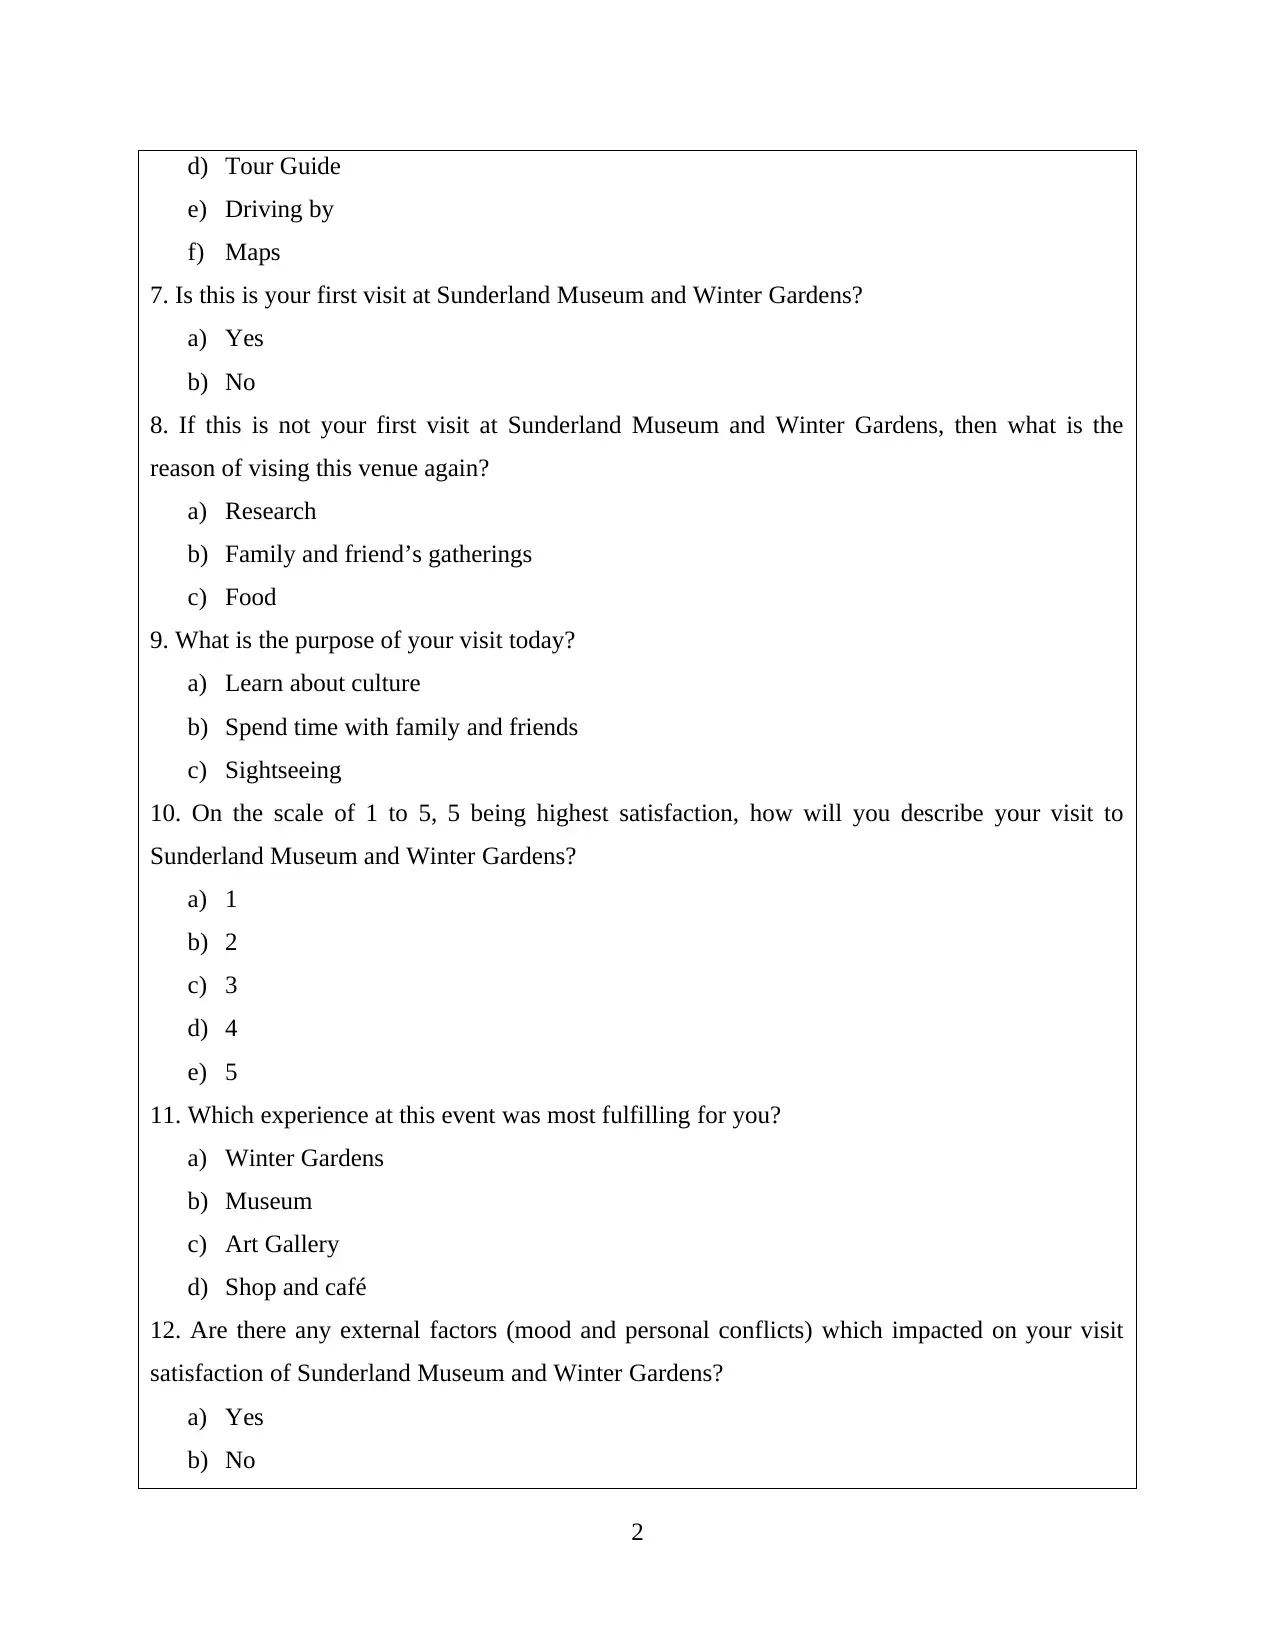
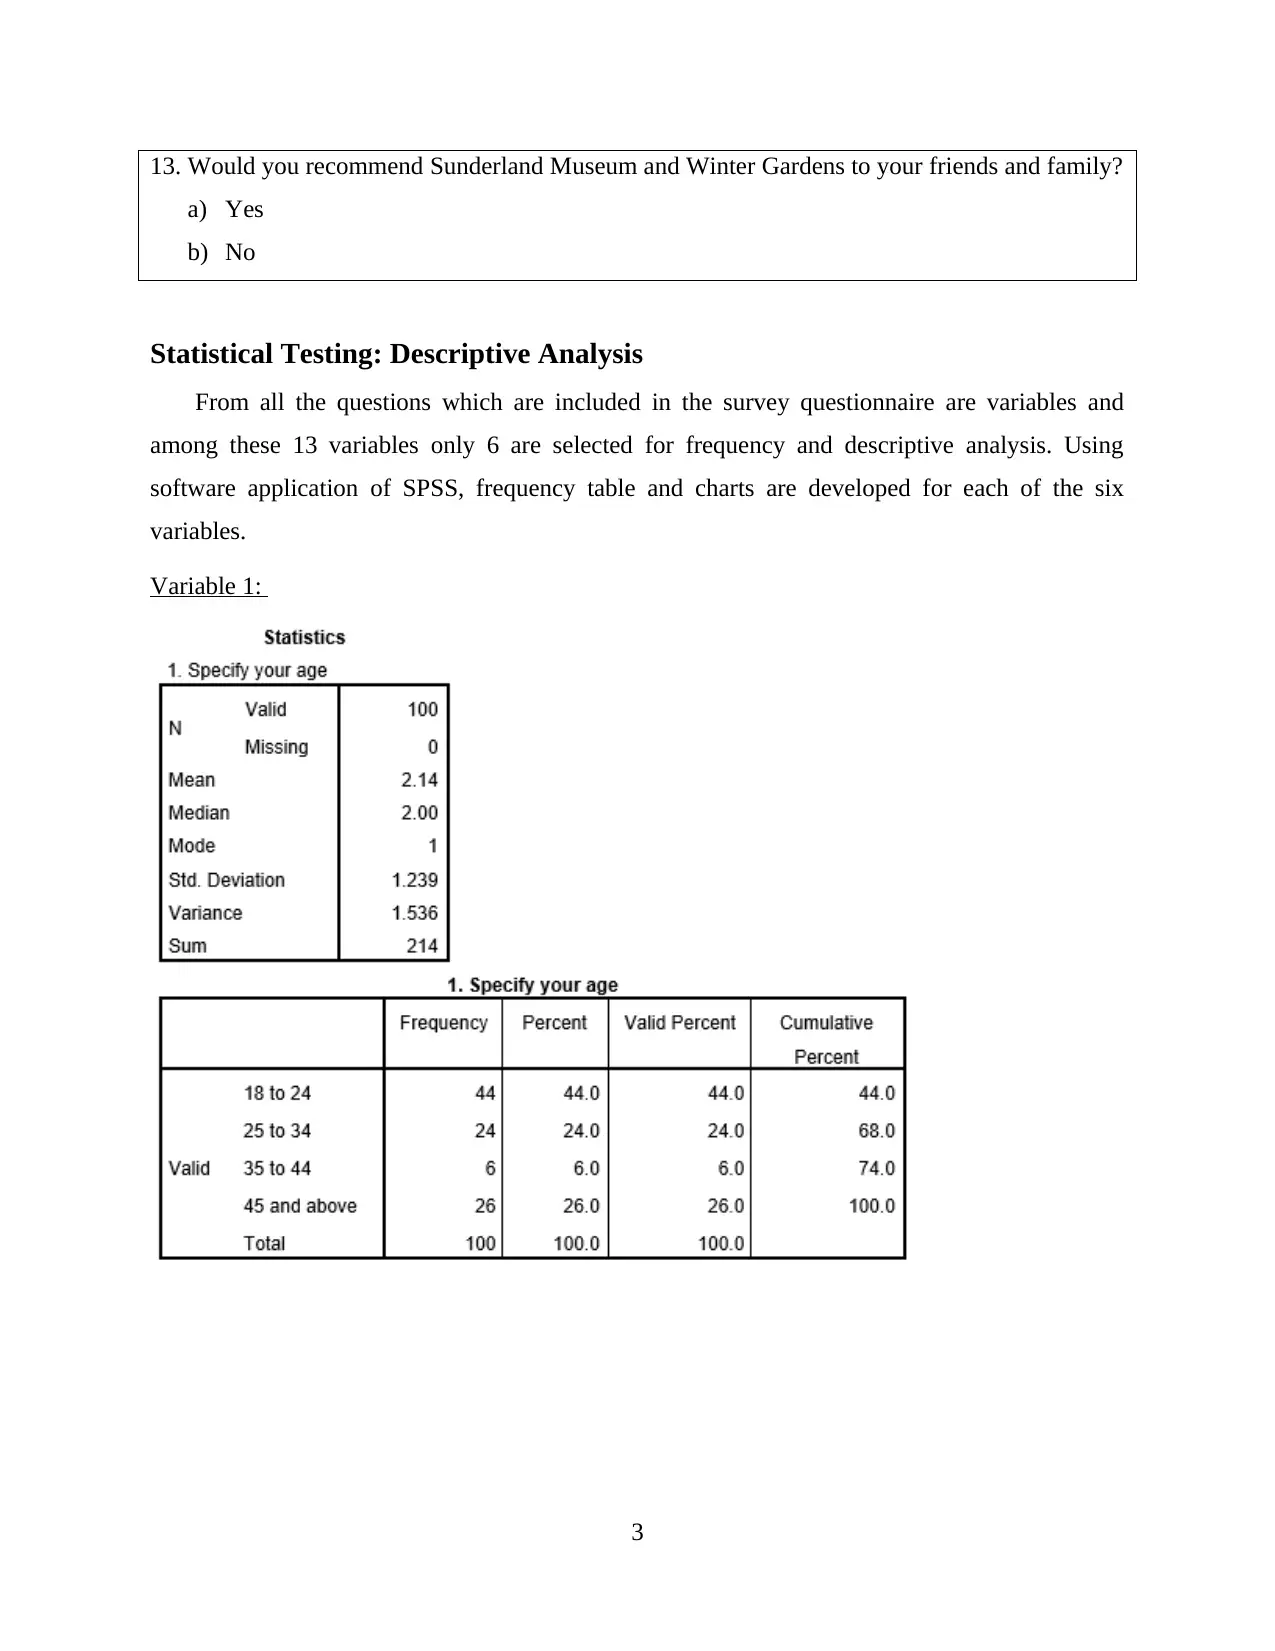
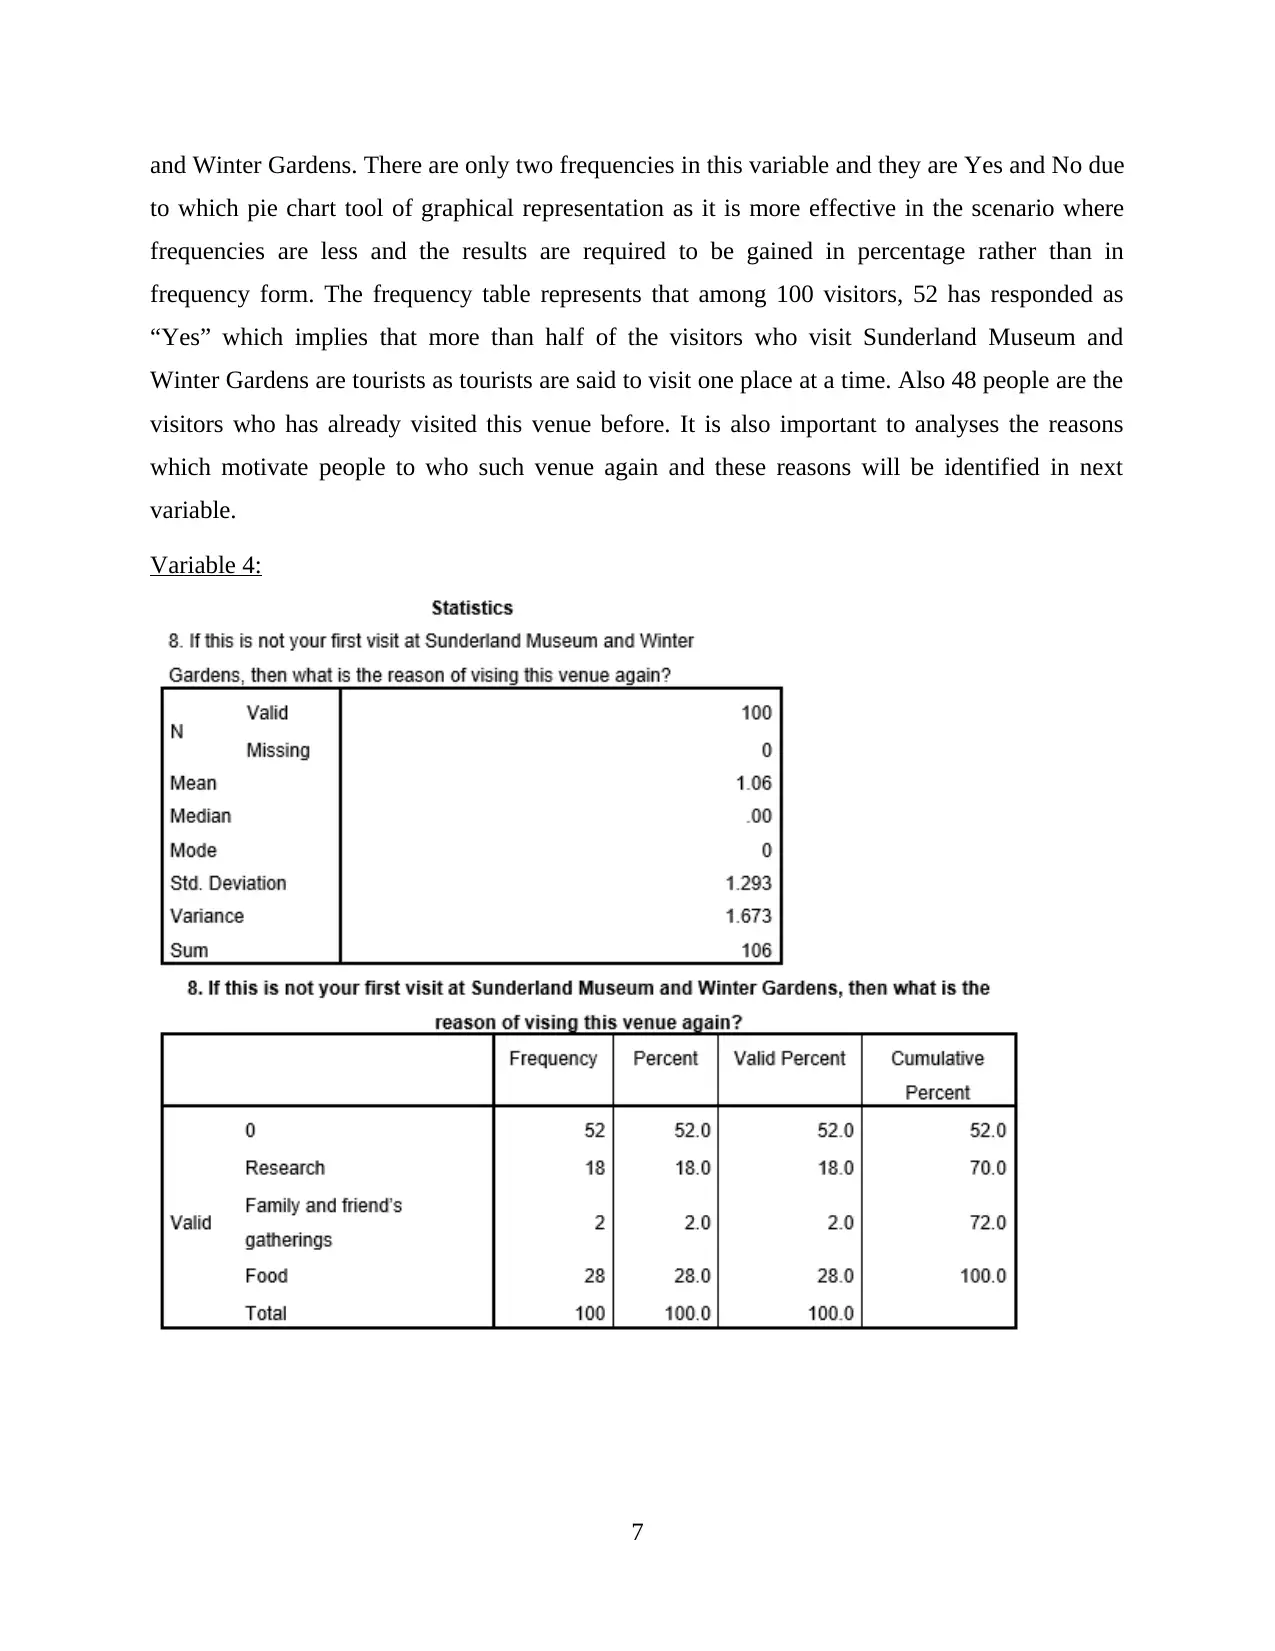
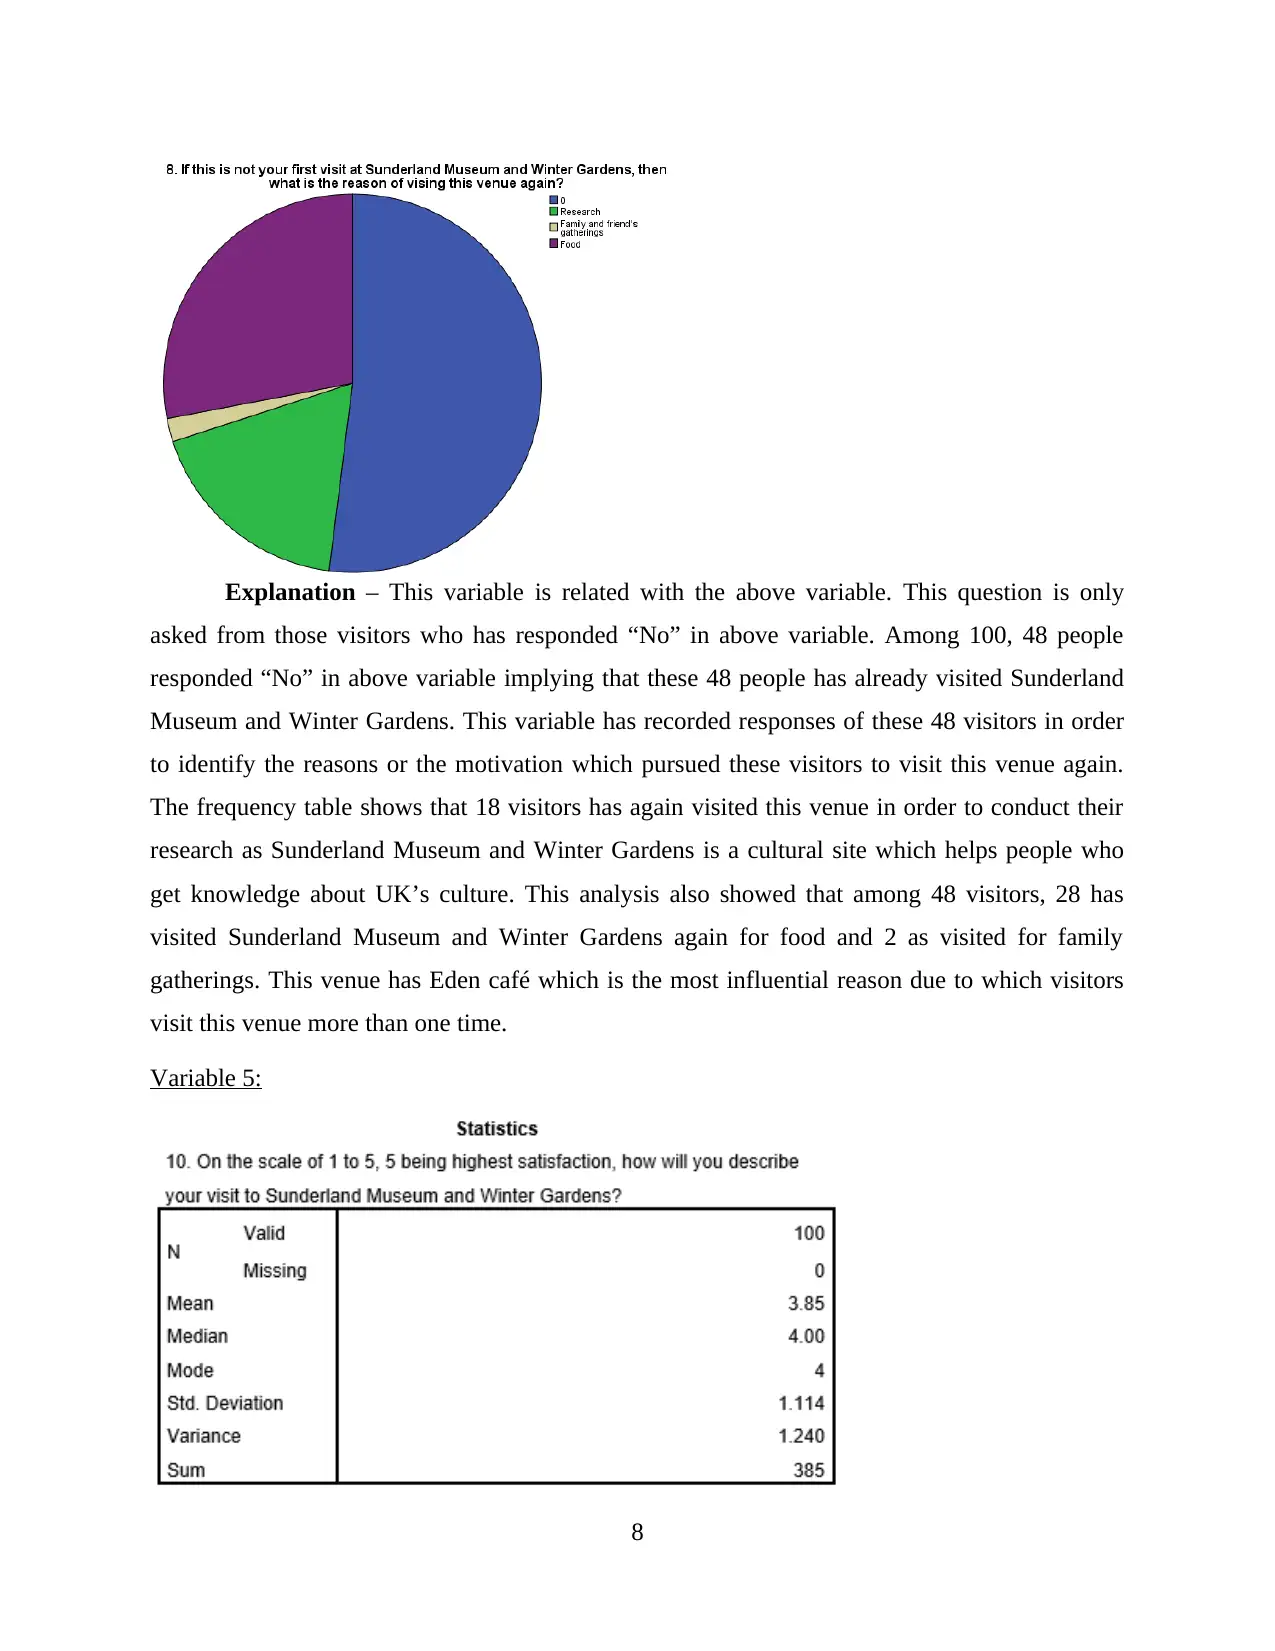
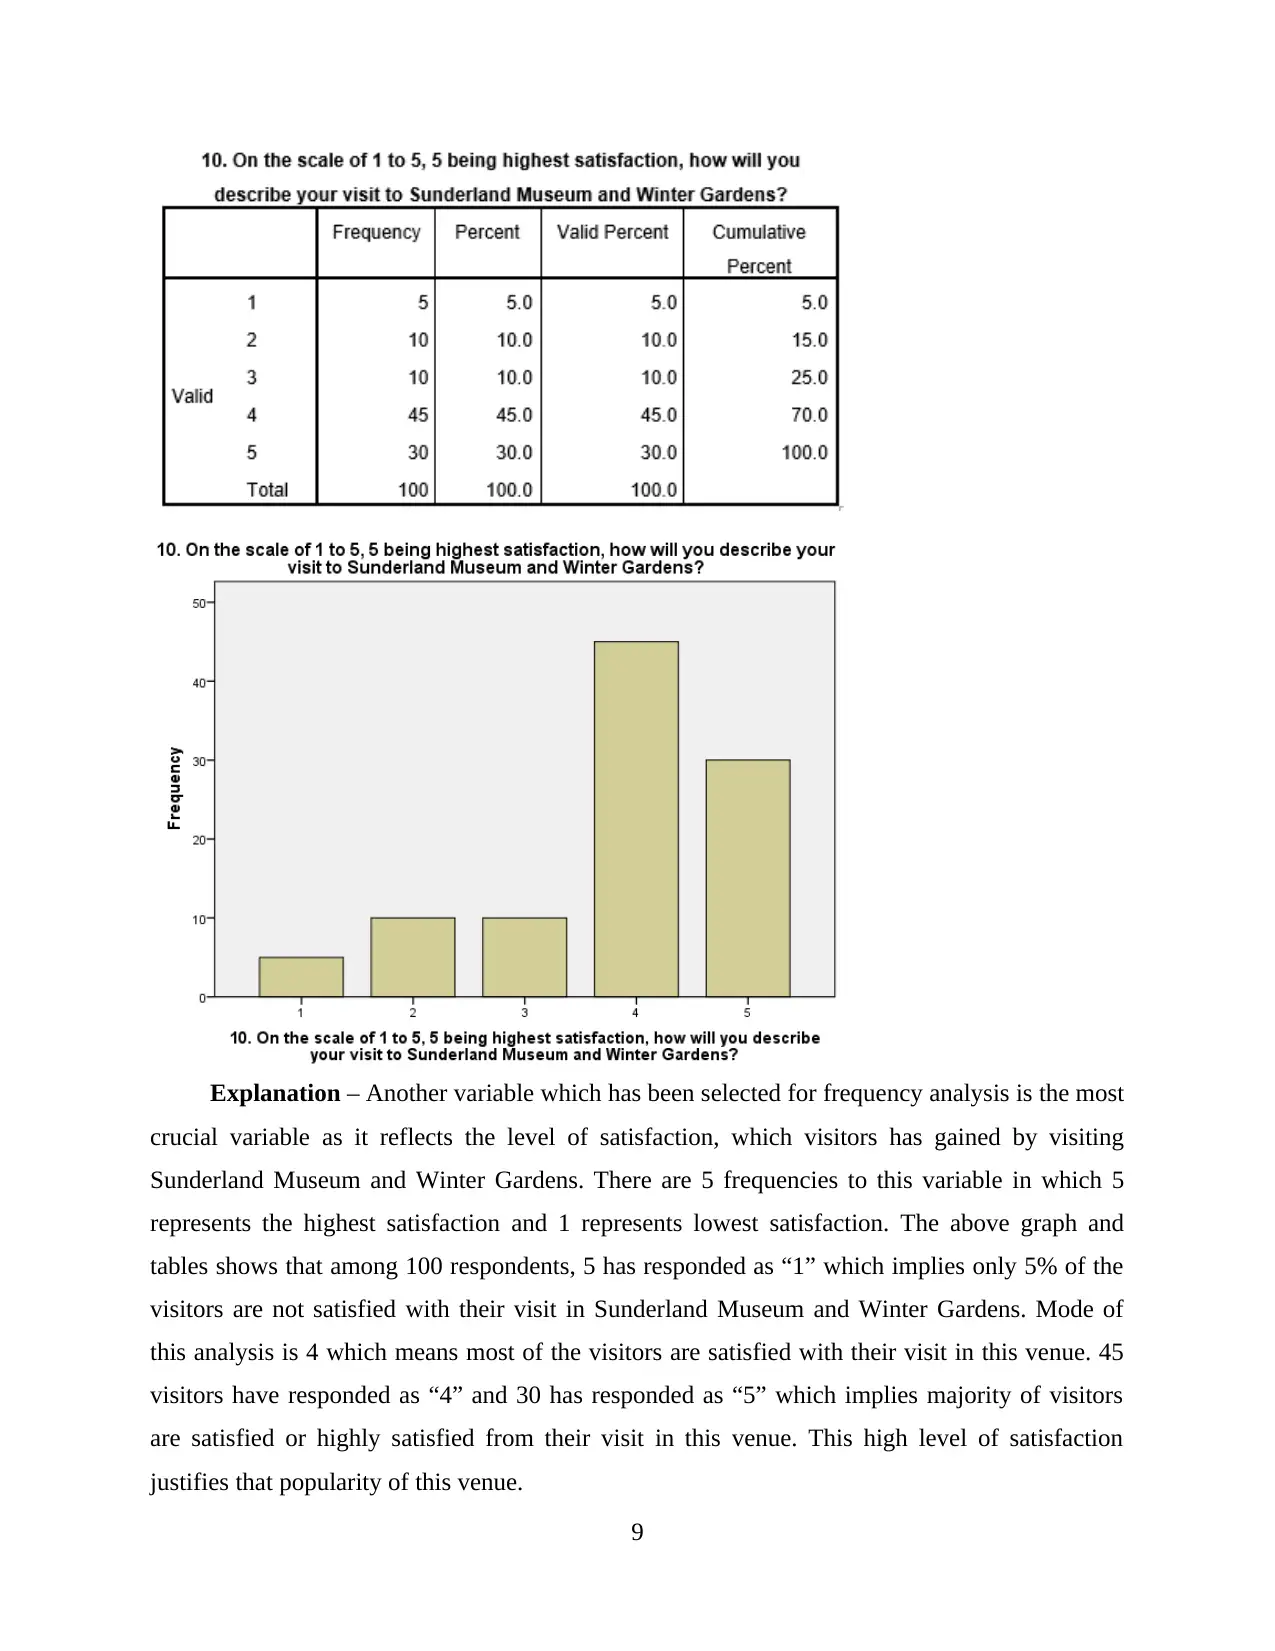
This report presents an analysis of a visitor satisfaction survey conducted at the Sunderland Museum and Winter Gardens. The report begins with the design of the survey questionnaire, which includes questions about demographics, visit purpose, and satisfaction levels. The core of the report focuses on statistical analysis, employing descriptive statistics to analyze the frequency distribution of key variables such as age, education, and satisfaction ratings. The analysis includes frequency tables and charts generated using SPSS software. Furthermore, the report utilizes the chi-square test to assess the relationship between categorical variables, such as marital status and recommendation, and education level with the purpose of visit. The findings reveal insights into visitor demographics, their motivations for visiting, and their overall satisfaction with the museum, providing valuable data for understanding visitor experiences and potential areas for improvement. The report concludes with interpretations of the statistical tests and their implications for the museum's operations and visitor engagement strategies.
tabler-icon-diamond-filled.svg

Contribute Materials

Your contribution can guide someone’s learning journey. Share your documents today.
Document Page
Research Methods for
Tourism, Hospitality and
Events: Assessment 2
tabler-icon-diamond-filled.svg

Secure Best Marks with AI Grader

Need help grading? Try our AI Grader for instant feedback on your assignments.
Document Page
Contents
Questionnaire Design.......................................................................................................................1
Statistical Testing: Descriptive Analysis.........................................................................................3
Variable 1:...................................................................................................................................3
Variable 2:...................................................................................................................................4
Variable 3:...................................................................................................................................6
Variable 4:...................................................................................................................................7
Variable 5:...................................................................................................................................8
Variable 6:.................................................................................................................................10
Statistical Testing: Chi Square Test Evidence...............................................................................11
Test 1:........................................................................................................................................11
Test 2:........................................................................................................................................12
Document Page
Document Page
Questionnaire Design
Survey questionnaire for Measuring Visitor Satisfaction at Sunderland Museum and Winter
Gardens
1. Specify your age
a) 18 to 24
b) 25 to 34
c) 35 to 44
d) 45 and above
2. Specify your gender
a) Male
b) Female
c) Other
3. Specify your marital status
a) Single
b) Married
c) Separated
4. Select the category which represents your annual or household income?
a) Less than 20000
b) 20000 to 50000
c) 50000 to 100000
d) 100000 and above
5. What is the highest level of education you have completed?
a) High School
b) Bachelor’s degree
c) Master’s degree or professional degree
d) Doctorate degree
6. How you heard about Sunderland Museum and Winter Gardens?
a) Internet
b) Magazine or brochures
c) Friends and family
1
tabler-icon-diamond-filled.svg

Secure Best Marks with AI Grader

Need help grading? Try our AI Grader for instant feedback on your assignments.
Document Page
d) Tour Guide
e) Driving by
f) Maps
7. Is this is your first visit at Sunderland Museum and Winter Gardens?
a) Yes
b) No
8. If this is not your first visit at Sunderland Museum and Winter Gardens, then what is the
reason of vising this venue again?
a) Research
b) Family and friend’s gatherings
c) Food
9. What is the purpose of your visit today?
a) Learn about culture
b) Spend time with family and friends
c) Sightseeing
10. On the scale of 1 to 5, 5 being highest satisfaction, how will you describe your visit to
Sunderland Museum and Winter Gardens?
a) 1
b) 2
c) 3
d) 4
e) 5
11. Which experience at this event was most fulfilling for you?
a) Winter Gardens
b) Museum
c) Art Gallery
d) Shop and café
12. Are there any external factors (mood and personal conflicts) which impacted on your visit
satisfaction of Sunderland Museum and Winter Gardens?
a) Yes
b) No
2
Document Page
13. Would you recommend Sunderland Museum and Winter Gardens to your friends and family?
a) Yes
b) No
Statistical Testing: Descriptive Analysis
From all the questions which are included in the survey questionnaire are variables and
among these 13 variables only 6 are selected for frequency and descriptive analysis. Using
software application of SPSS, frequency table and charts are developed for each of the six
variables.
Variable 1:
3
Document Page
Explanation – The above frequency distribution shows that the survey is conducted
using 100 respondents in order to analyses the satisfaction of visitors who visit Sunderland
Museum and Winter Gardens. The graph shows that the people who most visits at the selected
venue are the people who aged between 18 to 24 as the mode of this distribution is “1” that
represents people having age of 18 to 24. People aged between 35 to 44 has lowest frequency
figure that implies this venue of Sunderland is not popular among working people.
Variable 2:
4
tabler-icon-diamond-filled.svg

Paraphrase This Document

Need a fresh take? Get an instant paraphrase of this document with our AI Paraphraser
Document Page
Explanation Another variable selected for descriptive analysis is the variable
representing highest level of education which each visitor respondent has. The above descriptive
statistics table shows that the mean of this distribution is 3 which means most of the visitors who
visits Sunderland Museum and Winter Gardens has Master’s degree. The frequency which has
the minimum value of 5 is high school which implies that there are only 5% of the inadequately
educated visitors in this venue. The venue which has been selected is a museum which is famous
among people who like to educate themselves and are in interested in culture. Considering this, it
is well justified that the people who visits this museum are highly educated people. Among 100
visitors, 45 are observed to have a master’s degree, 40 are observed to have a bachelor’s degree
and 10 are observed to have doctorate degree. Observing this, it is clear that the Sunderland
Museum and Winter Gardens are most visited by educated people.
5
Document Page
Variable 3:
Explanation – Another variable selected for frequency analysis is the response of 100
visitors when they were asked that whether or not this is their first visit to Sunderland Museum
6
Document Page
and Winter Gardens. There are only two frequencies in this variable and they are Yes and No due
to which pie chart tool of graphical representation as it is more effective in the scenario where
frequencies are less and the results are required to be gained in percentage rather than in
frequency form. The frequency table represents that among 100 visitors, 52 has responded as
“Yes” which implies that more than half of the visitors who visit Sunderland Museum and
Winter Gardens are tourists as tourists are said to visit one place at a time. Also 48 people are the
visitors who has already visited this venue before. It is also important to analyses the reasons
which motivate people to who such venue again and these reasons will be identified in next
variable.
Variable 4:
7
tabler-icon-diamond-filled.svg

Secure Best Marks with AI Grader

Need help grading? Try our AI Grader for instant feedback on your assignments.
Document Page
Explanation – This variable is related with the above variable. This question is only
asked from those visitors who has responded “No” in above variable. Among 100, 48 people
responded “No” in above variable implying that these 48 people has already visited Sunderland
Museum and Winter Gardens. This variable has recorded responses of these 48 visitors in order
to identify the reasons or the motivation which pursued these visitors to visit this venue again.
The frequency table shows that 18 visitors has again visited this venue in order to conduct their
research as Sunderland Museum and Winter Gardens is a cultural site which helps people who
get knowledge about UK’s culture. This analysis also showed that among 48 visitors, 28 has
visited Sunderland Museum and Winter Gardens again for food and 2 as visited for family
gatherings. This venue has Eden café which is the most influential reason due to which visitors
visit this venue more than one time.
Variable 5:
8
Document Page
Explanation – Another variable which has been selected for frequency analysis is the most
crucial variable as it reflects the level of satisfaction, which visitors has gained by visiting
Sunderland Museum and Winter Gardens. There are 5 frequencies to this variable in which 5
represents the highest satisfaction and 1 represents lowest satisfaction. The above graph and
tables shows that among 100 respondents, 5 has responded as “1” which implies only 5% of the
visitors are not satisfied with their visit in Sunderland Museum and Winter Gardens. Mode of
this analysis is 4 which means most of the visitors are satisfied with their visit in this venue. 45
visitors have responded as “4” and 30 has responded as “5” which implies majority of visitors
are satisfied or highly satisfied from their visit in this venue. This high level of satisfaction
justifies that popularity of this venue.
9
Document Page
Variable 6:
10
tabler-icon-diamond-filled.svg

Paraphrase This Document

Need a fresh take? Get an instant paraphrase of this document with our AI Paraphraser
Document Page
Explanation – The last variable which has been selected for analysis focuses towards
gaining the response of 100 visitors that whether or not they will recommend Sunderland
Museum and Winter Gardens to their friends and family. The graphical representation and
frequency table shows that 88 among 100 visitors has responded affirmatively that they will
recommend this venue to their friends and family as they were satisfied with their visit. 12
among 100 responded as “No” representing that they will not prefer to recommend this venue to
their friends and family.
Statistical Testing: Chi Square Test Evidence
Chi square and cross tabulation is a SPSS tool which helps in identifying whether two
variables has a significant relationship or not. The level of significance selected in below tests is
0.05 (as the confidence interval is 95%). This must be considered that the significance level
below 0.05 represents significant relationship and above 0.05 represents no or insignificant
relationship.
Test 1:
11
Document Page
Explanation – The first chi square test has been conducted on two categorical variables
which seek response of visitors that what is their marital status and would they recommend the
selected venue to their friends and family. The cross tabulation table attached above shows that
people who are single inclined to highly recommend this place and the same case is with married
and divorced so till this table, there is no significant relationship has been seen but it can only a
coincidence as well. To statistically test the relationship between these two variables, Pearson
Chi-Square significance p value will be used. As the p value is .527 which is higher than 0.05, it
can be interpreted that there is no significant or insignificant relationship between the two
selected variables. This implies marital status of a visitor foes not define that they will or they
will not recommend Sunderland Museum and Winter Gardens to their friends and family.
Test 2:
12
Document Page
Explanation – This chi square test has been conducted to identify that whether the
education level of visitors is related with their purpose of visit to Sunderland Museum and
Winter Gardens. The cross tabulation table and the graphical representation shows that the
people with Master or doctorate degree has “learn about culture” as major reason to visit this
venue. On the other hand, people with bachelor’s degree has “Spend time with friends and
family” as their major reason and visitors with high school education has sightseeing as their
major reason to visit this venue. This analysis indicates that there can be a relationship between
the two variables as different education has different purposes to visit this venue. The chi square
13
tabler-icon-diamond-filled.svg

Secure Best Marks with AI Grader

Need help grading? Try our AI Grader for instant feedback on your assignments.
Document Page
test represents p value as 0.000 which is less than 0.05 which evidently proves that there is a
significant relationship between education level and the purpose of the visit of visitors.
14
chevron_up_icon
1 out of 17
circle_padding
hide_on_mobile
zoom_out_icon
logo.png

Your All-in-One AI-Powered Toolkit for Academic Success.

Available 24*7 on WhatsApp / Email

[object Object]