Market Research Report: Analysis of Market Research in Tourism Sector
VerifiedAdded on 2020/05/28
|22
|3211
|360
Report
AI Summary
This market research report delves into the analysis of market segmentation within the tourism sector, focusing on the impact of events like the Justin Bieber show in Adelaide. The report begins with an overview of the research problem, highlighting management issues and market segmentation methods. It then details the sampling methods used, specifically employing a questionnaire-based online survey to gather data. The report outlines the strategies for data collection and analysis, differentiating between quantitative and qualitative approaches. The questionnaire's design and the results from a sample of 12 respondents are presented, including frequency distributions and cross-tabulations. The findings indicate positive attitudes toward market segmentation and the role of local events in business growth. The report concludes with recommendations based on the analysis, emphasizing the importance of consumer behavior and market assessment for successful tourism events.

Running head: MARKET RESEARCH
Market Research
Name of the Student:
Name of the University:
Author’s Note:
Market Research
Name of the Student:
Name of the University:
Author’s Note:
Paraphrase This Document
Need a fresh take? Get an instant paraphrase of this document with our AI Paraphraser
1
MARKET RESEARCH
Table of Contents
1. Data Analysis:........................................................................................................................2
1.1 Overview of the research problem:..................................................................................2
1.2 Sampling Methods:..........................................................................................................3
1.3 Strategy to collect/sample data:.......................................................................................4
1.3.1. Strategy:...................................................................................................................4
1.3.2. Quantitative Data Analysis:.....................................................................................5
1.3.3. Qualitative Data Analysis:.......................................................................................6
2. Questionnaire for the Online Survey......................................................................................7
3. Online Focus Group.............................................................................................................17
4. Recommendation:................................................................................................................17
5. References:...........................................................................................................................18
6. Appendix..............................................................................................................................19
6.1. Questionnaire for the Online Survey.............................................................................19
2
MARKET RESEARCH
1. Data Analysis:
1.1 Overview of the research problem:
The major management issues that can have an influence on their decision making
process is asked as research question (Peter, Olson and Grunert, 1999). Besides, the
researcher is interested to have most common ways to segment the market to undertake an
event in tourism. One more fact is that to improve the growth of the regions. The online
survey is incorporated to investigate the responses of questionnaire for collecting precise
answers.
The data analysis is a reflection of overview of research problem (Cash, 2015). It
helps to conclude about effective marketing as well as tourism plans. The sample surveys are
operated on chosen dataset of the target population utilising a some assumptions about the
target population. The nature of variables refers the application of the sample-based
approach. To draw out the association between the whole population and selected sample, the
sampling methodology requires to be based on statistical processes.
1.2 Sampling Methods:
Different types of data collecting techniques are present to adopt. Sampling by
interview method, questionnaire process, survey & census process and observation process
are well known. The Sampling method is of two types that are Probability and Non-
Probability. The Sampling methods are of four types that are Simple Random Sampling,
Systematic Sampling, Stratified sampling and Cluster Sampling. Non-Probability sampling is
of four types that are Convenience sampling, Judgement sampling, Quota sampling and
Snowball sampling.
⊘ This is a preview!⊘
Do you want full access?
Subscribe today to unlock all pages.
Trusted by 1+ million students worldwide
3
MARKET RESEARCH
The questionnaire process is granted in this marketing research report. Before
executing the survey of the samples, it is required to define a target population. The aim of
the survey by questionnaire method is to be aware of the effectiveness of a product or service
of market research. Here, the target population is the collection of selected consumers. It is
critical to select the most appropriate target population for satisfying the purpose of assessing
the survey.
In Questionnaire method of surveying, a questionnaire is e-mailed to the
corresponding respondents who are expected to provide their respond, understand and reply
on their own and fill up the questionnaire. The questionnaire is consists of few questions
given in a sequential order on a form or on set of forms. In case of rehearsal of main survey
by experts, “Pilot study” is required by experts for testing the questionnaire for vulnerabilities
of the questions and techniques used (Palinkas et al., 2015).
The main aspect of good questionnaire is that it should be presize, simple and
logically sequenced. Technical terms and sensitivity issues must be avoided. The reliability of
the respondents must be present at the time of giving the responses. Most of the questions
should be close-ended questions. Besides, use of “Likert” scale to tabulate the responses is
helpful to interpret and refer the graphical representation.
The data collected by questionnaire survey method is primary in nature. The data is
qualitative whereas we had options to collect both the qualitative and quantitative data. The
sample size is small (12), therefore the outcomes may fluctuate from actual scenario.
However, the collected sample is free from bias and easy to interpret.
The market survey and segmentation of various events are based on live Justin Bieber
show in Adelaide. The influence of the show on the tourists and segmentation of the tourism
market shows the assessment of enhancement in this research report. The research has tried to
Paraphrase This Document
Need a fresh take? Get an instant paraphrase of this document with our AI Paraphraser
4
MARKET RESEARCH
distinguish the different modes of segmentation of the market. The method of enhancement
of such events in Adelaide could improve the rising of business in the region and the society.
1.3 Strategy to collect/sample data:
1.3.1. Strategy:
The strategy of marketing research is that it explains overall strategy that plans
assimilation of various components of the paper in an appropriate way. The marketing
research effectively highlights the research issues and therefore consists of structure for the
measurement, collection and the analysis of collected data.
The simple strategy to incorporate the research report is that to derive firstly the
literature review and general concepts about the market research attributes of forthcoming
Justin Bieber show in Adelaide. Proper citations and references would support the literature
review and its basic establishments for and against the topic of the research. In the next stage,
we would prefer to match the established hypothesis with the analysed data collected from
sample survey method. It is a deductive primary research procedure.
Here, people responded about-
1. Frequency of tourism travelling,
2. Market segmentation that is beneficial for development,
3. Events of local community that aids in business,
4. Role of behaviour of consumers,
5. Essential market assessment before an event,
6. Market segmentation and undertaking of an event.
5
MARKET RESEARCH
The analysed responses of the people would help the researcher to compare
conclusions and recommendations drawn from both literature review and data analysis
process. Strategically, researcher would like to focus mainly on qualitative data analysis. The
variables of the data analysis are categorical and nominal. No numeric variables are added in
this research. Therefore, the data analysis procedure is purely qualitative data analysis.
Below, the identifications and characteristics of both types of data analysis
(Quantitative and Qualitative) are elaborately discussed.
1.3.2. Quantitative Data Analysis:
Quantitative data analysis is utilised to measure the magnitude of data. It has a fixed
format of pre-determined response categories and standard measurements. The broad scaled
data is collected from huge representative sample. Inferential statistics and testing of
hypothesis could be used in data to support conclusion. Numerical aggregation, summaries
and responses are clustered for statistical data analysis.
In case of quantitative data analysis, research questions are fixed or focused and the
outcomes are detected in advance. It is a linear hierarchy process where confounding factors
are controlled during design and analysis. The quantitative data analysis is apprehended from
the structured data of collection instruments. Generally, quantitative data analysis produces
outcomes that are more generalized, compared and summarized than outcomes of qualitative
outcomes.
Quantitative data analysis produces a sample that permits the understanding of the
social method of interest. Purposive sampling is the most creative sample to respond research
question. Enduring interpretation of data would show the approach, identification, themes and
explanations of the dataset. Qualitative data analysis is based on various data collection
methods that are Observation, Interview, Focus Group Discussion and other methods.
⊘ This is a preview!⊘
Do you want full access?
Subscribe today to unlock all pages.
Trusted by 1+ million students worldwide
6
MARKET RESEARCH
1.3.3. Qualitative Data Analysis:
Qualitative Data Analysis (QDA) is the variety of methods and processes where we
shift from the qualitative data that have been gathered into some form of explanation,
understanding or explanation of the circumstances. Both types of deductive and inductive
approaches are used in the analysis of qualitative data. Qualitative data analysis starts with
more common open-ended questions and move towards greater precision. Qualitative
variables are not detected in advance and primary analysis is the hidden sector of data
collection (Miles, Huberman and Saldana, 2013).
Qualitative data analysis is executed based on concepts, opinions, values and
behaviours of people in business or social context. Qualitative data analysis describes a
situation for gaining a particular practice. No pre-determined response categories are present
on qualitative data analysis. Explanatory data in details are collected from small sample.
Qualitative analysis helps to extract patterns from concepts and insights. Open-ended
questions of questionnaire permit to gather illustrative explanation and individual responses.
In case of qualitative data analysis, research questions are comparatively broader,
contextual and flexible. The outcomes are generally not predefined and emerge in research
question. It is a circular hierarchical method where confounding factors are searched in the
field experiments. Generally, qualitative data analysis relies on interactive interviews and
produce outcomes that give meaning, experience and views. Qualitative research could be
utilised to elaborate phenomenon or produce theory ashore on data. The hierarchical process
of quantitative data analysis is circular. The major aspect of qualitative analysis is the
exploratory research.
At first, key explanatory and outcome, variables are detected and then data collection
& analysis distinctly separate phases are carried out in quantitative data analysis. Quantitative
Paraphrase This Document
Need a fresh take? Get an instant paraphrase of this document with our AI Paraphraser
7
MARKET RESEARCH
data analysis has more credibility, transferability, dependability and conformability than
qualitative data analysis. Descriptive statistical measures provide more focused problem
solving marketing policies. Measures of central tendency, Frequency tables and Cross
tabulation tables are the major parts of quantitative data analysis. Different types of Cross
Tabulation and Chi-Square tests are carried out as qualitative data analysis.
2. Questionnaire for the Online Survey
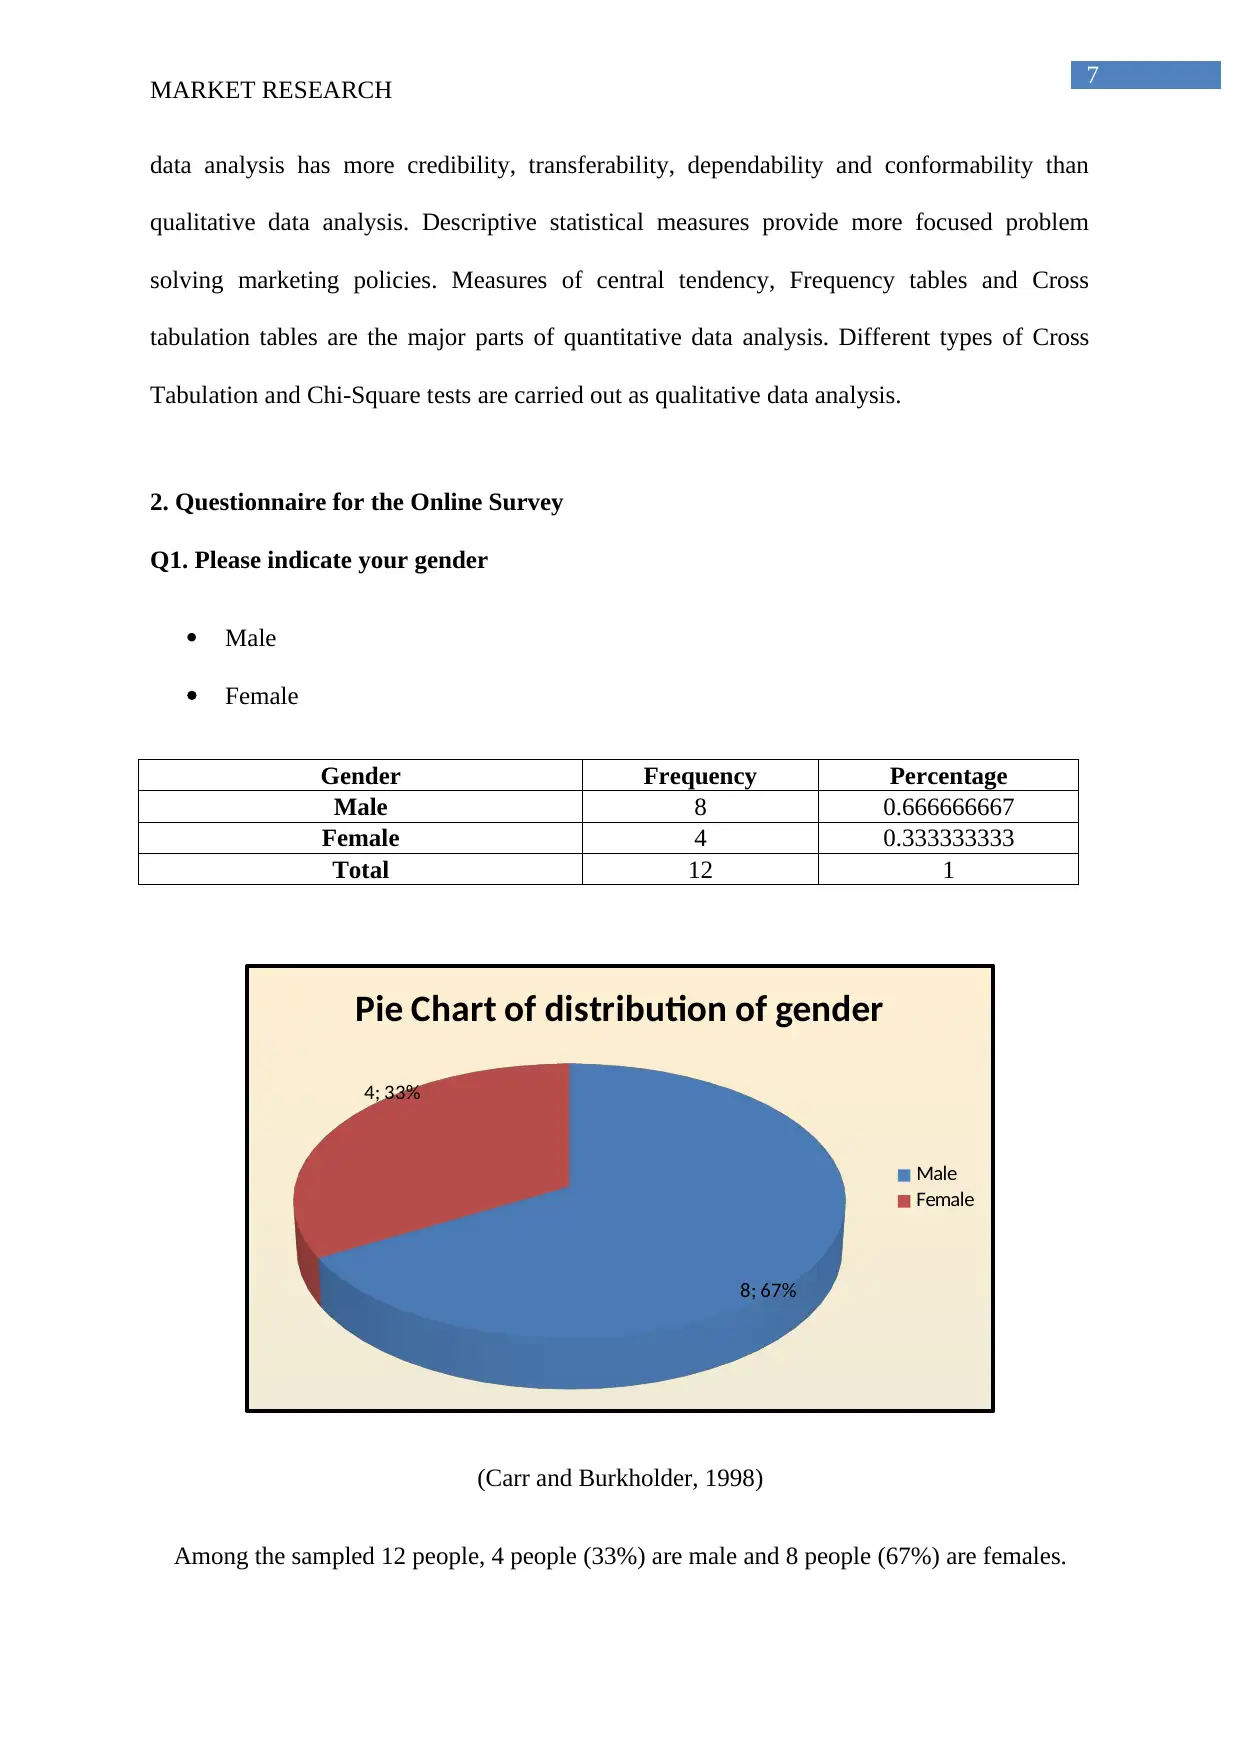
Q1. Please indicate your gender
Male
Female
Gender Frequency Percentage
Male 8 0.666666667
Female 4 0.333333333
Total 12 1
8; 67%
4; 33%
Pie Chart of distribution of gender
Male
Female
(Carr and Burkholder, 1998)
Among the sampled 12 people, 4 people (33%) are male and 8 people (67%) are females.
MARKET RESEARCH
data analysis has more credibility, transferability, dependability and conformability than
qualitative data analysis. Descriptive statistical measures provide more focused problem
solving marketing policies. Measures of central tendency, Frequency tables and Cross
tabulation tables are the major parts of quantitative data analysis. Different types of Cross
Tabulation and Chi-Square tests are carried out as qualitative data analysis.
2. Questionnaire for the Online Survey
Q1. Please indicate your gender
Male
Female
Gender Frequency Percentage
Male 8 0.666666667
Female 4 0.333333333
Total 12 1
8; 67%
4; 33%
Pie Chart of distribution of gender
Male
Female
(Carr and Burkholder, 1998)
Among the sampled 12 people, 4 people (33%) are male and 8 people (67%) are females.
8
MARKET RESEARCH
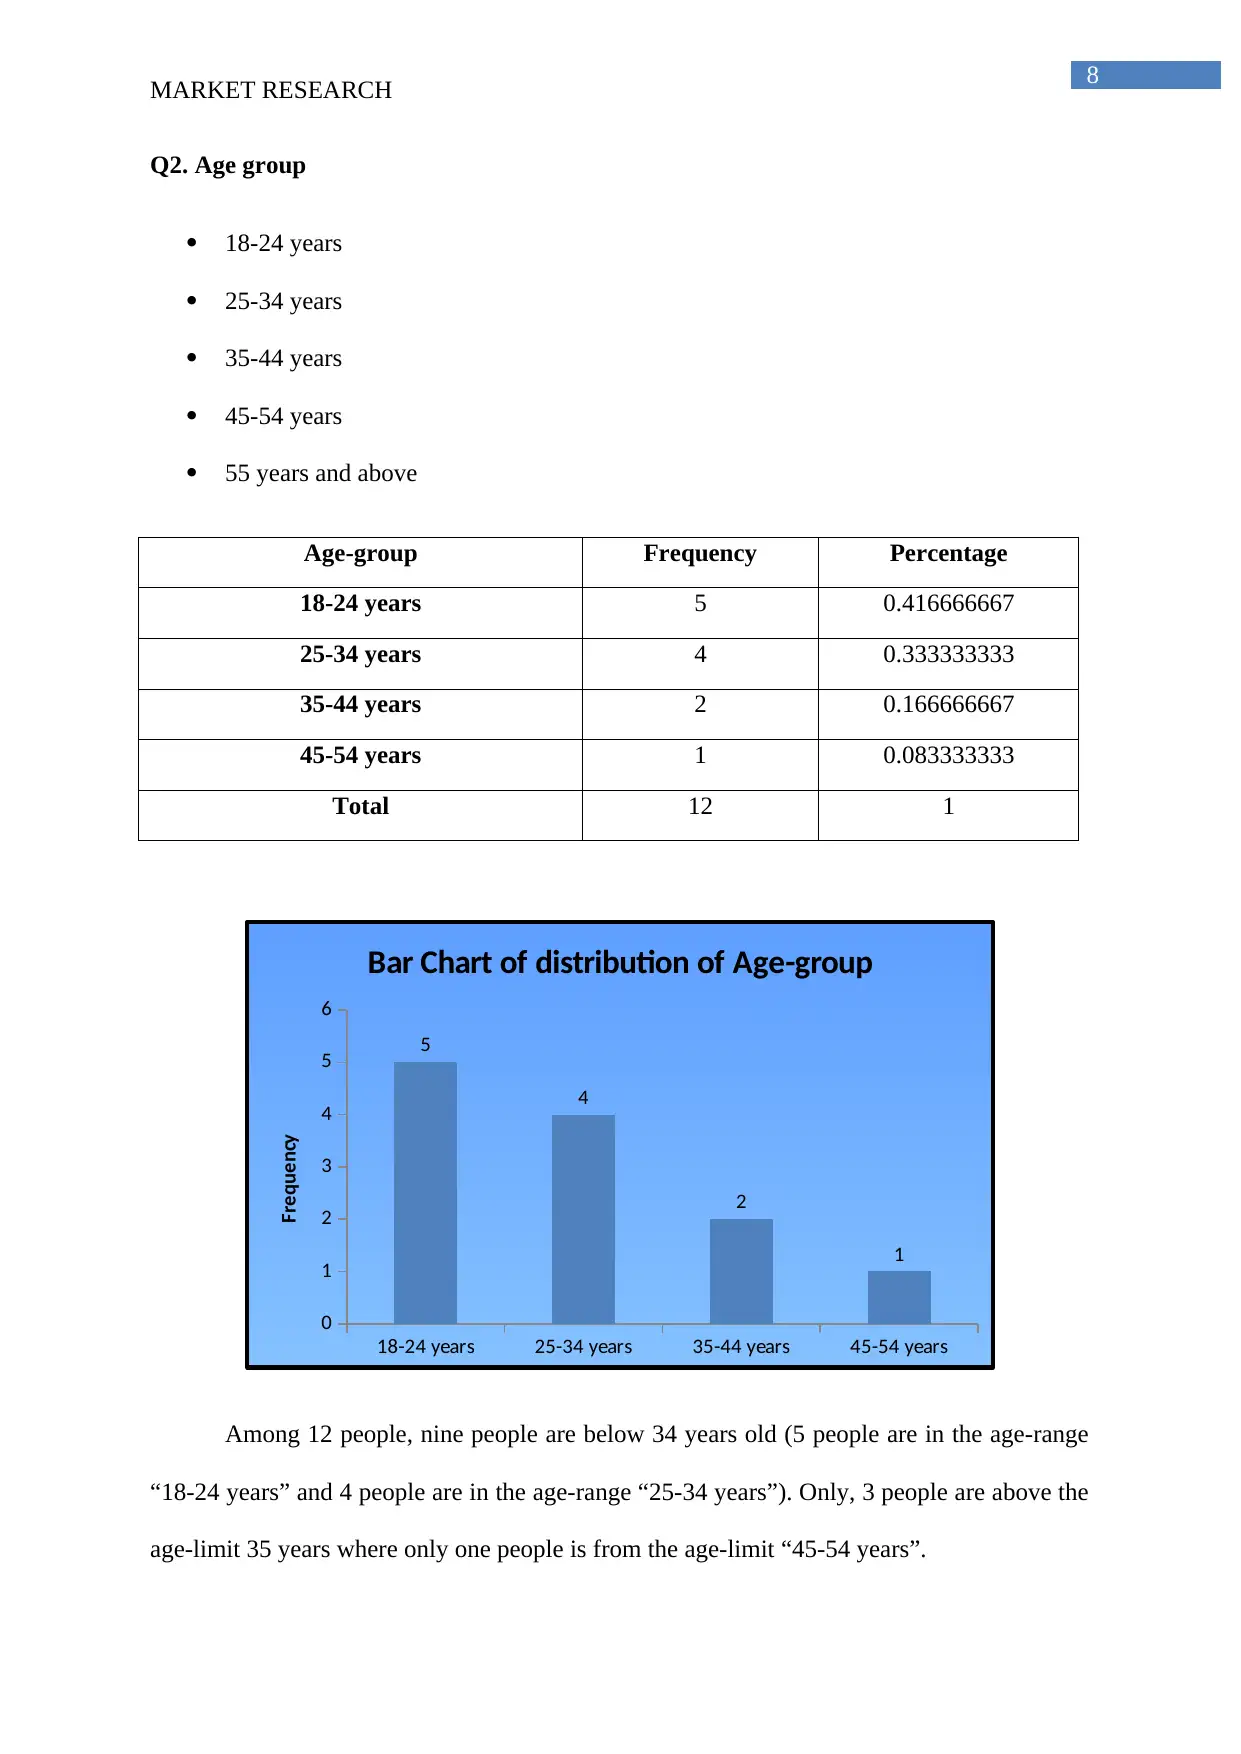
Q2. Age group
18-24 years
25-34 years
35-44 years
45-54 years
55 years and above
Age-group Frequency Percentage
18-24 years 5 0.416666667
25-34 years 4 0.333333333
35-44 years 2 0.166666667
45-54 years 1 0.083333333
Total 12 1
18-24 years 25-34 years 35-44 years 45-54 years
0
1
2
3
4
5
6
5
4
2
1
Bar Chart of distribution of Age-group
Frequency
Among 12 people, nine people are below 34 years old (5 people are in the age-range
“18-24 years” and 4 people are in the age-range “25-34 years”). Only, 3 people are above the
age-limit 35 years where only one people is from the age-limit “45-54 years”.
MARKET RESEARCH
Q2. Age group
18-24 years
25-34 years
35-44 years
45-54 years
55 years and above
Age-group Frequency Percentage
18-24 years 5 0.416666667
25-34 years 4 0.333333333
35-44 years 2 0.166666667
45-54 years 1 0.083333333
Total 12 1
18-24 years 25-34 years 35-44 years 45-54 years
0
1
2
3
4
5
6
5
4
2
1
Bar Chart of distribution of Age-group
Frequency
Among 12 people, nine people are below 34 years old (5 people are in the age-range
“18-24 years” and 4 people are in the age-range “25-34 years”). Only, 3 people are above the
age-limit 35 years where only one people is from the age-limit “45-54 years”.
⊘ This is a preview!⊘
Do you want full access?
Subscribe today to unlock all pages.
Trusted by 1+ million students worldwide
9
MARKET RESEARCH
Q3. Position in the company
$0-$5,000
$5,001-$10,000
$10,001-$20,000
$20,001 and above
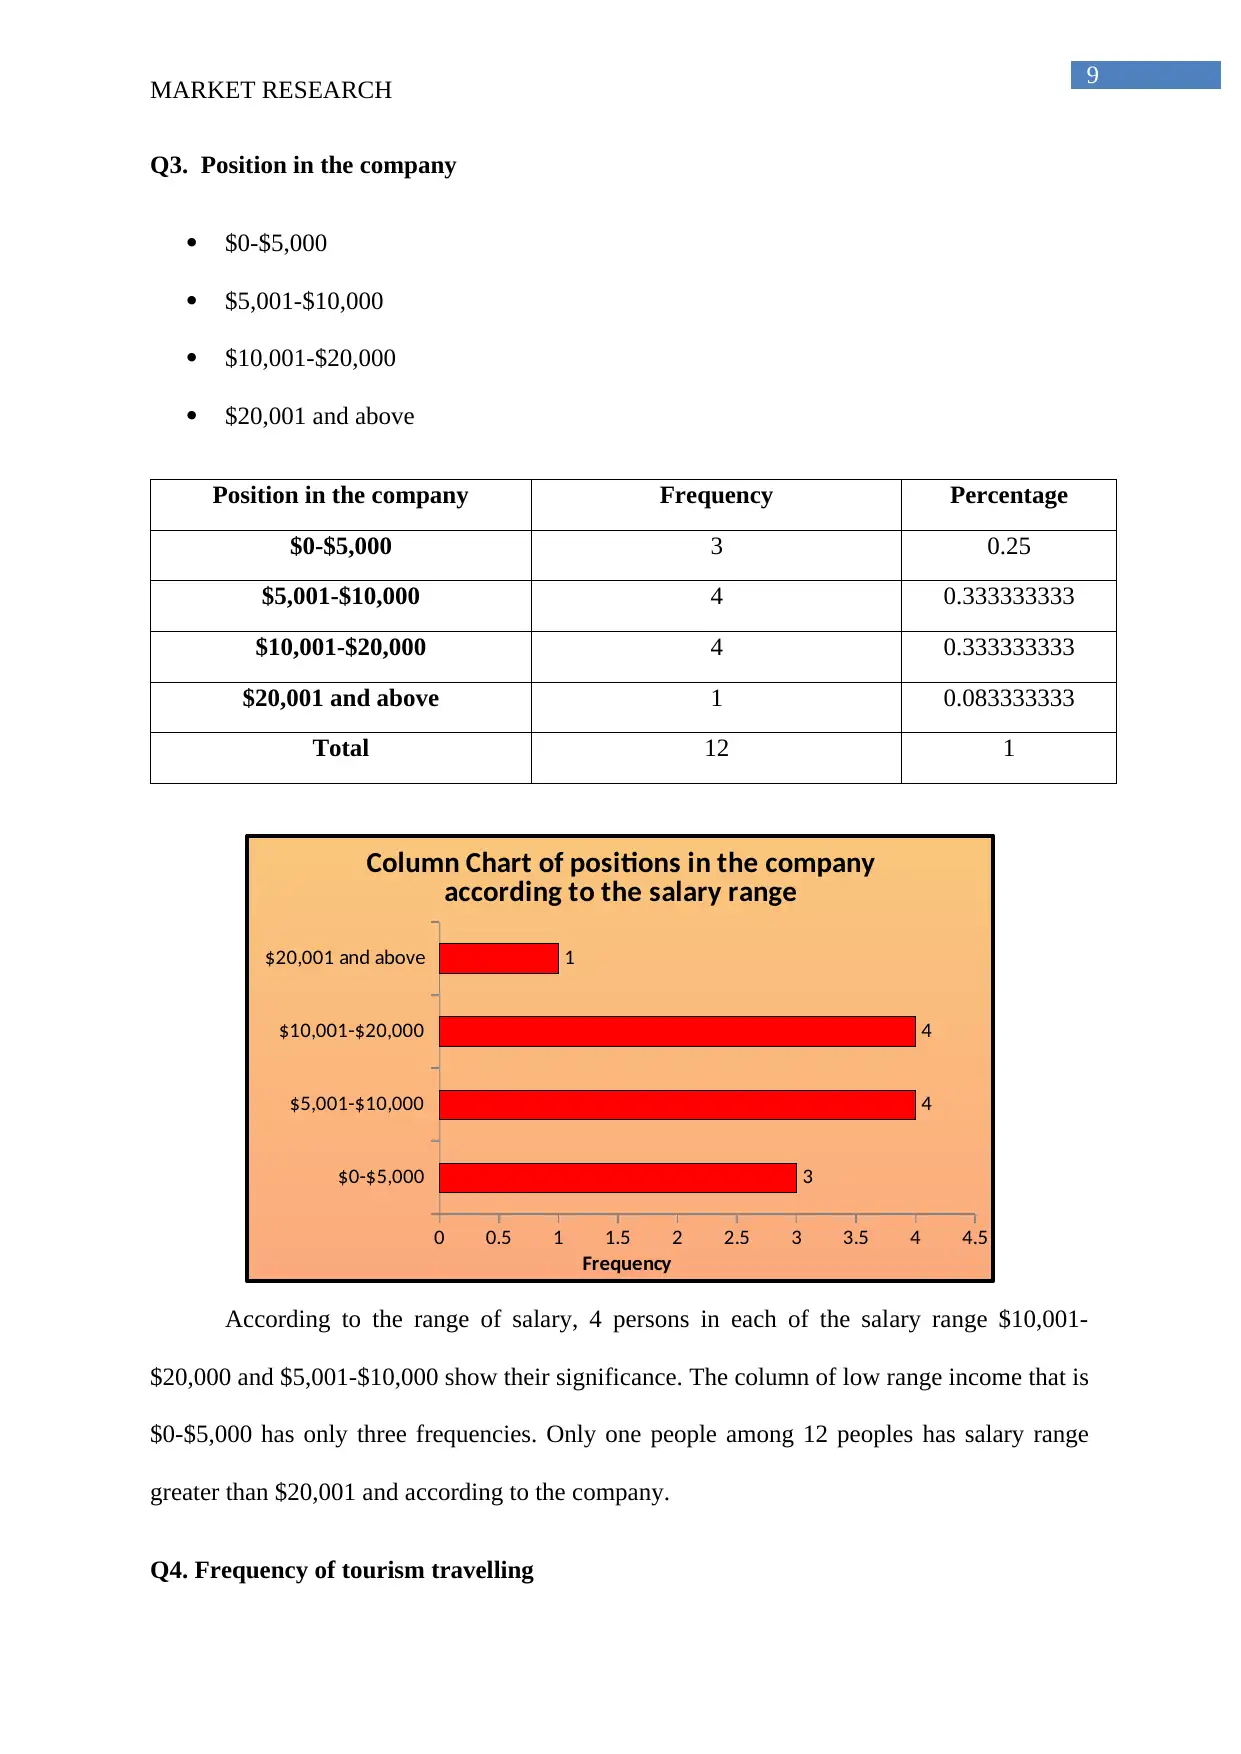
Position in the company Frequency Percentage
$0-$5,000 3 0.25
$5,001-$10,000 4 0.333333333
$10,001-$20,000 4 0.333333333
$20,001 and above 1 0.083333333
Total 12 1
$0-$5,000
$5,001-$10,000
$10,001-$20,000
$20,001 and above
0 0.5 1 1.5 2 2.5 3 3.5 4 4.5
3
4
4
1
Column Chart of positions in the company
according to the salary range
Frequency
According to the range of salary, 4 persons in each of the salary range $10,001-
$20,000 and $5,001-$10,000 show their significance. The column of low range income that is
$0-$5,000 has only three frequencies. Only one people among 12 peoples has salary range
greater than $20,001 and according to the company.
Q4. Frequency of tourism travelling
MARKET RESEARCH
Q3. Position in the company
$0-$5,000
$5,001-$10,000
$10,001-$20,000
$20,001 and above
Position in the company Frequency Percentage
$0-$5,000 3 0.25
$5,001-$10,000 4 0.333333333
$10,001-$20,000 4 0.333333333
$20,001 and above 1 0.083333333
Total 12 1
$0-$5,000
$5,001-$10,000
$10,001-$20,000
$20,001 and above
0 0.5 1 1.5 2 2.5 3 3.5 4 4.5
3
4
4
1
Column Chart of positions in the company
according to the salary range
Frequency
According to the range of salary, 4 persons in each of the salary range $10,001-
$20,000 and $5,001-$10,000 show their significance. The column of low range income that is
$0-$5,000 has only three frequencies. Only one people among 12 peoples has salary range
greater than $20,001 and according to the company.
Q4. Frequency of tourism travelling
Paraphrase This Document
Need a fresh take? Get an instant paraphrase of this document with our AI Paraphraser
10
MARKET RESEARCH
Once a year
Twice a year
More than twice
Very frequently
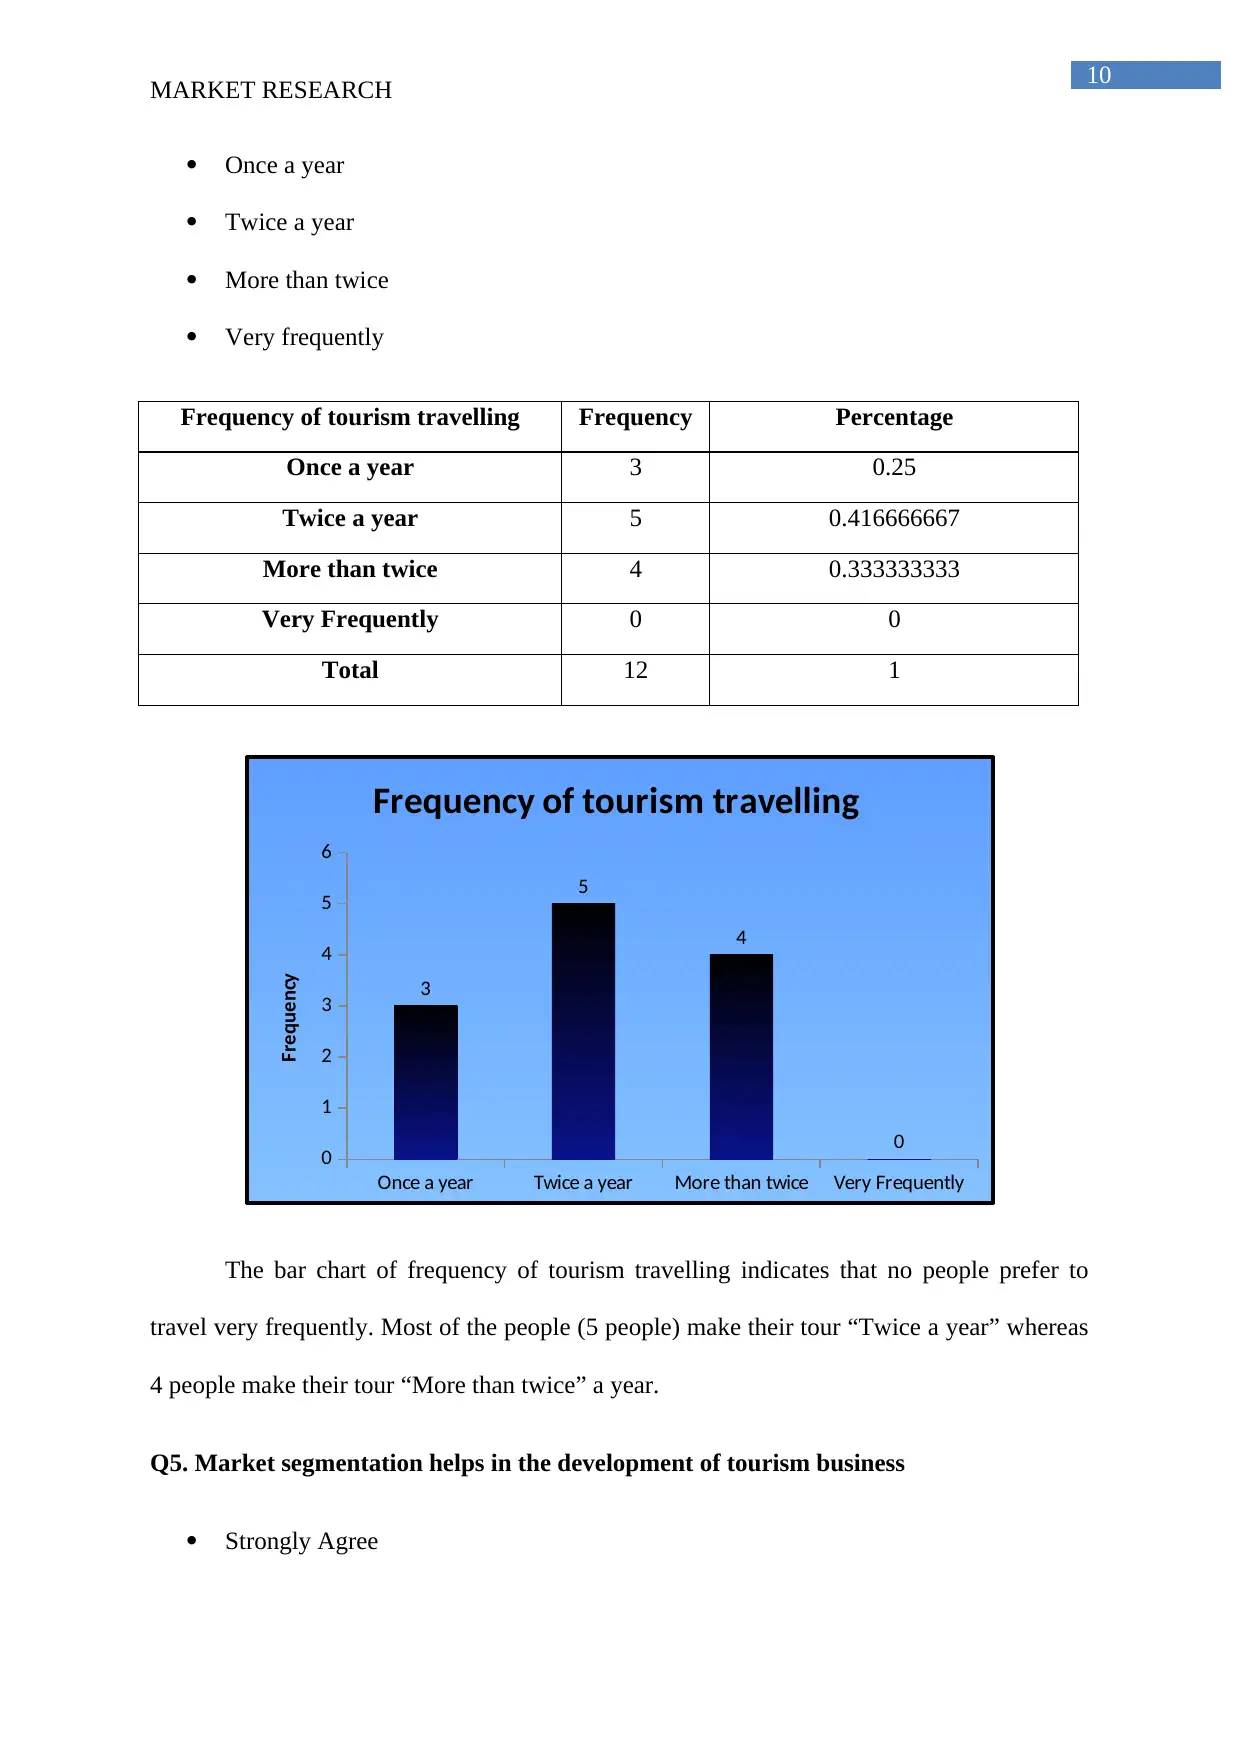
Frequency of tourism travelling Frequency Percentage
Once a year 3 0.25
Twice a year 5 0.416666667
More than twice 4 0.333333333
Very Frequently 0 0
Total 12 1
Once a year Twice a year More than twice Very Frequently
0
1
2
3
4
5
6
3
5
4
0
Frequency of tourism travelling
Frequency
The bar chart of frequency of tourism travelling indicates that no people prefer to
travel very frequently. Most of the people (5 people) make their tour “Twice a year” whereas
4 people make their tour “More than twice” a year.
Q5. Market segmentation helps in the development of tourism business
Strongly Agree
MARKET RESEARCH
Once a year
Twice a year
More than twice
Very frequently
Frequency of tourism travelling Frequency Percentage
Once a year 3 0.25
Twice a year 5 0.416666667
More than twice 4 0.333333333
Very Frequently 0 0
Total 12 1
Once a year Twice a year More than twice Very Frequently
0
1
2
3
4
5
6
3
5
4
0
Frequency of tourism travelling
Frequency
The bar chart of frequency of tourism travelling indicates that no people prefer to
travel very frequently. Most of the people (5 people) make their tour “Twice a year” whereas
4 people make their tour “More than twice” a year.
Q5. Market segmentation helps in the development of tourism business
Strongly Agree
11
MARKET RESEARCH
Agree
Neutral
Disagree
Strongly Disagree
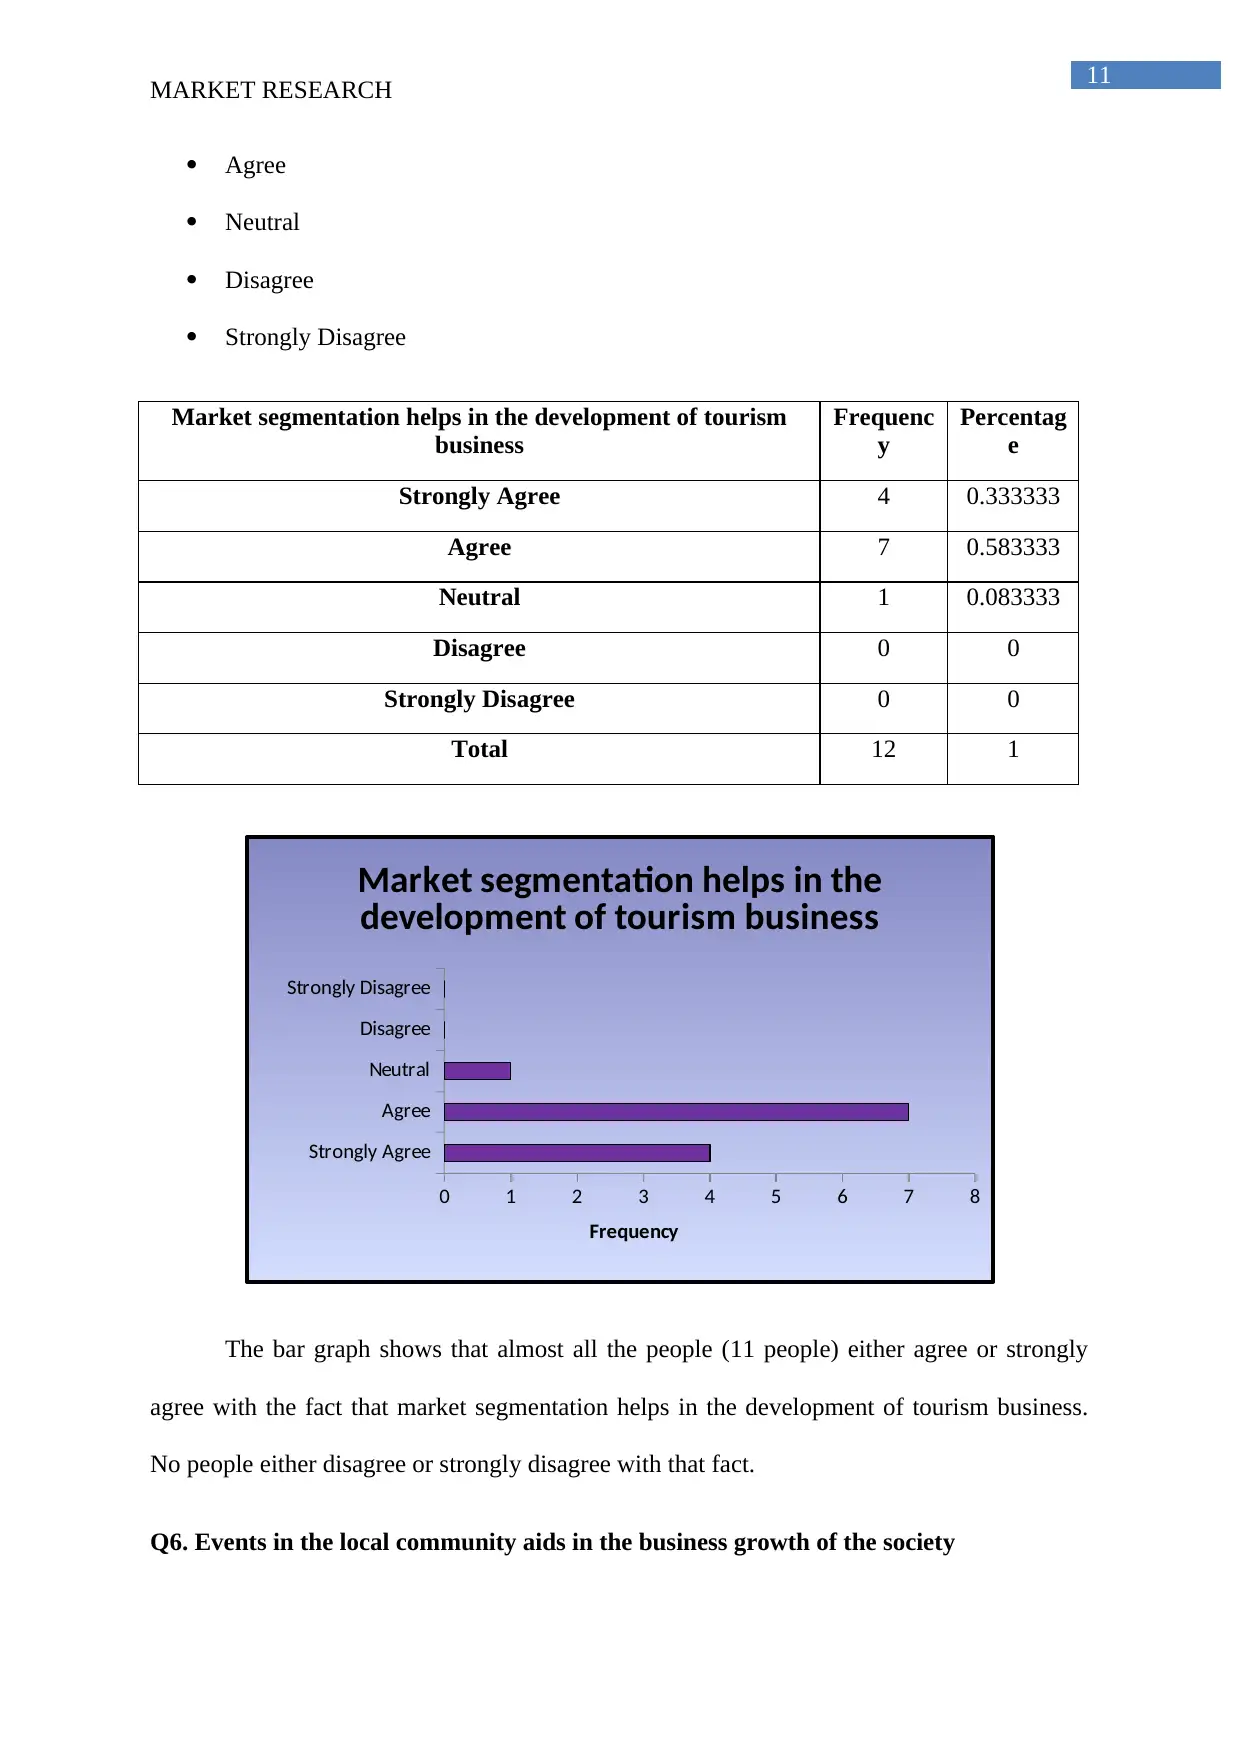
Market segmentation helps in the development of tourism
business
Frequenc
y
Percentag
e
Strongly Agree 4 0.333333
Agree 7 0.583333
Neutral 1 0.083333
Disagree 0 0
Strongly Disagree 0 0
Total 12 1
Strongly Agree
Agree
Neutral
Disagree
Strongly Disagree
0 1 2 3 4 5 6 7 8
Market segmentation helps in the
development of tourism business
Frequency
The bar graph shows that almost all the people (11 people) either agree or strongly
agree with the fact that market segmentation helps in the development of tourism business.
No people either disagree or strongly disagree with that fact.
Q6. Events in the local community aids in the business growth of the society
MARKET RESEARCH
Agree
Neutral
Disagree
Strongly Disagree
Market segmentation helps in the development of tourism
business
Frequenc
y
Percentag
e
Strongly Agree 4 0.333333
Agree 7 0.583333
Neutral 1 0.083333
Disagree 0 0
Strongly Disagree 0 0
Total 12 1
Strongly Agree
Agree
Neutral
Disagree
Strongly Disagree
0 1 2 3 4 5 6 7 8
Market segmentation helps in the
development of tourism business
Frequency
The bar graph shows that almost all the people (11 people) either agree or strongly
agree with the fact that market segmentation helps in the development of tourism business.
No people either disagree or strongly disagree with that fact.
Q6. Events in the local community aids in the business growth of the society
⊘ This is a preview!⊘
Do you want full access?
Subscribe today to unlock all pages.
Trusted by 1+ million students worldwide
1 out of 22
Related Documents


Your All-in-One AI-Powered Toolkit for Academic Success.
+13062052269
info@desklib.com
Available 24*7 on WhatsApp / Email
![[object Object]](/_next/static/media/star-bottom.7253800d.svg)
Unlock your academic potential
Copyright © 2020–2026 A2Z Services. All Rights Reserved. Developed and managed by ZUCOL.