TourneSol Company Case Study: Performance Analysis and Forecast

Verified

Added on  2023/06/07

|13
|1575
|300
Case Study
AI Summary
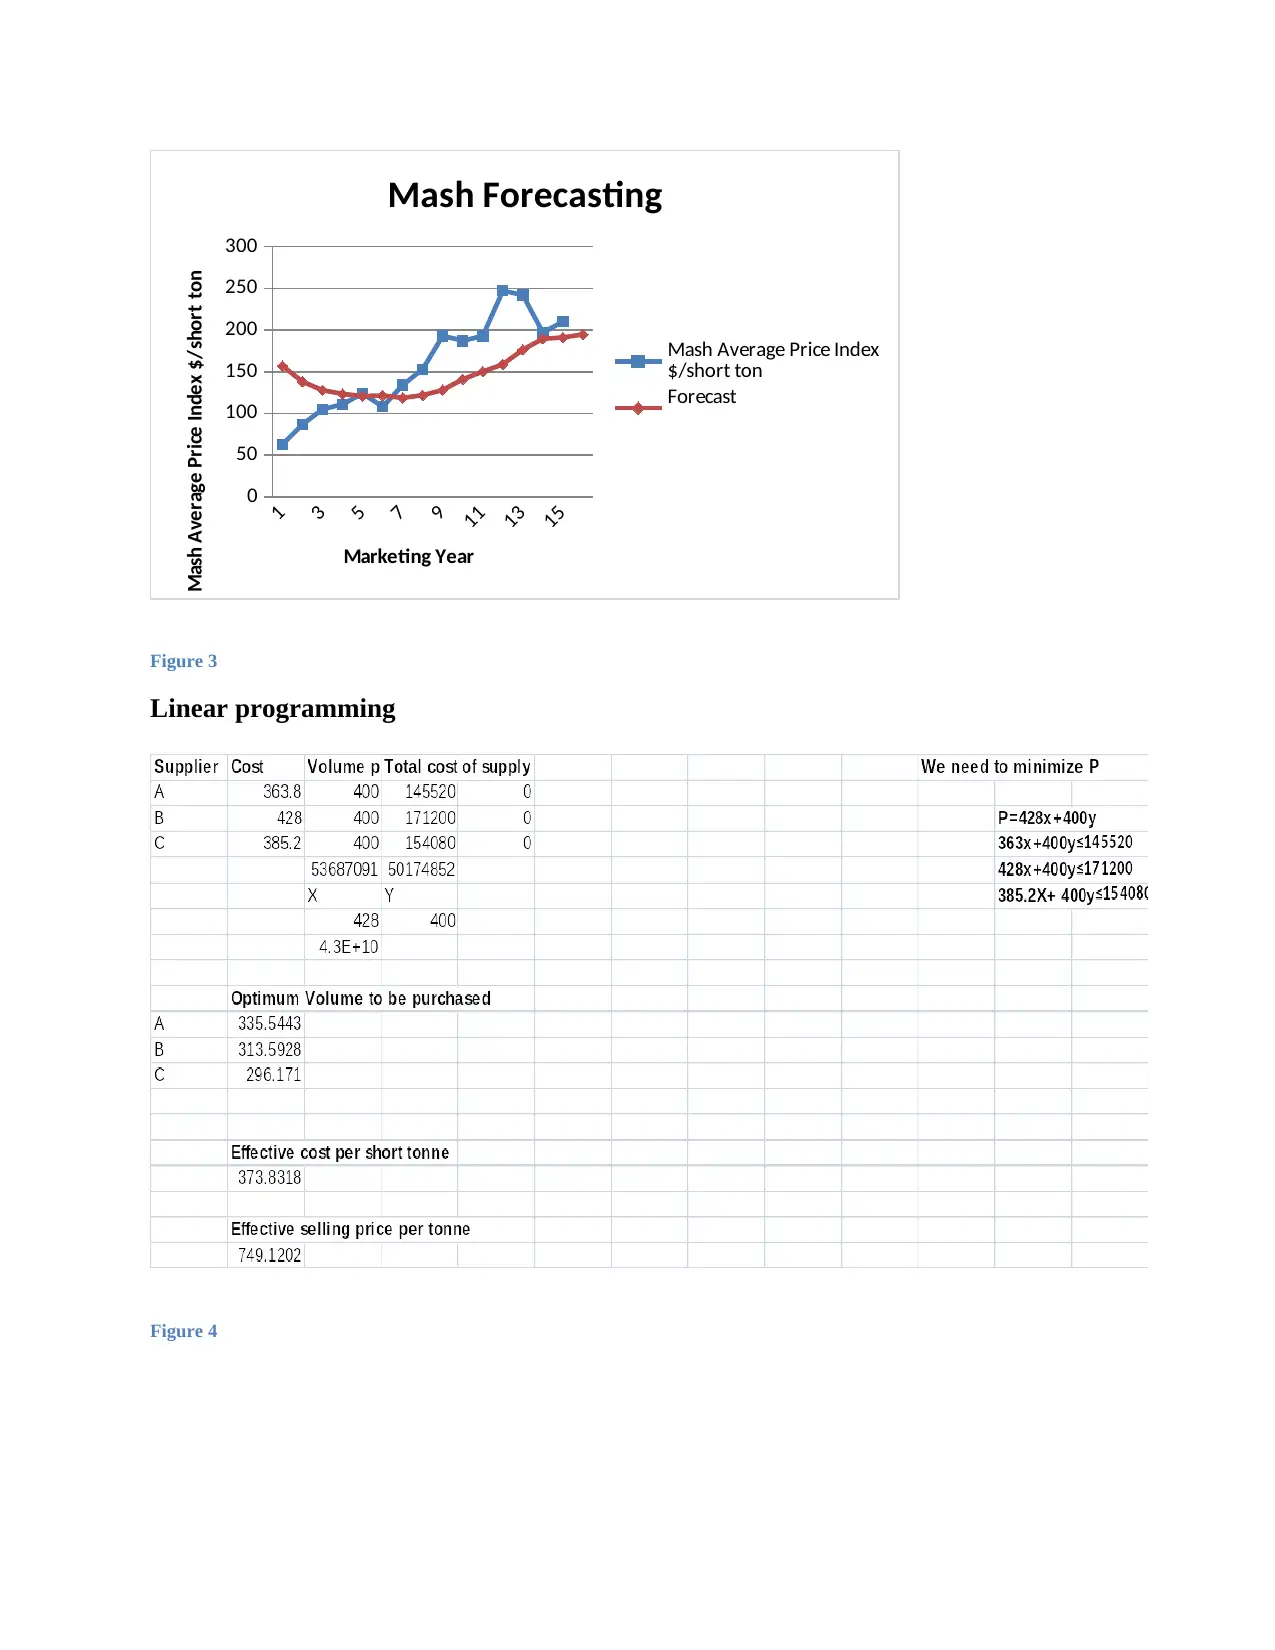
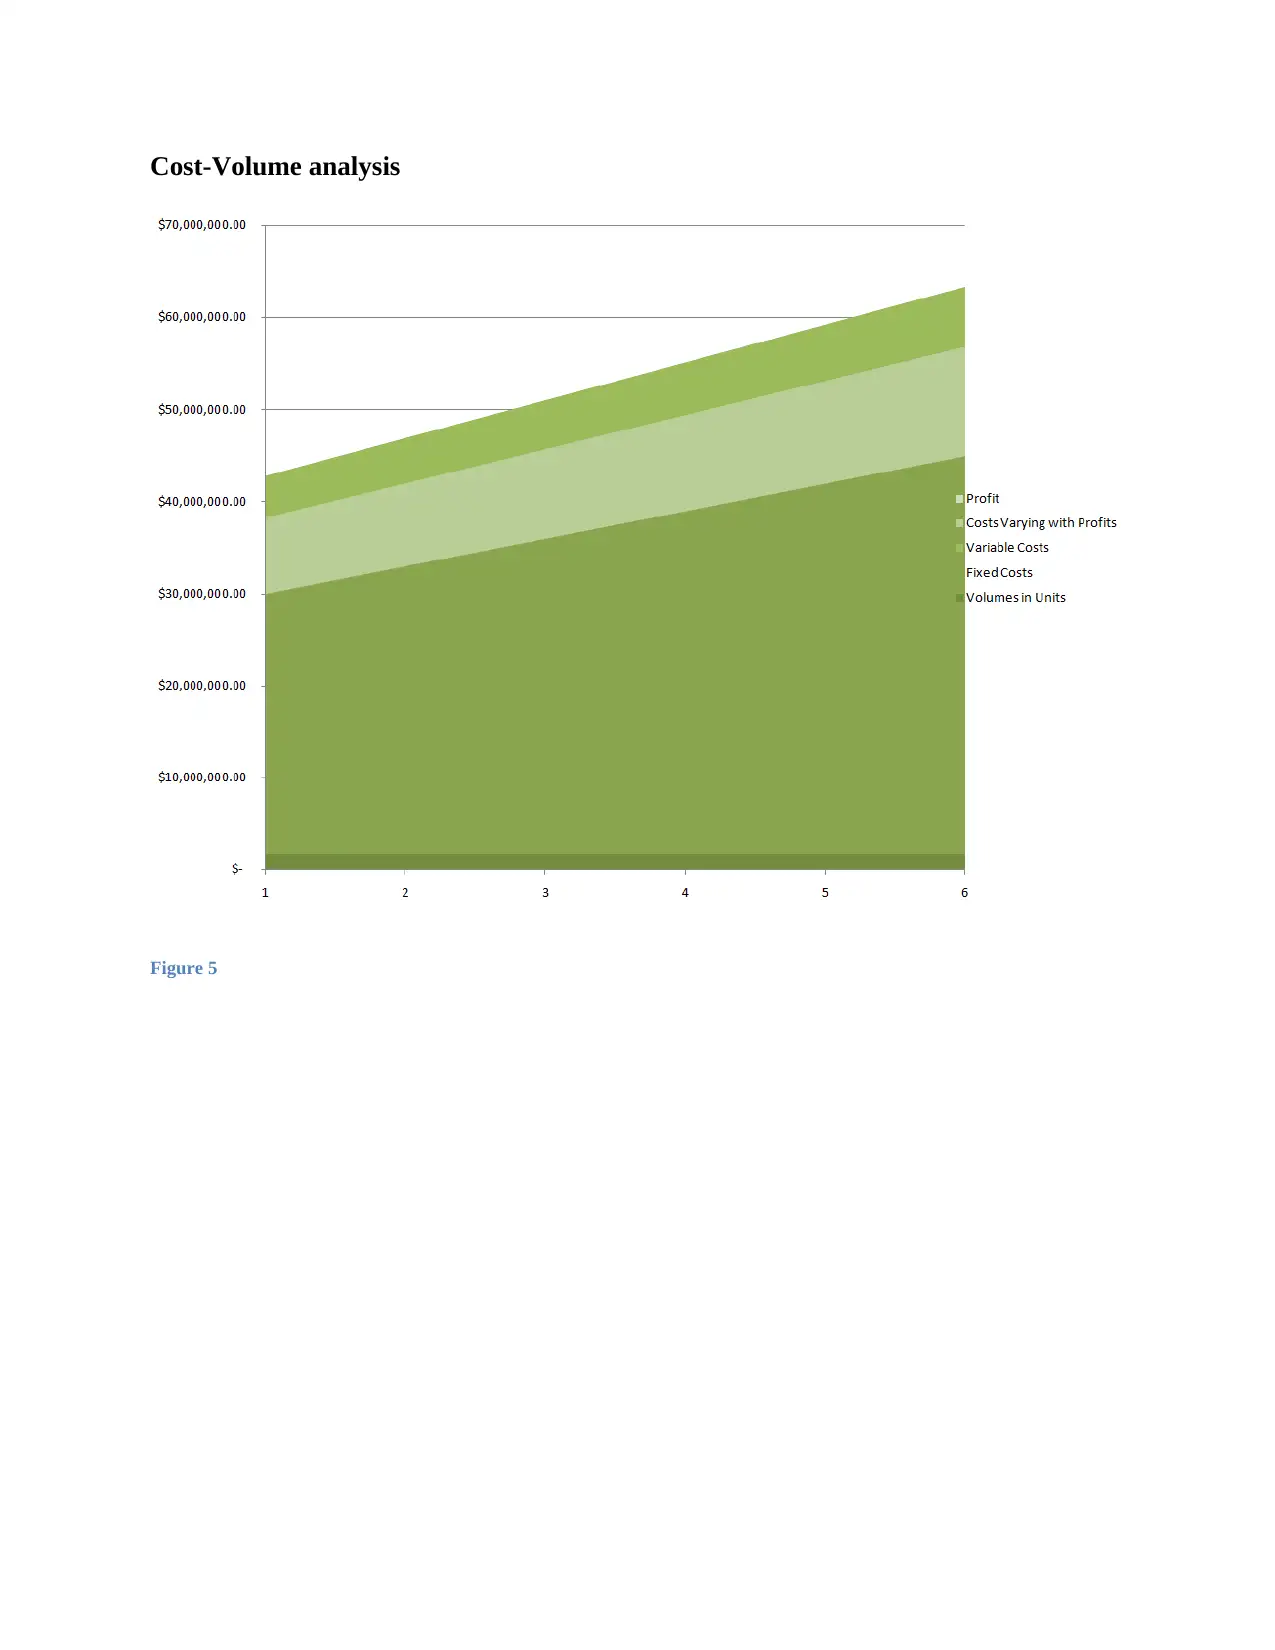
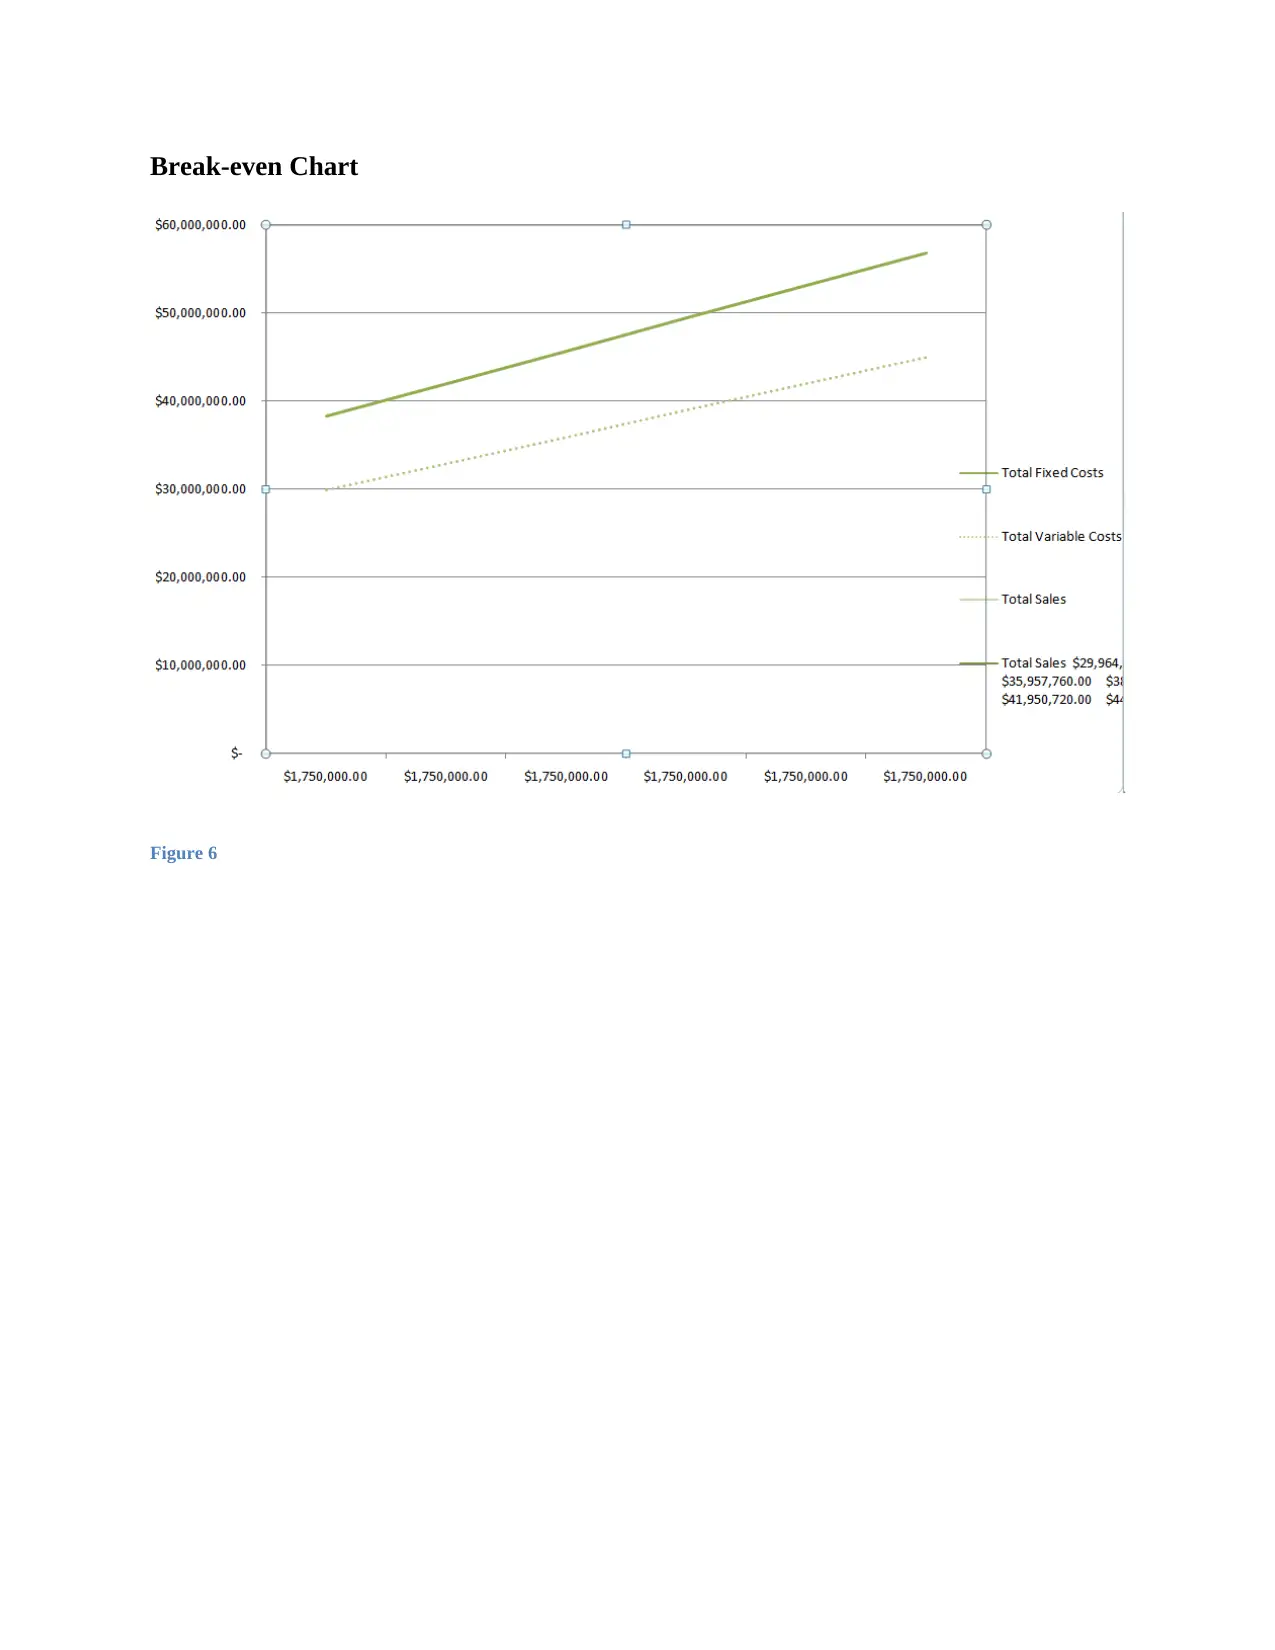
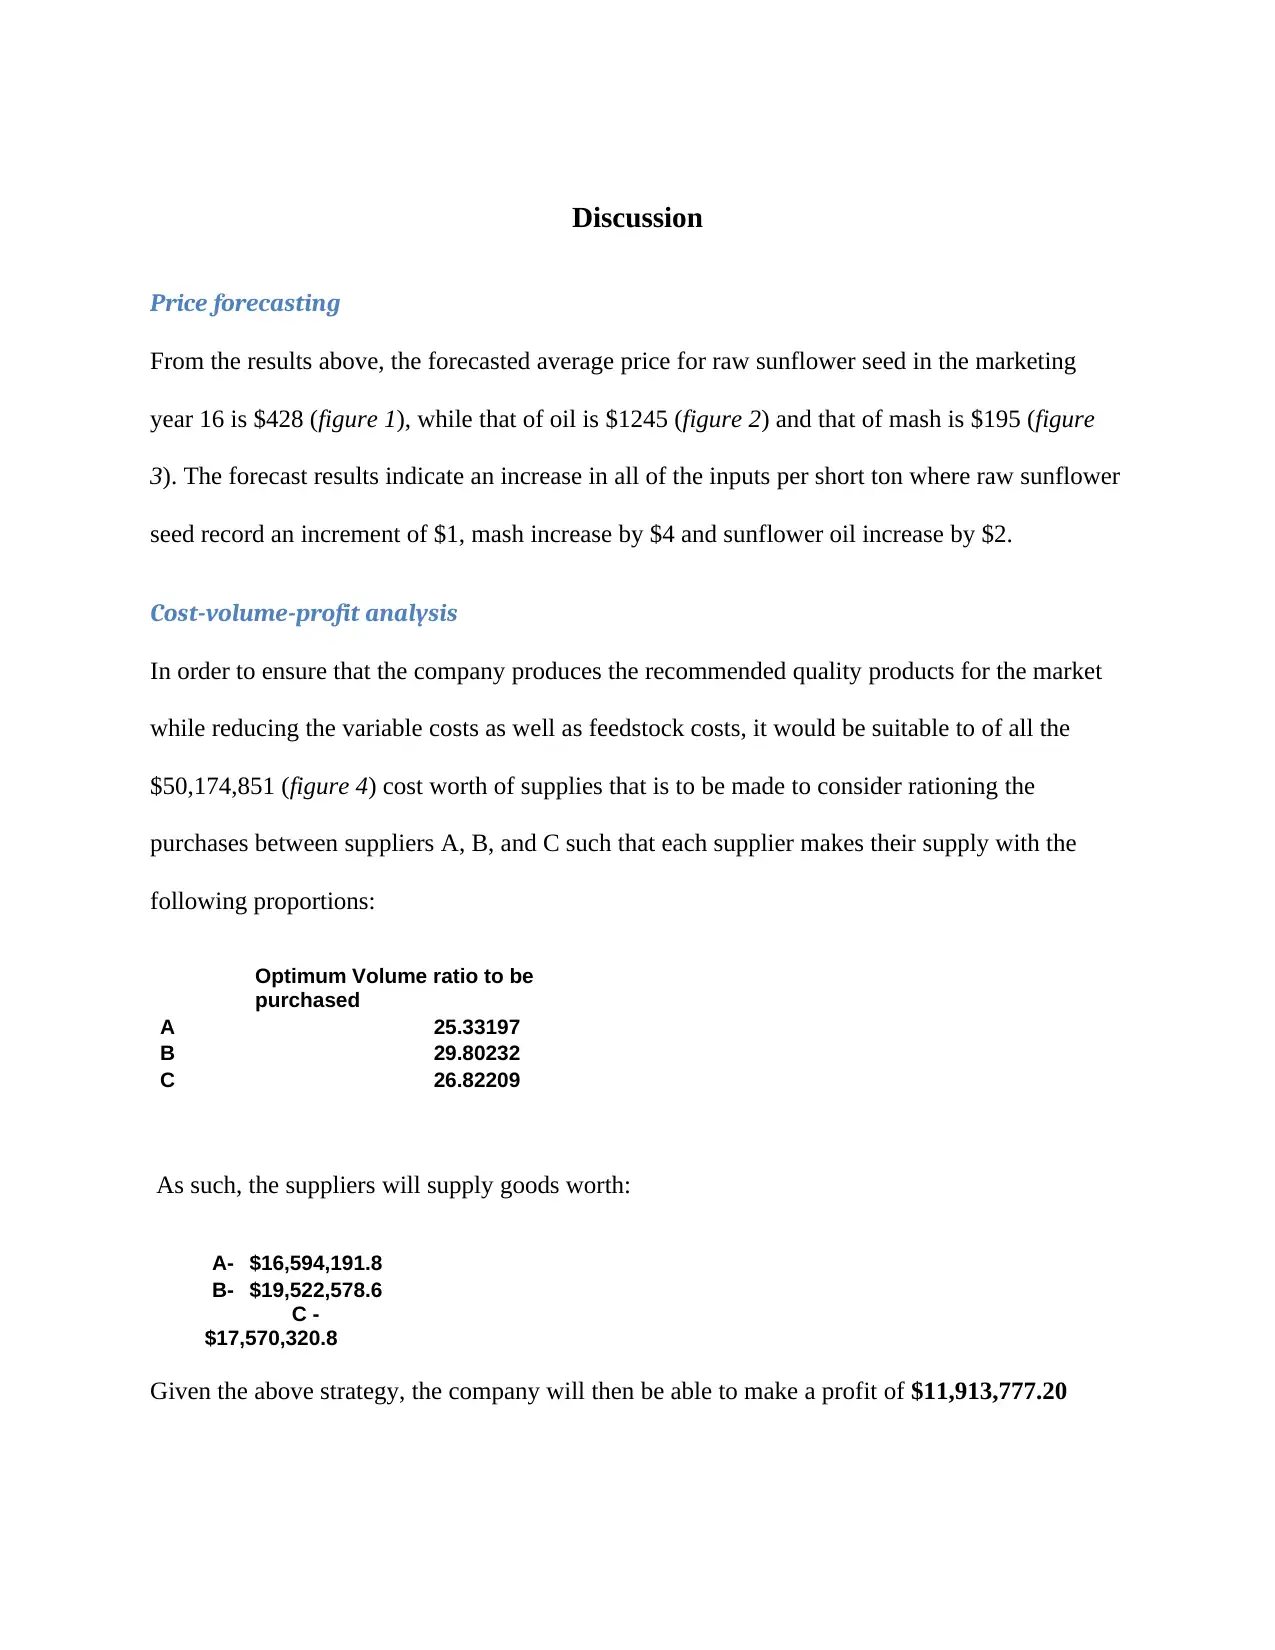
This report analyzes the performance of TourneSol Company, a producer of sunflower oil, using historical data to forecast average purchase prices of production inputs for the upcoming marketing year and to recommend optimal supplier strategies to minimize feedstock costs while maintaining product quality. The analysis employs exponential smoothing for forecasting, linear programming to determine the optimal blend of raw materials from different suppliers, and cost-volume-profit analysis to assess profitability. The study identifies the optimal proportions of raw materials to purchase from each supplier to minimize costs and ensure the required iodine and oleic acid content in the final product. The results indicate an increase in input prices, but with a projected 90% running capacity, the company is set to make a profit. The report provides recommendations to improve the company's performance, including sourcing raw inputs with higher concentrations of oleic acid, insuring against risks, and increasing production capacity.
Document Page
Introduction
When it comes to product production and business, it is always prudent to monitor every step of
production as well as be able to:
i. Minimize the cost of production
ii. Forecast the market behavior
iii. And, trace the performance of the company
Purpose of report
The purpose of this report is to analyze the performance of TourneSol Company using historical
data so as to be able to forecast factors such as average purchase prices of the production inputs
in the coming year i.e. marketing year 16. In addition be able to offer recommendation as to
which supplier to purchase from which % of input so as to minimize the feedstock cost. The
paper uses the Anderson et al (2015) descriptive, predictive and analytics text for application in
excel solver where applicable to enable data-driven decision analysis and making.
Description of problem
In the production of Oil by the company, the maximum amount of iodine required is 0.88% and
the minimum is 0.78% while the minimum Oleic acid that should be in the product should be
77%. Each supplier has a different kind of raw material that has different concentrations of the
required contents. The task is to determine at which percentage of raw material the company
should purchase from each supplier to ensure minimum cost of feedstock while attaining the
required content for quality oil.
tabler-icon-diamond-filled.svg

Paraphrase This Document

Need a fresh take? Get an instant paraphrase of this document with our AI Paraphraser
Document Page
Assumptions
In the preparation of cost-volume-profit data, entries such as taxes are obtained from government
source so as to enable an almost real-life business situation (they are subject to change).
Methodology
Forecasting
The method used for forecasting in this report is the exponential smoothening. According to
Otext (2017), “…all future forecasts are equal to the last observed value.”
Hence:
yT+h|T=yT
Where h= 1, 2, 3… which is the naïve method that supposes that only the latest observation is the
most important. In exponential forecasting each forecast is solved through applying weighted
averages such that they decrease in an exponential manner as the historical data gets older
(Makridakis and Hibon, 2013).
yT+1|T=αyT+α(1−α)yT−1+α(1−α)2yT−2+
According to Casey (2018) the triple exponential smoothening takes the form:
It = Β xt/SSt + (1-Β)It-L+m
Where:
x = observation,
SS = smoothed observation,
Document Page
B = trend factor
I = seasonal index,
F = forecast m periods ahead,
t = time period.
Forecasting data
The forecasting data is extracted from the company’s historical data for the past 15 marketing
years with the 15th year being the current year.
Linear Programming
In linear programming, we have 2 variables i.e. x and y with 3 constraints such that:
Where X denotes amount of Iodine present in each supplier’s raw material and Y is the amount
of Oleic acid available.
So as to obtain the ratios that the company has to purchase from each supplier to minimize the
feedstock cost.
From the initial problem, the least amount of iodine that should be available in the product is
0.78% while that of Oleic acid is 77%. Supplier C has 0.72% iodine and 65% Oleic acid,
contents that are less than the least required by the company’s product.
Document Page
tabler-icon-diamond-filled.svg

Paraphrase This Document

Need a fresh take? Get an instant paraphrase of this document with our AI Paraphraser
Document Page
Results
Forecasting
1
3
5
7
9
11
13
15
0
100
200
300
400
500
600
700
Seed Forecast
Seed Average Price Index
$/short ton
Forecast
Marketing Year
Seed Average Price Index $/short ton
Figure 1
1
3
5
7
9
11
13
15
0
200
400
600
800
1000
1200
1400
1600
1800
Oil Forecasting
Oil Average Price Index
$/short ton
Forecast
Marketing Year
Oil Average Price Index $/short ton
Figure 2
Document Page
1
3
5
7
9
11
13
15
0
50
100
150
200
250
300
Mash Forecasting
Mash Average Price Index
$/short ton
Forecast
Marketing Year
Mash Average Price Index $/short ton
Figure 3
Linear programming
Figure 4
Document Page
Cost-Volume analysis
Figure 5
tabler-icon-diamond-filled.svg

Paraphrase This Document

Need a fresh take? Get an instant paraphrase of this document with our AI Paraphraser
Document Page
Break-even Chart
Figure 6
Document Page
Discussion
Price forecasting
From the results above, the forecasted average price for raw sunflower seed in the marketing
year 16 is $428 (figure 1), while that of oil is $1245 (figure 2) and that of mash is $195 (figure
3). The forecast results indicate an increase in all of the inputs per short ton where raw sunflower
seed record an increment of $1, mash increase by $4 and sunflower oil increase by $2.
Cost-volume-profit analysis
In order to ensure that the company produces the recommended quality products for the market
while reducing the variable costs as well as feedstock costs, it would be suitable to of all the
$50,174,851 (figure 4) cost worth of supplies that is to be made to consider rationing the
purchases between suppliers A, B, and C such that each supplier makes their supply with the
following proportions:
Optimum Volume ratio to be
purchased
A 25.33197
B 29.80232
C 26.82209
As such, the suppliers will supply goods worth:
A- $16,594,191.8
B- $19,522,578.6
C -
$17,570,320.8
Given the above strategy, the company will then be able to make a profit of $11,913,777.20
Document Page
If the company supplies a total volume of 60000 tons in year 16 at an average sales unit price of
$749.1202 and $ 11,195,358.72 if it supplies total volume of 56,000 tons, however, if the
company runs at a capacity of 90% producing almost 48,000 tons, it will be able to make sales
worth $ 35,957,760.00 and make a profit of $ 9,758,521.76 after all deductions are made which
include taxes and other production costs.
Risks and uncertainties
The above figures are from an ideal production environment during the marketing year in
everyday operations; however, the company has to face variances in most of their departments.
Factors such as industrial actions, environmental hazards, change in government policies,
termination of contracts by suppliers etcetera may cause a shift in the sales-profit graph such that
negative effects will lead to the shift of the profit graph to the right as well as the sales graph
leading to a decrease in both assuming the fixed costs and variable costs remain constant. The
above risks and uncertainties are likely to cause wavering in the profits projected hence it would
be crucial to account for them in the regression model so as to project up to what percentage they
are likely to affect the company performance.
Analysis and opinion on the profitability
Despite a slight increase in the input prices, given the projected 90% running capacity of the
company producing an estimated 150 short tons a day the company is set to make profits of up
to: $8,321,684.80 if the company produces at least 40,000 short tons a year. Therefore the
company will be able to cover all the fixed costs, varying costs such as government taxes and
insurance. The projected increase in profits is largely accounted by the optimal purchase from all
the three suppliers hence ensuring minimal feedstock cost.
tabler-icon-diamond-filled.svg

Paraphrase This Document

Need a fresh take? Get an instant paraphrase of this document with our AI Paraphraser
Document Page
Document Page
Conclusion
In conclusion, the company’s projected performance is dependent on a wide range of factors
both internal and external i.e. those beyond the company’s control. However after considering
internal factors in an ideal condition and the already known external such as government taxes,
the company is set for a relatively good production year 16.
Recommendations
To ensure better projection of the company’s performance, the following three recommendations
are made for consideration to the executive:
i. The executive should seek suppliers whose raw inputs have relatively higher
concentrations of Oleic acid, this will ensure minimal requirement of many suppliers
ii. The company should consider insuring against risks that may lead to bad losses since it is
not always that risks can be included in a forecasting model hence may go undetected
iii. The company should purchasing more plant power so as to increase the production
capacity of the company to at least 60,000 short tons a year so as to increase both sales
and profits.
chevron_up_icon
1 out of 13
circle_padding
hide_on_mobile
zoom_out_icon
[object Object]