Toyota's Australian Exit: Economies of Scale and Industry Analysis

Verified

Added on  2019/09/23

|8
|1530
|223
Essay
AI Summary
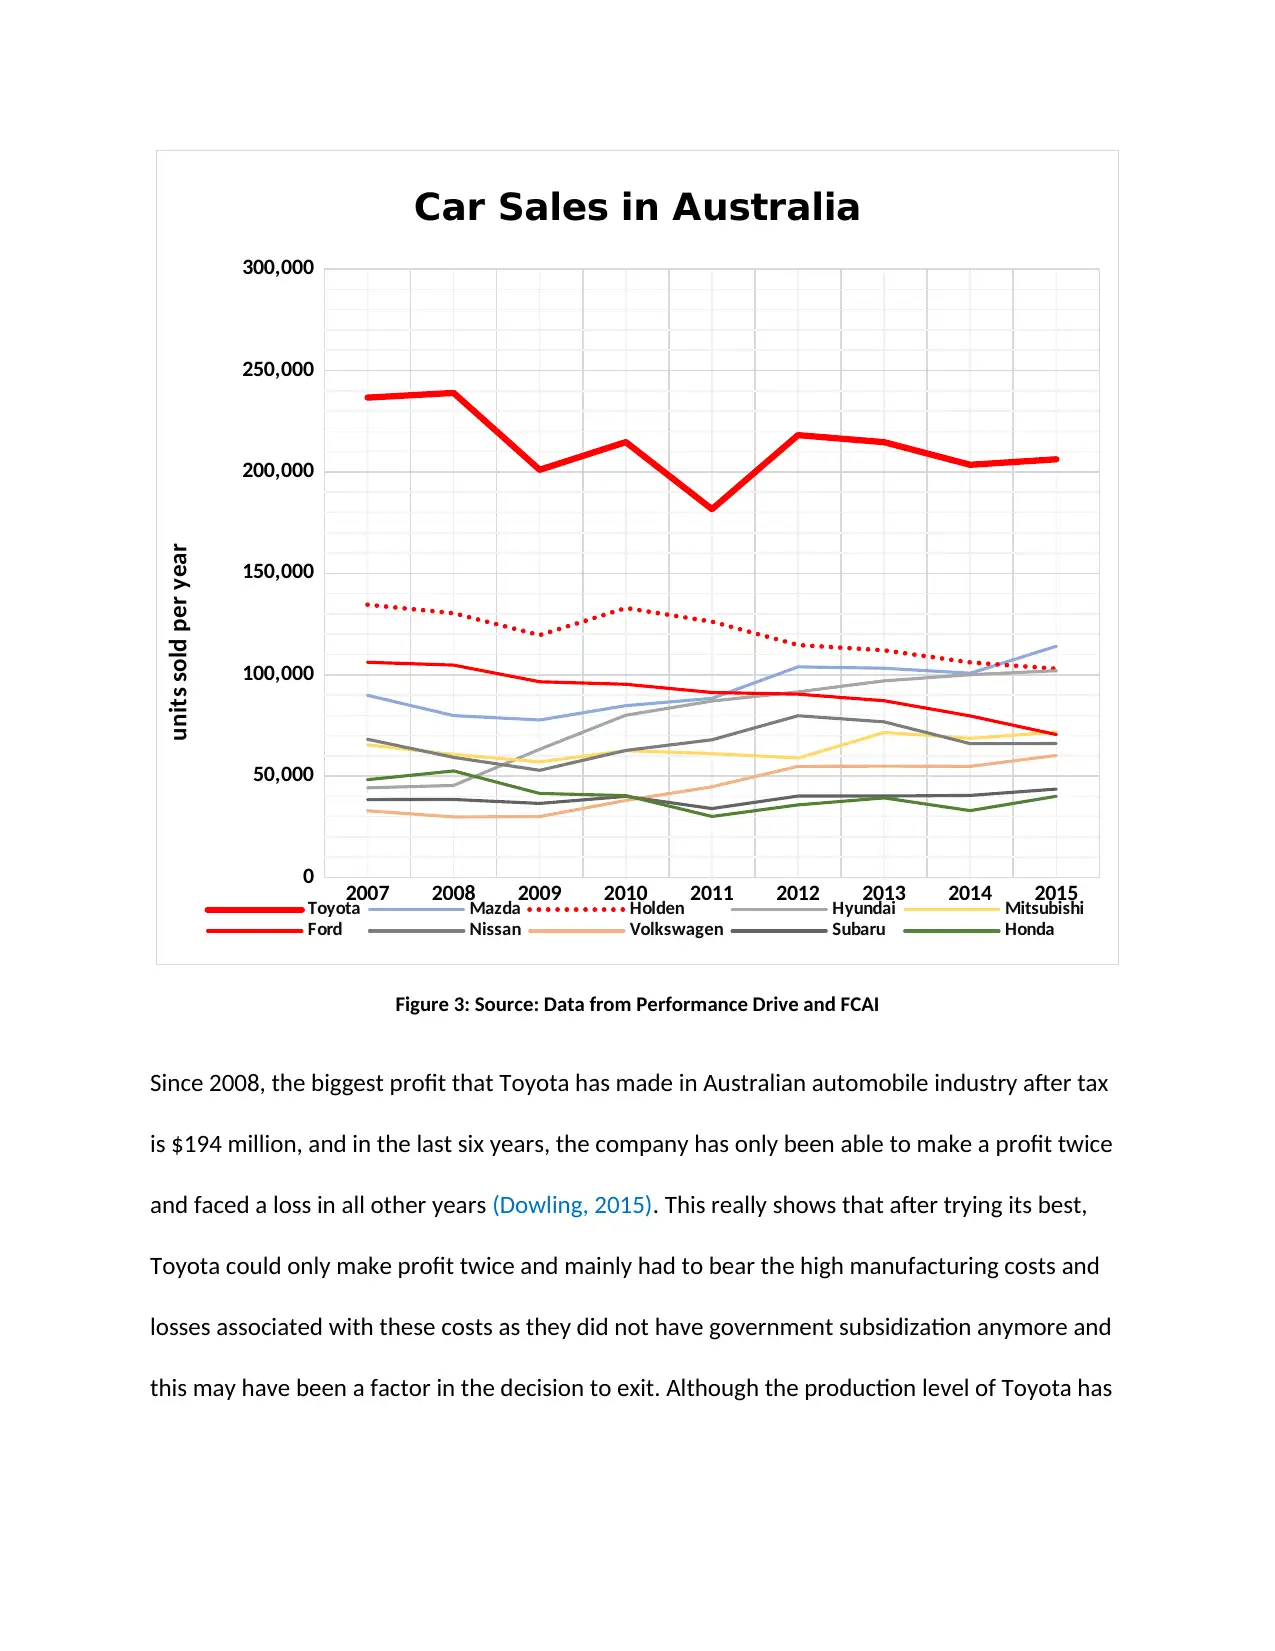
This essay critically analyzes the application of economies of scale (EOS) in the context of Toyota's decision to cease car manufacturing in Australia. It examines the factors influencing the company's ability to achieve EOS, including high wages, unfavorable exchange rates, and global competition. The essay highlights the importance of producing at an optimal level to reduce costs and remain competitive, noting that Australian carmakers were operating below the minimum efficient scale (MES). It discusses how the high production costs, coupled with a strong Australian dollar and low barriers to import, limited sales and profitability. The essay concludes that Toyota's inability to achieve EOS, due to these various economic factors, was a primary driver behind its withdrawal from the Australian market, and that future car producers would likely move to countries with lower costs of production.
tabler-icon-diamond-filled.svg

Contribute Materials

Your contribution can guide someone’s learning journey. Share your documents today.
Document Page
After half a century of operation, the leading vehicles maker Toyota decided to stop car
manufacturing in Australia by the end of 2017. In like manner, General Motor and Ford made
the same decision previously, which put an end to the car manufacturing industry in Australia.
This seems to be a steep step for companies that large, but there are certainly some reasonable
motives behind this withdrawal. Including the exchange rate, high wages, and economic factors
of Australia, economies of scale also seems to be one of the most influential factors in the
companies’ decision (Griffiths, 2014). This essay will critically analyze the application of
economies of scale in car manufacturing industry, besides analyzing the factors that influence
companies in Australia and Toyota particularly in achieving economies of scale.
The concept of EOS is when the average cost –cost per unit of output- of a company’s
production starts to reduce with increased production (Baye, 2010). Focusing on producing the
optimal level of output to reduce the cost by car production companies is substantial to be
competitive enough to sustain in the market. Producing in low volumes can be viable only in
case the company decided to focus on niche vehicles, which its unit costs can observed by the
high profit margins. The main sources of EOS in car manufacturing are the learning effects,
specialization, research and development, purchasing economies and invisibilities (Husan,
1997). The Toyota plant is estimated to produce 90,000 cars in 2015 (Dowling, 2015).
The MES is the lowest production point at which the LRATC as minimised. In Australia,
carmakers should produce minimum 250,000 vehicles per year which is the MES value in order
to gain sufficient EOS. This was the best practice identified for car manufacturers in Australia
(Dowling, 2014). However, all automakers in Australia are producing below that level, even
tabler-icon-diamond-filled.svg

Secure Best Marks with AI Grader

Need help grading? Try our AI Grader for instant feedback on your assignments.
Document Page
their combined production are significantly lower than 250,000 with Toyota Australia making
90000 cars in 2015 (Dowling, 2015). As the companies are operating below the MES they will
incur higher AC than optimal.
The graph bellow can show how far total production of cars in Australia is from this target
level. It also shows a reduction of the production volume over the period, which signals that
there are some obstacles, faced car producers in Australia.
Figure 1a: Source: (FCAI, 2016)
Figure 1b: Source: (FCAI, 2016)
2 0 1 0 2 0 1 1 2 0 1 2 2 0 1 3 2 0 1 4 2 0 1 5
0
50,000
100,000
150,000
200,000
250,000
300,000
P r o d u c tio n Vo l u me o f A u st r a l i an A u t o mo tiv e
In d u st r y
Cars per Year
Production Volume of Australian
Automotive Industry
2010 239,443
2011 219,376
2012 221,224
2013 210,538
2014 174,986
2015 167,538
Document Page
Production costs, causes a major issue in achieving EOS. Relative with other countries in the
world, the costs of vehicle production in Australia are significantly higher. Another factor that
added to the problem is the high wage rate in Australia that raised the operating cost for the
company and made the production even more unfavorable. Holden mentioned that it cost near
$2000 more in input to produce a car in Australia comparing with other plants owned by
Gereral Motors, which 80% derived by wages (Griffiths, 2014). Today vehicle manufacturers are
shifting their operations to regions with low wages and growing demand such as India and
China, so it will be unviable for the three car producers in Australia to continue their costly
production while other competitors can benefit from low costs.
Ford, Toyota, Holden and many other automotive component manufacturers have enterprise
agreements in place and some have different agreements for different groups of employees
(Australian Government Productivity Commission, 2014). The comparison of wages in the
manufacturing sector in Australia and Thailand is as below:
Measure Australia Thailand
Wages measure Weekly Monthly
Units AUD THB
Actual Wages 1282.70 AUD/Week 12416.10 THB/Month
Figure 2: Source: (TradingEconomics, 2016a, 2016b)
Document Page
Apart from this, the global competition in the automobile industry is certainly fierce, and the
economic conditions in Australia have not been supportive enough for car producers to afford
the competition. The unaffordable exchange rate of Australia makes exports of goods and
services certainly unviable (Maggo, 2015). The appreciation in its exchange rate causes a
reduction in aggregate demand for cars. When dollar increases, exports become expensive to
purchase by foreigners. Therefore, local car manufacturers were unable to make profits from
exports, especially that they have to compete against their global parents’ affiliates. In addition
to that, they have also loosed their local sales due to the fragmentation of the Australian
market. It is one of the most open markets with low barriers for imports resulted from free
trade agreements. This market structure alongside with the strong exchange rate limited the
sales of the three car producers in Australia, although they have the highest selling cars (Amiti,
2016). Many local customers in Australia are now buying from the low priced imported cars,
which are subject low or zero tariff by the government. This shift in the market limited the sales
of Australian- based cars, and that can be note from the following graph.
tabler-icon-diamond-filled.svg

Secure Best Marks with AI Grader

Need help grading? Try our AI Grader for instant feedback on your assignments.
Document Page
2007 2008 2009 2010 2011 2012 2013 2014 2015
0
50,000
100,000
150,000
200,000
250,000
300,000
Car Sales in Australia
Toyota Mazda Holden Hyundai Mitsubishi
Ford Nissan Volkswagen Subaru Honda
units sold per year
Figure 3: Source: Data from Performance Drive and FCAI
Since 2008, the biggest profit that Toyota has made in Australian automobile industry after tax
is $194 million, and in the last six years, the company has only been able to make a profit twice
and faced a loss in all other years (Dowling, 2015). This really shows that after trying its best,
Toyota could only make profit twice and mainly had to bear the high manufacturing costs and
losses associated with these costs as they did not have government subsidization anymore and
this may have been a factor in the decision to exit. Although the production level of Toyota has
Document Page
been impressive and the company made 90,000 cars in 2015 that was five times more than
Ford, the cost of production was high that did not allow it to achieve EOS (Kewk, 2014).
There are a variety of reasons caused the regression of Toyota and other automotive producers
to in Australia and lead them to decide shutting down their production. These reasons included
increased wages in the country, high exchange rate, an unfavourable rate of the Australian
dollar and other economic factors. The most dominant reason behind this decision is the
inability of the companies to achieve the EOS. EOS enable a company to reduce its average cost
with increased production. However, this did not happen in the case of Australian- based
producers who faced excessive pressure from their competitors in the global market. As a
result, they were unable to gain a competitive advantage. In conclusion, it expected that car
producers would move after Australia to low-cost countries that have a favourable exchange
rate and cheap labour costs as well (Griffiths, 2014). This will allow a better condition for Toyota
and other companies to adjust their production in order to attain EOS and be able to sustain in
the competition.
Word Count:
Document Page
References:
Amiti, M. (2016) What impact do exchange rates have on domestic prices? [online]. Available
from https://www.weforum.org/agenda/2016/04/what-impact-do-exchange-rates-have-on-
domestic-prices
Australian Government Productivity Commission. (2014) Australia's Automotive Manufacturing
Industry – Inquiry [online] Available from:
http://www.pc.gov.au/inquiries/completed/automotive/report
Baye, M. (2010) Managerial Economics and Business Strategy 7th ed. Singapore: McGraw-Hill
Dowling, J. (2015) Toyota Australia posts $194 million profit after announcing factory shutdown
in 2017 [online]. Available from
http://www.news.com.au/finance/business/manufacturing/toyota-australia-posts-194-million-
profit-after-announcing-factory-shutdown-in-2017/news-story/
ddd8db2bedfa83c6af0c935ea8bdb372
Griffiths, E. (2014) Toyota to close: Thousands of jobs to go as carmaker closes Australian plants
by 2017 [online]. Available from http://www.abc.net.au/news/2013-12-11/holden-to-cease-
manufacturing-operations-in-australia-by-2017/5150034 [5th Oct 2016]
Husan, R. (1997) ‘The continuing importance of economies of scale in the automotive industry’.
European Business Review 65 (4), 721-753
Kwek, G. (2014) Don’t blame the dollar: Toyota exit was inevitable, say economists [online].
Available from http://www.smh.com.au/business/dont-blame-the-dollar-toyota-exit-was-
inevitable-say-economists-20140210-32cym.html
Maggo, V. (2015) ‘Toyota is leaving Australia’. Indian journal of applied research 5 (9), 362-364
TradingEconomics. (2016a) Australia Average Weekly Wages In Manufacturing [online].
Available from: http://www.tradingeconomics.com/australia/wages-in-manufacturing
Tradin Economics. (2016b) Thailand Average Monthly Wages in Manufacturing[online].
Available from: http://www.tradingeconomics.com/thailand/wages-in-manufacturing
tabler-icon-diamond-filled.svg

Paraphrase This Document

Need a fresh take? Get an instant paraphrase of this document with our AI Paraphraser
Document Page
chevron_up_icon
1 out of 8
circle_padding
hide_on_mobile
zoom_out_icon
logo.png

Your All-in-One AI-Powered Toolkit for Academic Success.

Available 24*7 on WhatsApp / Email

[object Object]