Operational Information System Analysis: Toyota Supply Chain Report

Verified

Added on  2023/06/08

|8
|1118
|304
Report
AI Summary
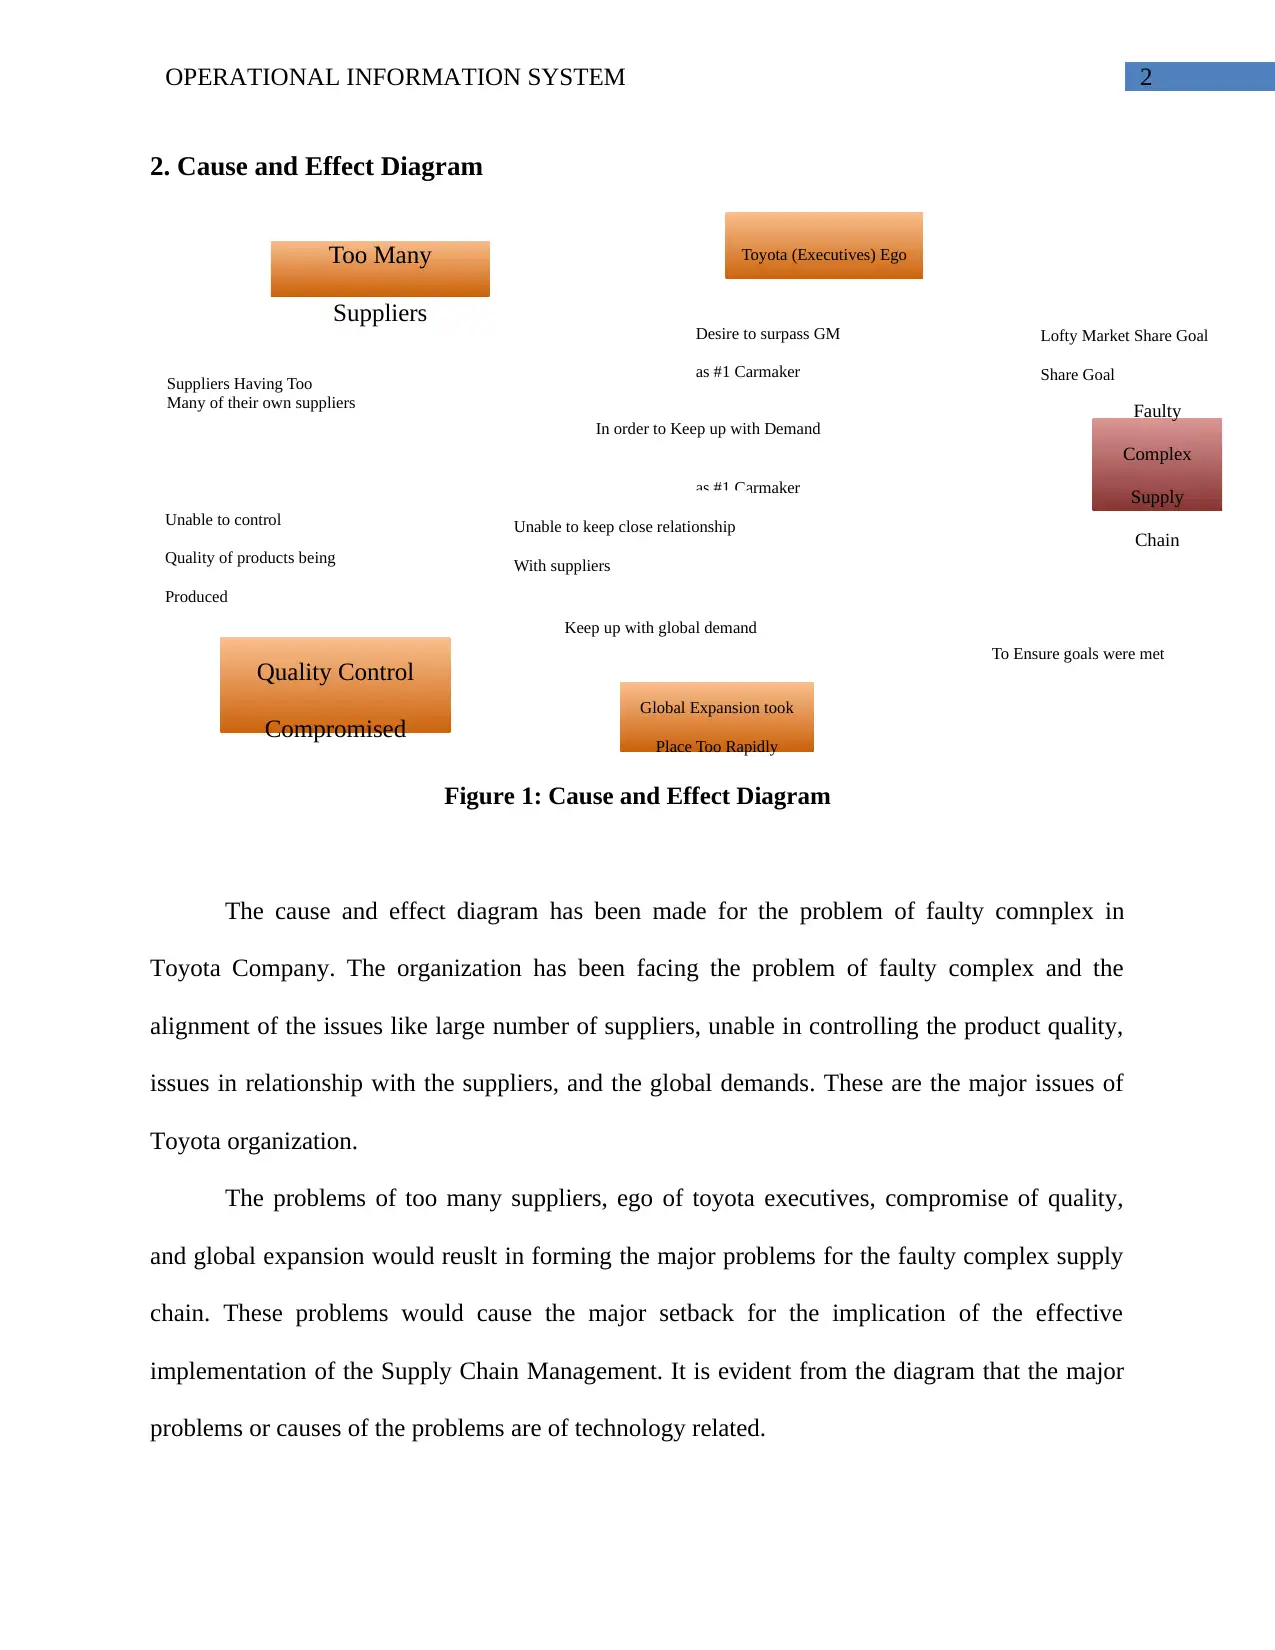
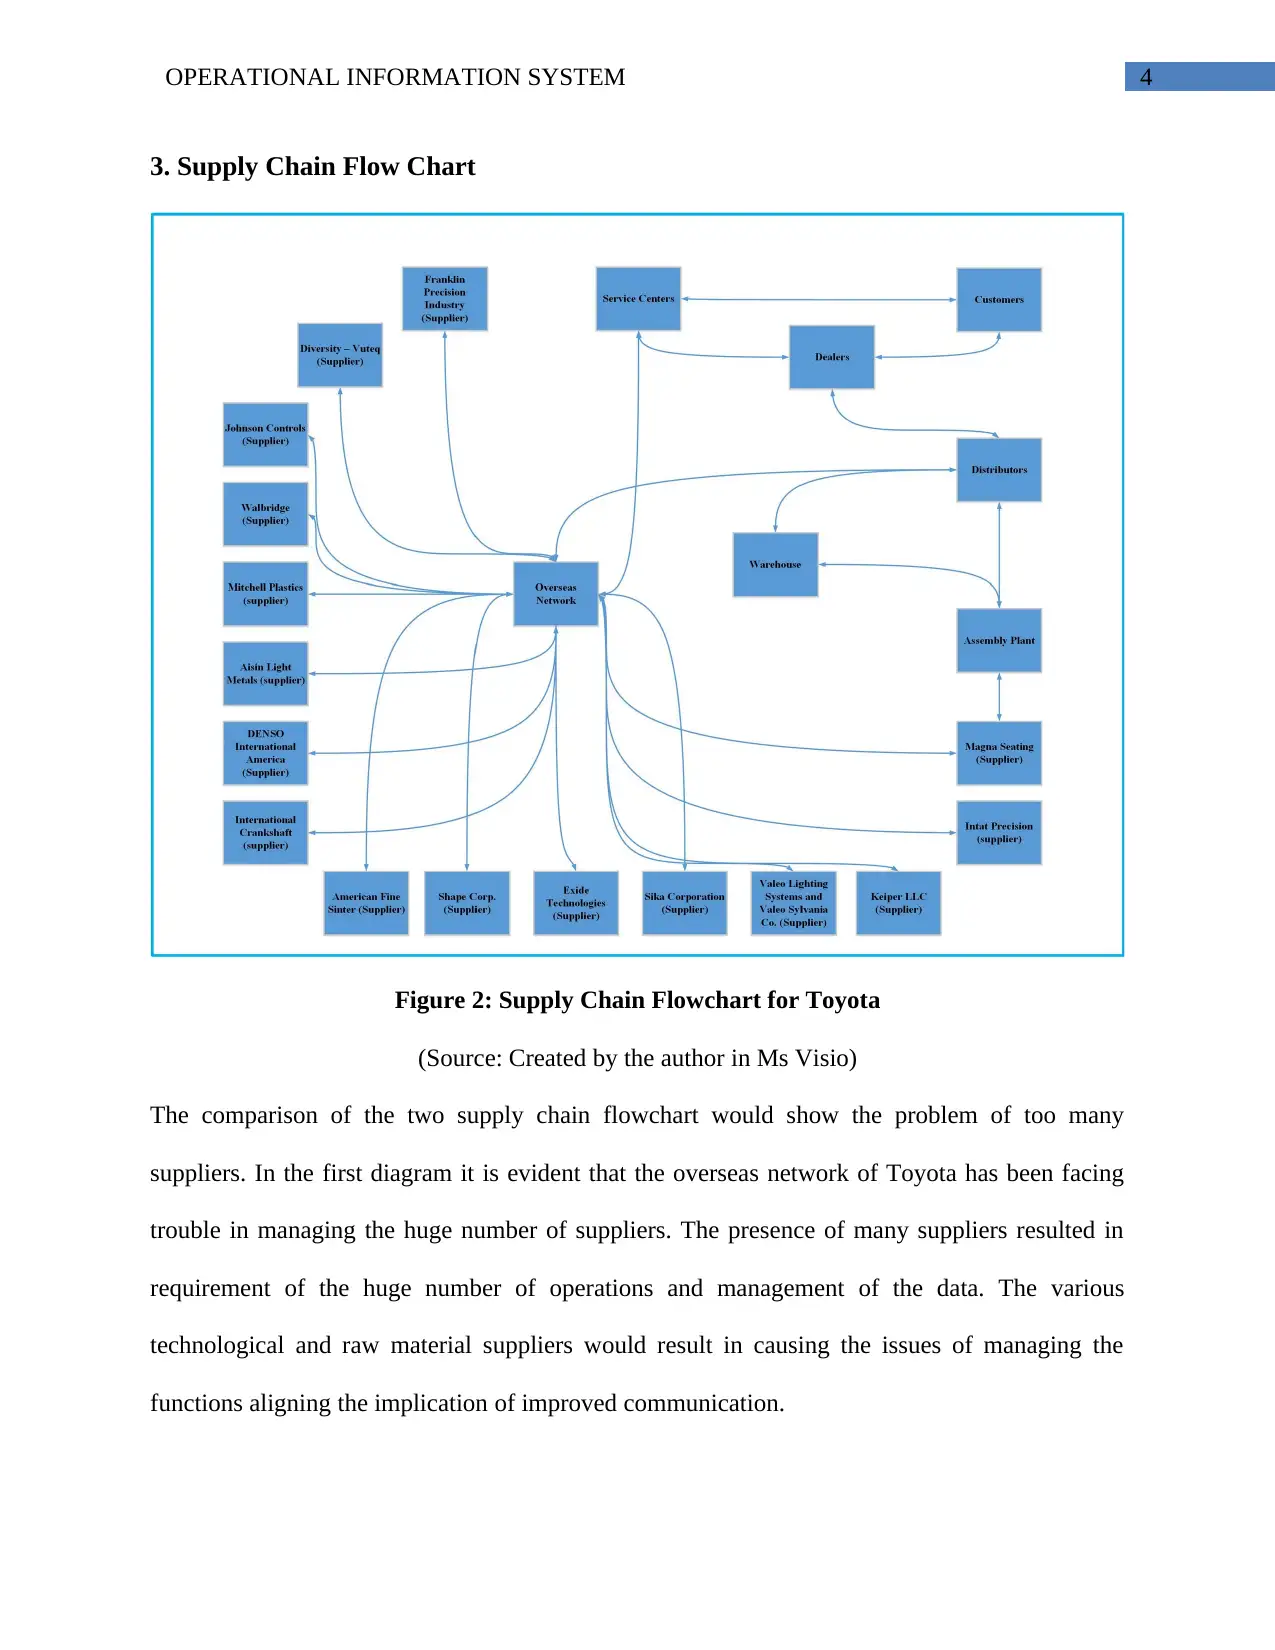
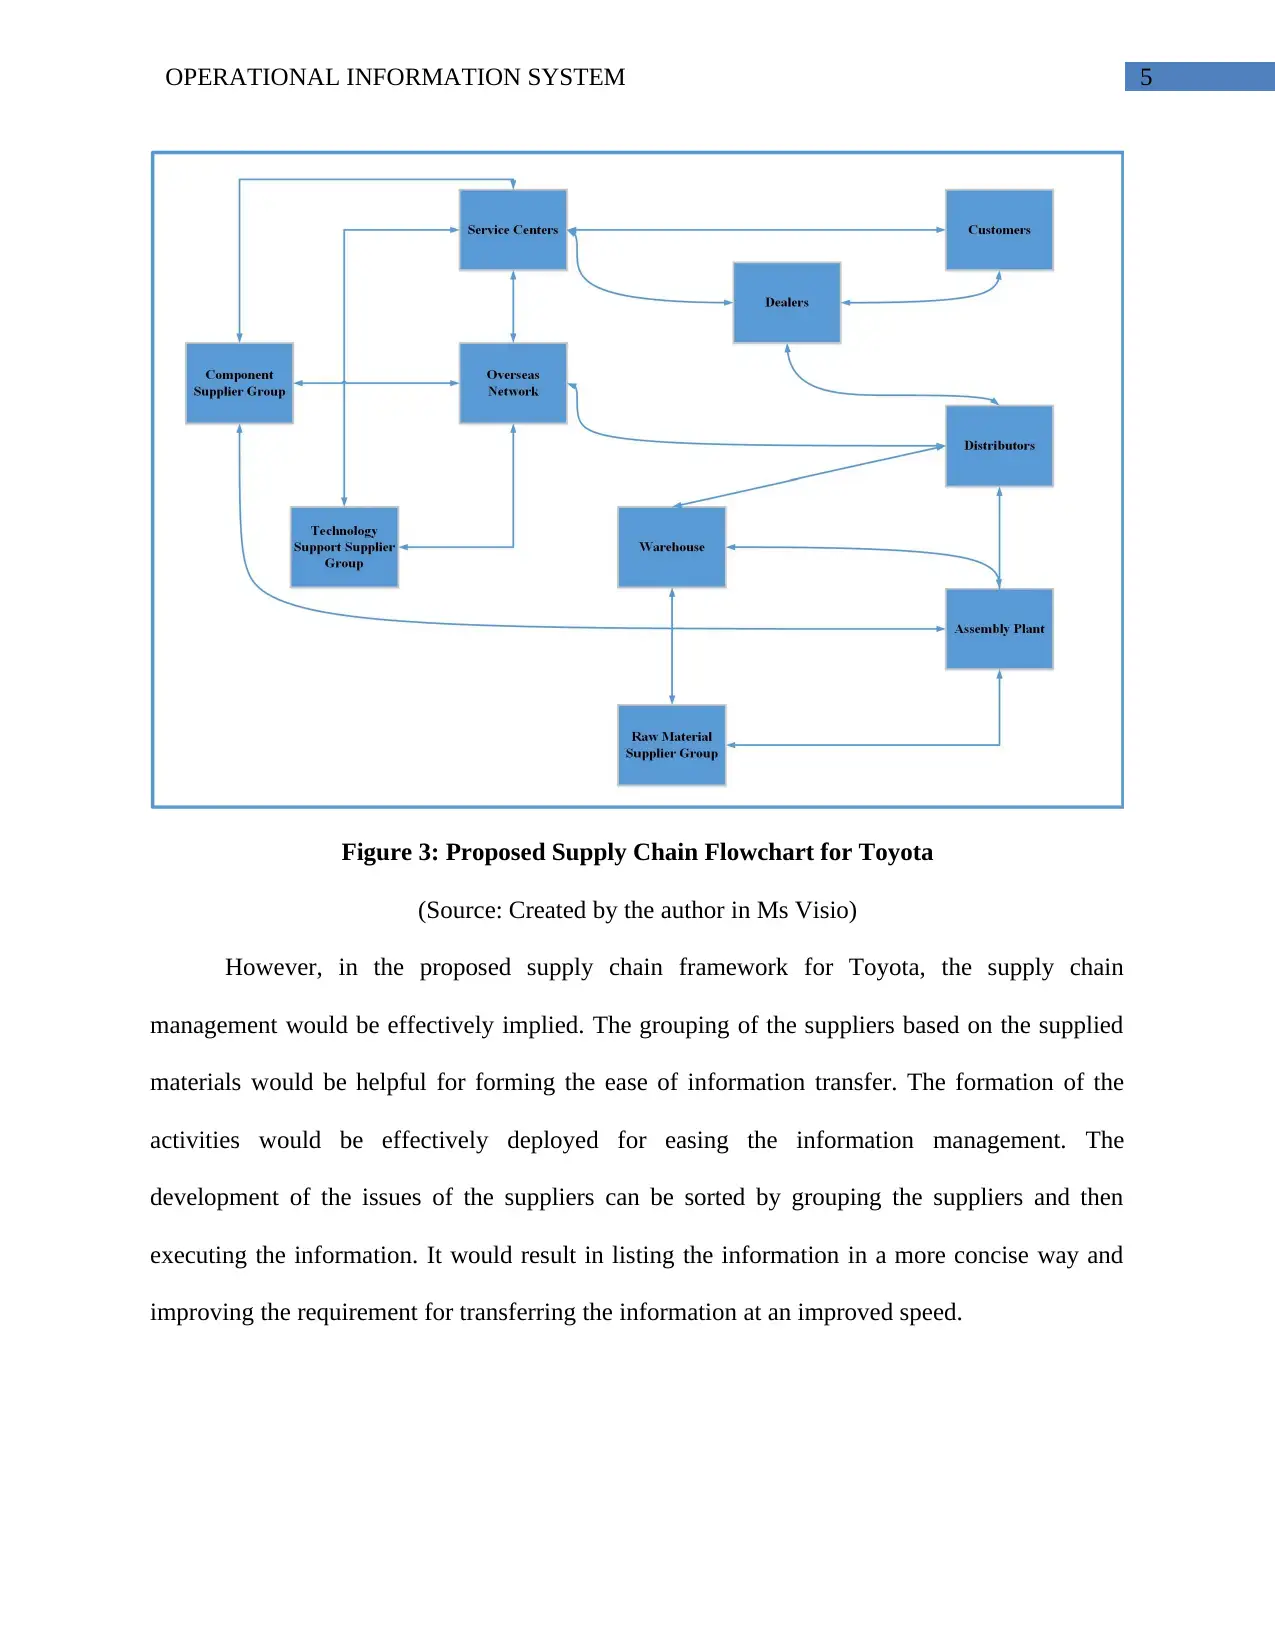
This report examines the operational information system of Toyota, focusing on its supply chain. It utilizes a cause-and-effect diagram to identify the causes of faulty complexities, such as too many suppliers, executive ego, and rapid global expansion. The report then presents a flowchart of Toyota's supply chain, contrasting the existing system with a proposed improved framework that groups suppliers based on material type to facilitate information transfer and improve efficiency. The analysis highlights the problem of managing numerous suppliers and proposes a solution to streamline the process, ultimately aiming to improve supply chain management and stakeholder engagement. The conclusion emphasizes the importance of processing activities and graphical representations in managing and improving organizational functions.
Document Page
Running head: OPERATIONAL INFORMATION SYSTEM
Operational Information System
Name of the Student:
Student ID:
Name of the University:
Author’s note:
tabler-icon-diamond-filled.svg

Secure Best Marks with AI Grader

Need help grading? Try our AI Grader for instant feedback on your assignments.
Document Page
1OPERATIONAL INFORMATION SYSTEM
1. Introduction
The following assignment had been developed for forming an understanding of the
operational information system development for the organization. The simplification of the
operations would allow the utilization of the cause and effect diagram and the graphical flow
charts for executing the analysis of the smart development processing. The analysis of the cause
and effect diagram would be made in this report and the implication of the analysis would be
based on the utilization of the process implication management. The second part of the
assignment would include the flowchart for the supply chain operations of Toyota.
Document Page
2OPERATIONAL INFORMATION SYSTEM
2. Cause and Effect Diagram
Figure 1: Cause and Effect Diagram
The cause and effect diagram has been made for the problem of faulty comnplex in
Toyota Company. The organization has been facing the problem of faulty complex and the
alignment of the issues like large number of suppliers, unable in controlling the product quality,
issues in relationship with the suppliers, and the global demands. These are the major issues of
Toyota organization.
The problems of too many suppliers, ego of toyota executives, compromise of quality,
and global expansion would reuslt in forming the major problems for the faulty complex supply
chain. These problems would cause the major setback for the implication of the effective
implementation of the Supply Chain Management. It is evident from the diagram that the major
problems or causes of the problems are of technology related.
Toyota (Executives) Ego
Global Expansion took
Place Too Rapidly
Faulty
Complex
Supply
Chain
Suppliers Having Too
Many of their own suppliers
Too Many
Suppliers
Quality Control
Compromised
In order to Keep up with Demand
Lofty Market Share Goal
Share Goal
Desire to surpass GM
as #1 Carmaker
as #1 Carmaker
Unable to keep close relationship
With suppliers
Unable to control
Quality of products being
Produced
Keep up with global demand
To Ensure goals were met
Document Page
3OPERATIONAL INFORMATION SYSTEM
No, the cause and effect diagram has no conflict with the flow chart made for the existing
information system that needs to be improved.
The cause and effect diagram highlights the lack of information problem stating that the
information collection has been executed. However, this process was not mentioned before.
Yes, further studies would be helpful for identifying whether the risk or cause of the
issues in Supply Chain Management development.
Supply Chain Managers play a key role in the development of the effective stakeholder
management process for Toyota. They would depict the continuation of the operations so that the
effective formation and utilization of the processing can be implemented. The stakeholder
analysis would be effectively deployed for easing the utilization of the functions aligning the
utilization of the principles of management.
tabler-icon-diamond-filled.svg

Secure Best Marks with AI Grader

Need help grading? Try our AI Grader for instant feedback on your assignments.
Document Page
4OPERATIONAL INFORMATION SYSTEM
3. Supply Chain Flow Chart
Figure 2: Supply Chain Flowchart for Toyota
(Source: Created by the author in Ms Visio)
The comparison of the two supply chain flowchart would show the problem of too many
suppliers. In the first diagram it is evident that the overseas network of Toyota has been facing
trouble in managing the huge number of suppliers. The presence of many suppliers resulted in
requirement of the huge number of operations and management of the data. The various
technological and raw material suppliers would result in causing the issues of managing the
functions aligning the implication of improved communication.
Document Page
5OPERATIONAL INFORMATION SYSTEM
Figure 3: Proposed Supply Chain Flowchart for Toyota
(Source: Created by the author in Ms Visio)
However, in the proposed supply chain framework for Toyota, the supply chain
management would be effectively implied. The grouping of the suppliers based on the supplied
materials would be helpful for forming the ease of information transfer. The formation of the
activities would be effectively deployed for easing the information management. The
development of the issues of the suppliers can be sorted by grouping the suppliers and then
executing the information. It would result in listing the information in a more concise way and
improving the requirement for transferring the information at an improved speed.
Document Page
6OPERATIONAL INFORMATION SYSTEM
4. Conclusion
It can be concluded from the assignment that the development of the activities for
processing and managing the inclusion. The utilization of the processing had resulted the
formation of the processes and utilization of the improved functions. The graphic flowchart
diagram had been effectively implied for supporting the utilization of the processing and
management. The analysis had helped in understanding that the major problem that Toyota faces
is the presence of too many suppliers. The proposed framework had resulted in forming the
major alignment issues for the functions.
tabler-icon-diamond-filled.svg

Paraphrase This Document

Need a fresh take? Get an instant paraphrase of this document with our AI Paraphraser
Document Page
7OPERATIONAL INFORMATION SYSTEM
5. Bibliography
Gil-Garcia, J. R., & Sayogo, D. S. (2016). Government inter-organizational information sharing
initiatives: Understanding the main determinants of success. Government Information
Quarterly, 33(3), 572-582.
Linam, W. M., Honeycutt, M. D., Gilliam, C. H., Wisdom, C. M., Bai, S., & Deshpande, J. K.
(2016). Successful development of a direct observation program to measure health care
worker hand hygiene using multiple trained volunteers. American journal of infection
control, 44(5), 544-547.
Luo, T., Wu, C., & Duan, L. (2018). Fishbone diagram and risk matrix analysis method and its
application in safety assessment of natural gas spherical tank. Journal of Cleaner
Production, 174, 296-304.
Orlikowski, W. J., Walsham, G., Jones, M. R., & DeGross, J. I. (Eds.). (2016). Information
technology and changes in organizational work. Springer.
Smith, L. C., & Wong, M. A. (Eds.). (2016). Reference and Information Services: An
Introduction: An Introduction. ABC-CLIO.
Srinivasan, R., & Swink, M. (2015). Leveraging supply chain integration through planning
comprehensiveness: An organizational information processing theory
perspective. Decision Sciences, 46(5), 823-861.
chevron_up_icon
1 out of 8
circle_padding
hide_on_mobile
zoom_out_icon
[object Object]