Comprehensive Financial Analysis Report: TPG Telecom Ltd. Performance

Verified

Added on  2021/02/20

|6
|1396
|90
Report
AI Summary
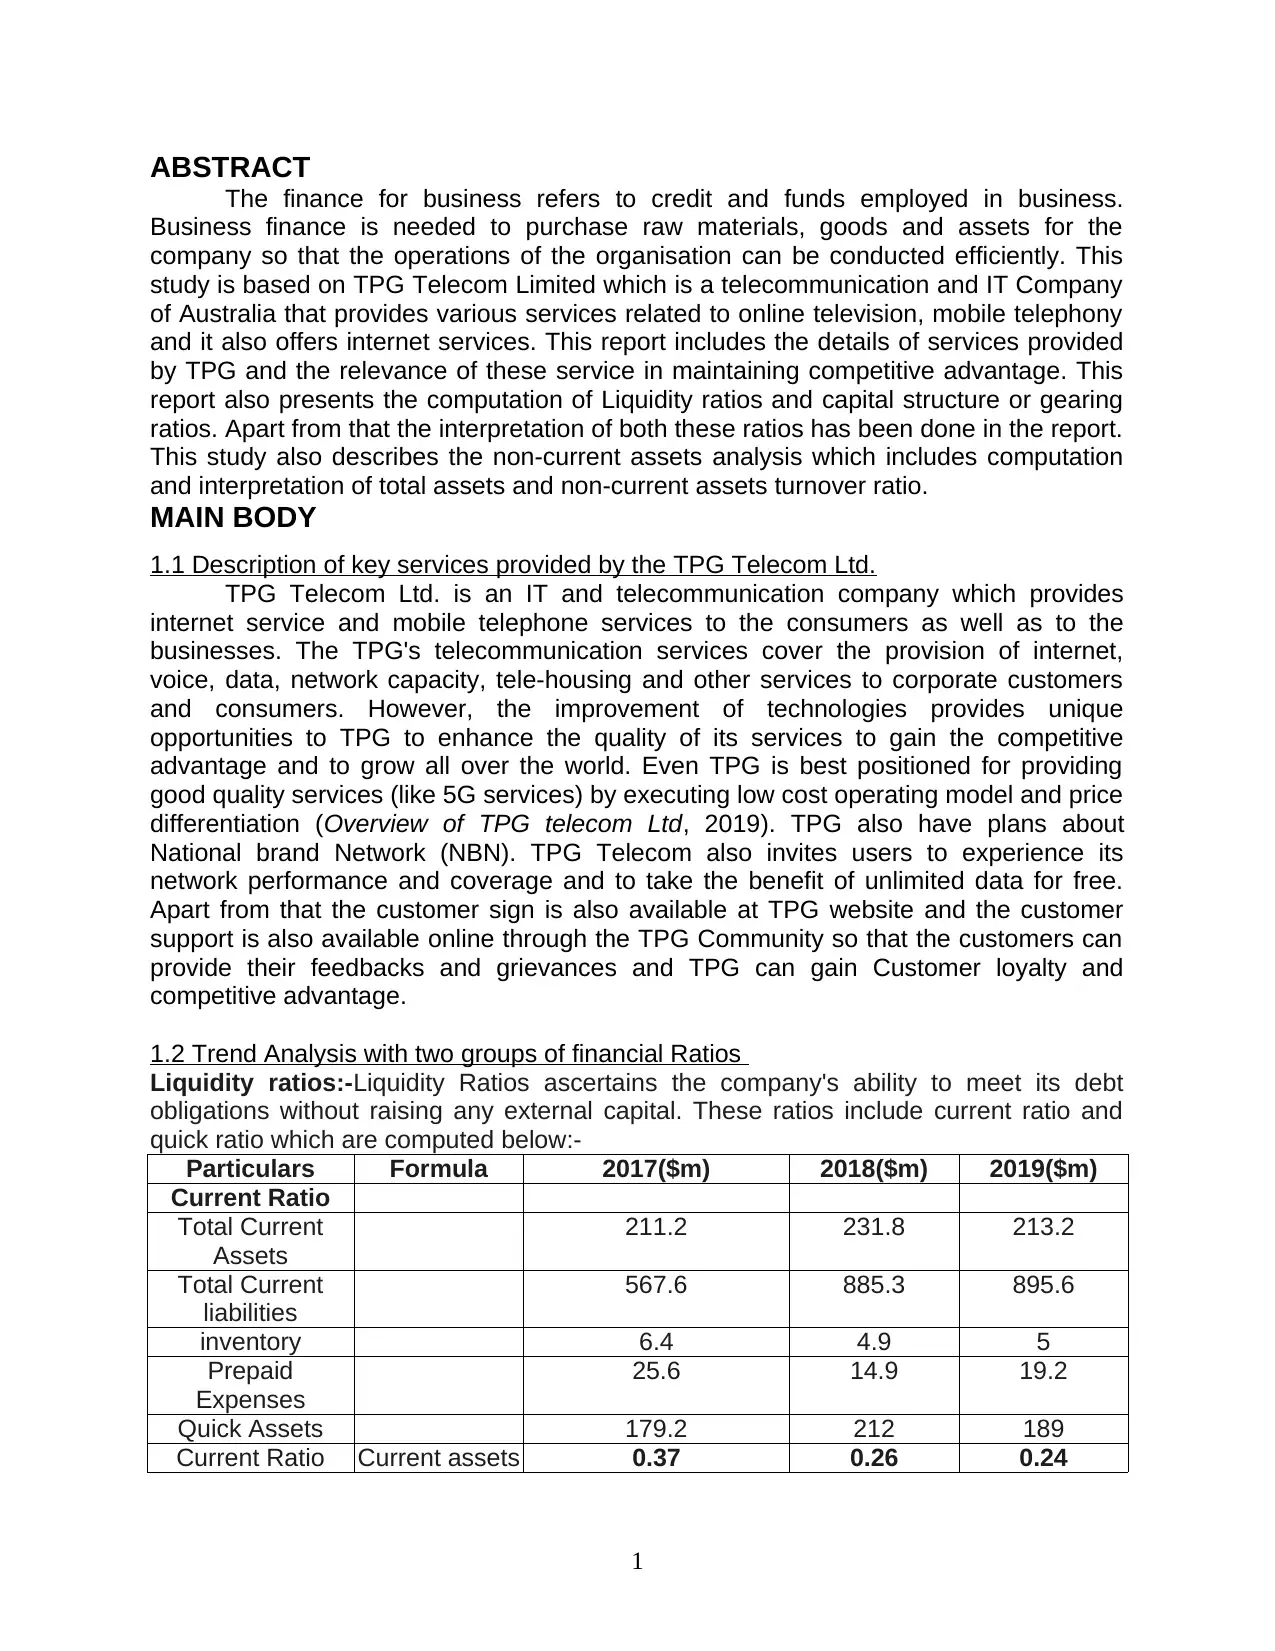
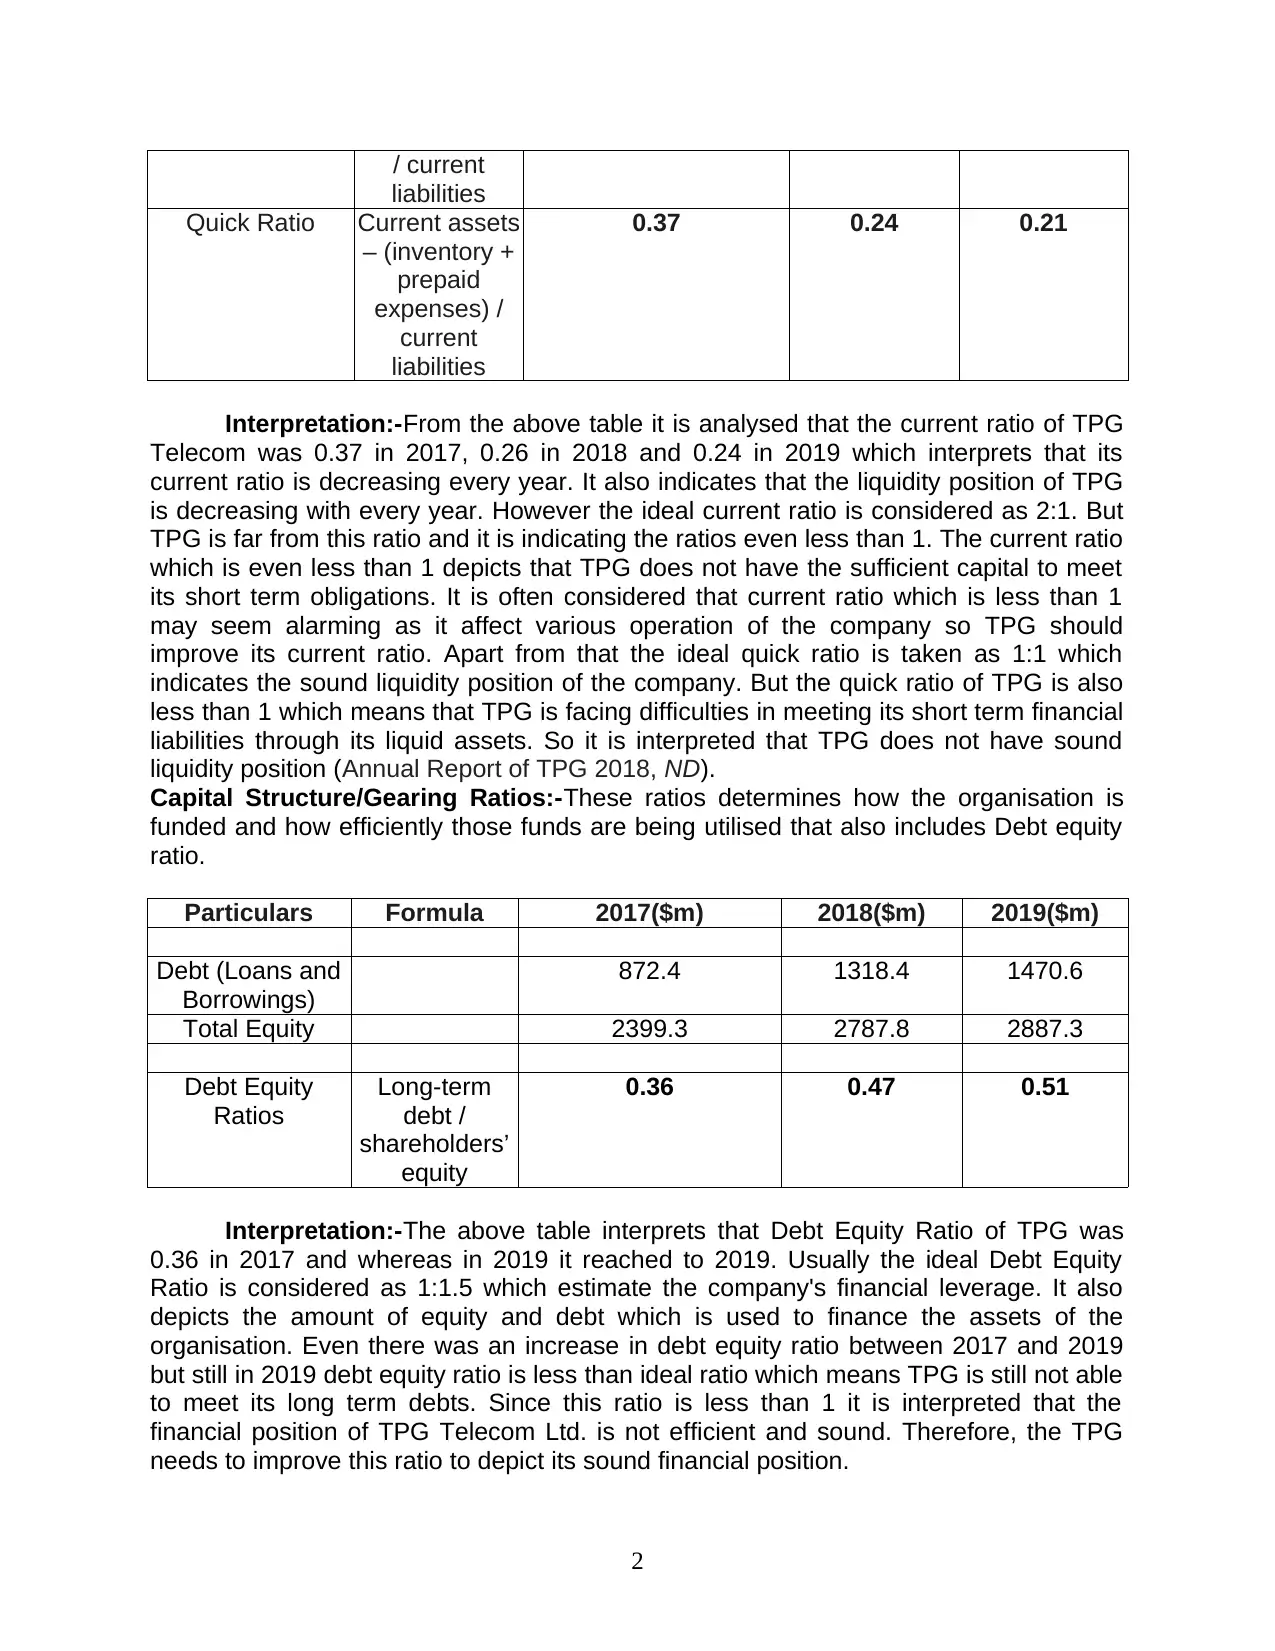
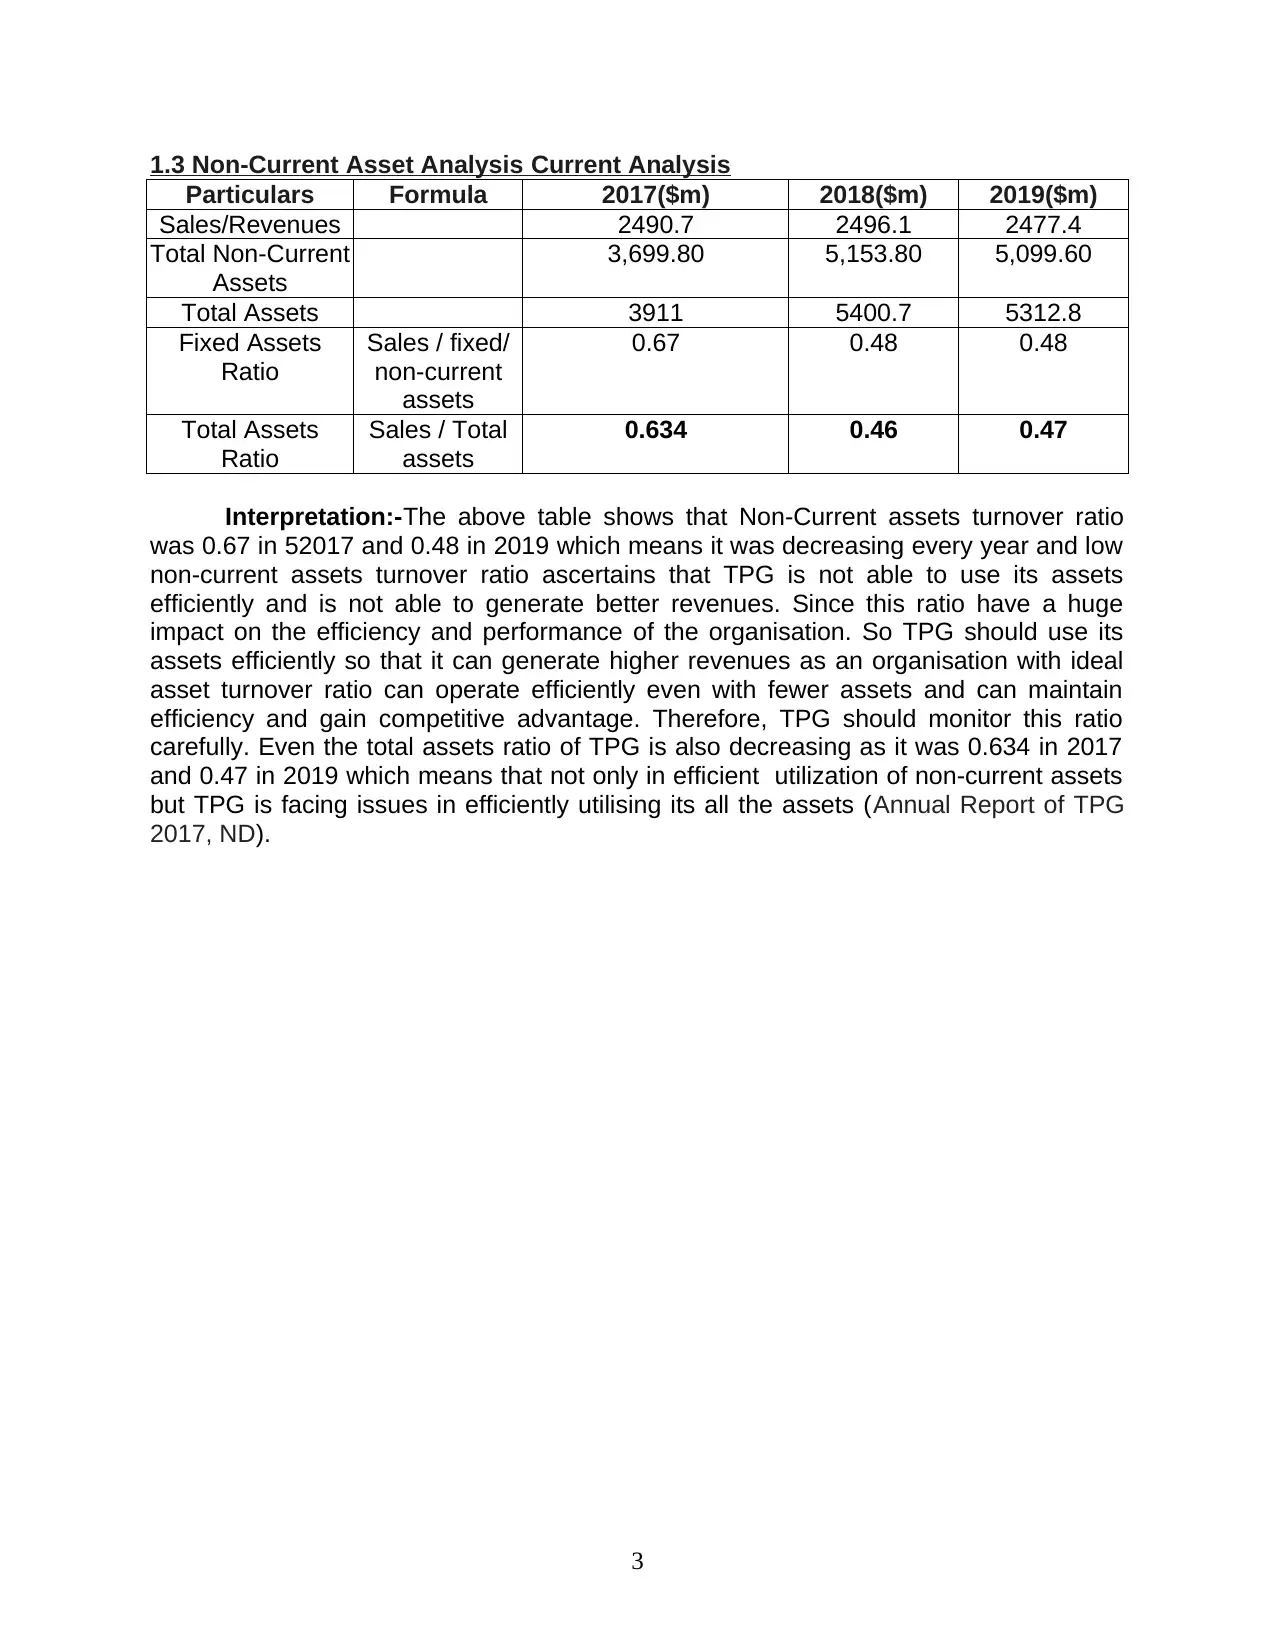
This report provides a financial analysis of TPG Telecom Ltd., an Australian telecommunications and IT company. It begins with an overview of TPG's key services, including internet, mobile telephony, and online television, and discusses their role in maintaining a competitive advantage. The report then delves into trend analysis using financial ratios, specifically liquidity ratios (current and quick ratios) and capital structure/gearing ratios (debt-equity ratio). The analysis reveals decreasing liquidity and debt-equity ratios. Furthermore, the study examines non-current asset analysis, including the total assets and non-current assets turnover ratio, highlighting inefficiencies in asset utilization. The report concludes with interpretations of the financial ratios and their implications for TPG Telecom's financial position and performance.
tabler-icon-diamond-filled.svg

Contribute Materials

Your contribution can guide someone’s learning journey. Share your documents today.
Document Page
FINANCE FOR
BUSINESS
tabler-icon-diamond-filled.svg

Secure Best Marks with AI Grader

Need help grading? Try our AI Grader for instant feedback on your assignments.
Document Page
Table of Contents
ABSTRACT.....................................................................................................................................1
1.1 Description of key services provided by the TPG Telecom Ltd............................................1
1.2 Trend Analysis with two groups of financial Ratios ............................................................1
1.3 Non-Current Asset Analysis Current Analysis......................................................................2
REFERENCES................................................................................................................................4
Document Page
ABSTRACT
The finance for business refers to credit and funds employed in business.
Business finance is needed to purchase raw materials, goods and assets for the
company so that the operations of the organisation can be conducted efficiently. This
study is based on TPG Telecom Limited which is a telecommunication and IT Company
of Australia that provides various services related to online television, mobile telephony
and it also offers internet services. This report includes the details of services provided
by TPG and the relevance of these service in maintaining competitive advantage. This
report also presents the computation of Liquidity ratios and capital structure or gearing
ratios. Apart from that the interpretation of both these ratios has been done in the report.
This study also describes the non-current assets analysis which includes computation
and interpretation of total assets and non-current assets turnover ratio.
MAIN BODY
1.1 Description of key services provided by the TPG Telecom Ltd.
TPG Telecom Ltd. is an IT and telecommunication company which provides
internet service and mobile telephone services to the consumers as well as to the
businesses. The TPG's telecommunication services cover the provision of internet,
voice, data, network capacity, tele-housing and other services to corporate customers
and consumers. However, the improvement of technologies provides unique
opportunities to TPG to enhance the quality of its services to gain the competitive
advantage and to grow all over the world. Even TPG is best positioned for providing
good quality services (like 5G services) by executing low cost operating model and price
differentiation (Overview of TPG telecom Ltd, 2019). TPG also have plans about
National brand Network (NBN). TPG Telecom also invites users to experience its
network performance and coverage and to take the benefit of unlimited data for free.
Apart from that the customer sign is also available at TPG website and the customer
support is also available online through the TPG Community so that the customers can
provide their feedbacks and grievances and TPG can gain Customer loyalty and
competitive advantage.
1.2 Trend Analysis with two groups of financial Ratios
Liquidity ratios:-Liquidity Ratios ascertains the company's ability to meet its debt
obligations without raising any external capital. These ratios include current ratio and
quick ratio which are computed below:-
Particulars Formula 2017($m) 2018($m) 2019($m)
Current Ratio
Total Current
Assets
211.2 231.8 213.2
Total Current
liabilities
567.6 885.3 895.6
inventory 6.4 4.9 5
Prepaid
Expenses
25.6 14.9 19.2
Quick Assets 179.2 212 189
Current Ratio Current assets 0.37 0.26 0.24
1
Document Page
/ current
liabilities
Quick Ratio Current assets
– (inventory +
prepaid
expenses) /
current
liabilities
0.37 0.24 0.21
Interpretation:-From the above table it is analysed that the current ratio of TPG
Telecom was 0.37 in 2017, 0.26 in 2018 and 0.24 in 2019 which interprets that its
current ratio is decreasing every year. It also indicates that the liquidity position of TPG
is decreasing with every year. However the ideal current ratio is considered as 2:1. But
TPG is far from this ratio and it is indicating the ratios even less than 1. The current ratio
which is even less than 1 depicts that TPG does not have the sufficient capital to meet
its short term obligations. It is often considered that current ratio which is less than 1
may seem alarming as it affect various operation of the company so TPG should
improve its current ratio. Apart from that the ideal quick ratio is taken as 1:1 which
indicates the sound liquidity position of the company. But the quick ratio of TPG is also
less than 1 which means that TPG is facing difficulties in meeting its short term financial
liabilities through its liquid assets. So it is interpreted that TPG does not have sound
liquidity position (Annual Report of TPG 2018, ND).
Capital Structure/Gearing Ratios:-These ratios determines how the organisation is
funded and how efficiently those funds are being utilised that also includes Debt equity
ratio.
Particulars Formula 2017($m) 2018($m) 2019($m)
Debt (Loans and
Borrowings)
872.4 1318.4 1470.6
Total Equity 2399.3 2787.8 2887.3
Debt Equity
Ratios
Long-term
debt /
shareholders’
equity
0.36 0.47 0.51
Interpretation:-The above table interprets that Debt Equity Ratio of TPG was
0.36 in 2017 and whereas in 2019 it reached to 2019. Usually the ideal Debt Equity
Ratio is considered as 1:1.5 which estimate the company's financial leverage. It also
depicts the amount of equity and debt which is used to finance the assets of the
organisation. Even there was an increase in debt equity ratio between 2017 and 2019
but still in 2019 debt equity ratio is less than ideal ratio which means TPG is still not able
to meet its long term debts. Since this ratio is less than 1 it is interpreted that the
financial position of TPG Telecom Ltd. is not efficient and sound. Therefore, the TPG
needs to improve this ratio to depict its sound financial position.
2
tabler-icon-diamond-filled.svg

Secure Best Marks with AI Grader

Need help grading? Try our AI Grader for instant feedback on your assignments.
Document Page
1.3 Non-Current Asset Analysis Current Analysis
Particulars Formula 2017($m) 2018($m) 2019($m)
Sales/Revenues 2490.7 2496.1 2477.4
Total Non-Current
Assets
3,699.80 5,153.80 5,099.60
Total Assets 3911 5400.7 5312.8
Fixed Assets
Ratio
Sales / fixed/
non-current
assets
0.67 0.48 0.48
Total Assets
Ratio
Sales / Total
assets
0.634 0.46 0.47
Interpretation:-The above table shows that Non-Current assets turnover ratio
was 0.67 in 52017 and 0.48 in 2019 which means it was decreasing every year and low
non-current assets turnover ratio ascertains that TPG is not able to use its assets
efficiently and is not able to generate better revenues. Since this ratio have a huge
impact on the efficiency and performance of the organisation. So TPG should use its
assets efficiently so that it can generate higher revenues as an organisation with ideal
asset turnover ratio can operate efficiently even with fewer assets and can maintain
efficiency and gain competitive advantage. Therefore, TPG should monitor this ratio
carefully. Even the total assets ratio of TPG is also decreasing as it was 0.634 in 2017
and 0.47 in 2019 which means that not only in efficient utilization of non-current assets
but TPG is facing issues in efficiently utilising its all the assets (Annual Report of TPG
2017, ND).
3
Document Page
REFERENCES
Online
Annual Report of TPG 2018. n.d. Online. Available Through:
<https://www.tpg.com.au/about/pdfs/TPM%20Group%20-%20Statutory
%20Accounts%20-%20FY18v16%20-%20Secure.pdf>
Annual Report of TPG 2017. n.d. Online. Available Through:
https://www.tpg.com.au/about/pdfs/FY17%20Annual%20Report.pdf
Overview of TPG telecom Ltd. 2019. Online. Available Through:
https://www.tpg.com.au/about/profile.php.
4
chevron_up_icon
1 out of 6
circle_padding
hide_on_mobile
zoom_out_icon
logo.png

Your All-in-One AI-Powered Toolkit for Academic Success.

Available 24*7 on WhatsApp / Email

[object Object]