Financial Analysis Report on TPG Telecom Ltd - Finance for Business
VerifiedAdded on 2021/05/30
|19
|3927
|80
Report
AI Summary
This finance report provides a comprehensive analysis of TPG Telecom Ltd, an Australian telecommunications company. The report examines the company's ownership and governance structure, including substantial shareholders and board members. It calculates and interprets key financial ratios such as liquidity, leverage, efficiency, profitability, and market value ratios to assess the company's financial health. The report includes graphical representations of share price movements, comparing them to the All Ordinaries Index, and identifies significant announcements that have influenced share prices. It also calculates beta and the required rate of return using the CAPM model, and determines the weighted average cost of capital (WACC). The report justifies a conservative investment approach, based on the company's earnings and revenue growth. Finally, it offers recommendations regarding investment prospects in TPG Telecom Ltd. and includes a letter of recommendations.
Running head: FINANCE FOR BUSINESS
Finance for Business
Name of the Student
Name of the University
Authors Note
Course ID
Finance for Business
Name of the Student
Name of the University
Authors Note
Course ID
Paraphrase This Document
Need a fresh take? Get an instant paraphrase of this document with our AI Paraphraser
1
Table of Contents
Introduction:...............................................................................................................................3
Description of the Company:.....................................................................................................3
Ownership and Governance Structure:......................................................................................4
Substantial Shareholders:.......................................................................................................4
People involved in the governance of TPG Telecom Ltd Board:..........................................5
Calculations of the Fundamental Ratios:...................................................................................6
Liquid Ratios:.........................................................................................................................6
Financial Leverage Ratios......................................................................................................7
Efficiency Ratios....................................................................................................................7
Profitability Ratios:................................................................................................................7
Market Value Ratios..............................................................................................................8
Graphical representation of movement in Share Price:..............................................................8
Movement in TPG Telecom Ltd Share Price Index to All Orders Index:.............................8
Significant Announcement that Influences Share price of TPG Telecom Ltd:.....................9
Calculation of Beta and Required Rate of Return under CAPM:............................................10
Beta Calculated of TPG Telecom Ltd:.................................................................................10
Calculations of Required rate of Return:.............................................................................11
Justification behind the “Conservative Investment”............................................................11
Calculations of Weighted Average of Cost of Capital:............................................................12
Implications of Higher WACC on Management’s evaluation:............................................12
2
Debt ratio:.................................................................................................................................13
Dividend policy:.......................................................................................................................13
Letter of Recommendations.....................................................................................................14
Conclusion:..............................................................................................................................14
References................................................................................................................................16
⊘ This is a preview!⊘
Do you want full access?
Subscribe today to unlock all pages.
Trusted by 1+ million students worldwide
3
Introduction:
The report will be providing the services relating to financial advisory. For the current
report TPG Telecom Ltd been selected. The report will be investing as well as analysing the
current financial situations of the TPG Telecom Ltd as the means of providing advice to the
clients. The report will be placing focus on the financial statements of TPG Telecom Ltd to
better understand the structure of corporate governance and the ownership structure of the
TPG Telecom Ltd. Additionally ratios based on profitability, financial leverage, market value
and efficiency will be computed to understand the viability of making investment in TPG
Telecom Ltd.
A graphical representation of the shares prices will be carried out and the same will be
compared against the all ordinary index to understand the movement in the share prices over
the years. Emphasis would be paid towards the debt structure of the TPG Telecom Ltd along
with the dividend policies of the company. finally the report would be providing a letter of
recommendations containing appropriate recommendations regarding the investment prospect
in TPG Telecom Ltd.
Description of the Company:
TPG Telecom Ltd is regarded as the Australian telecommunication and company that
specializes in information technology services. The company also provides its customer with
services related to mobile phone as well as internet services. TPG Telecom Ltd is regarded as
the second largest internet service provider with largest provider of virtual mobile network
operator in Australia (Tpg.com.au 2018). TPG Telecom Ltd has more 671,000 subscribers of
ADLS2+ along with 358,000 subscribers in land line. It also has mobile subscribers that
stands more than 360,000 customers and is the second largest owner of ADSL2+ network in
Australia.
Paraphrase This Document
Need a fresh take? Get an instant paraphrase of this document with our AI Paraphraser
4
Considering the history of the company TPG Telecom Ltd was formed through
merger between the total peripherals group that was established by David and Vicky Teoh
back in 1986 and SP Telemedia in 2008. The total peripherals groups was established during
the year 1986 by the Malaysian born Australian businessman named David Teoh in the form
of IT company that sold OEM computers and then moved towards mobile and internet
services (Tpg.com.au 2018). The company undertook almost 70 per cent of the controlling
interest of Adelaide internet provider and later rapidly took over SP Telemedia to bring TPG
underneath single banner.
TPG Telecom Ltd generally markets five types of product and services that includes
the internet service, services related to OEM, networking, services related to mobile phone
and accounting software services.
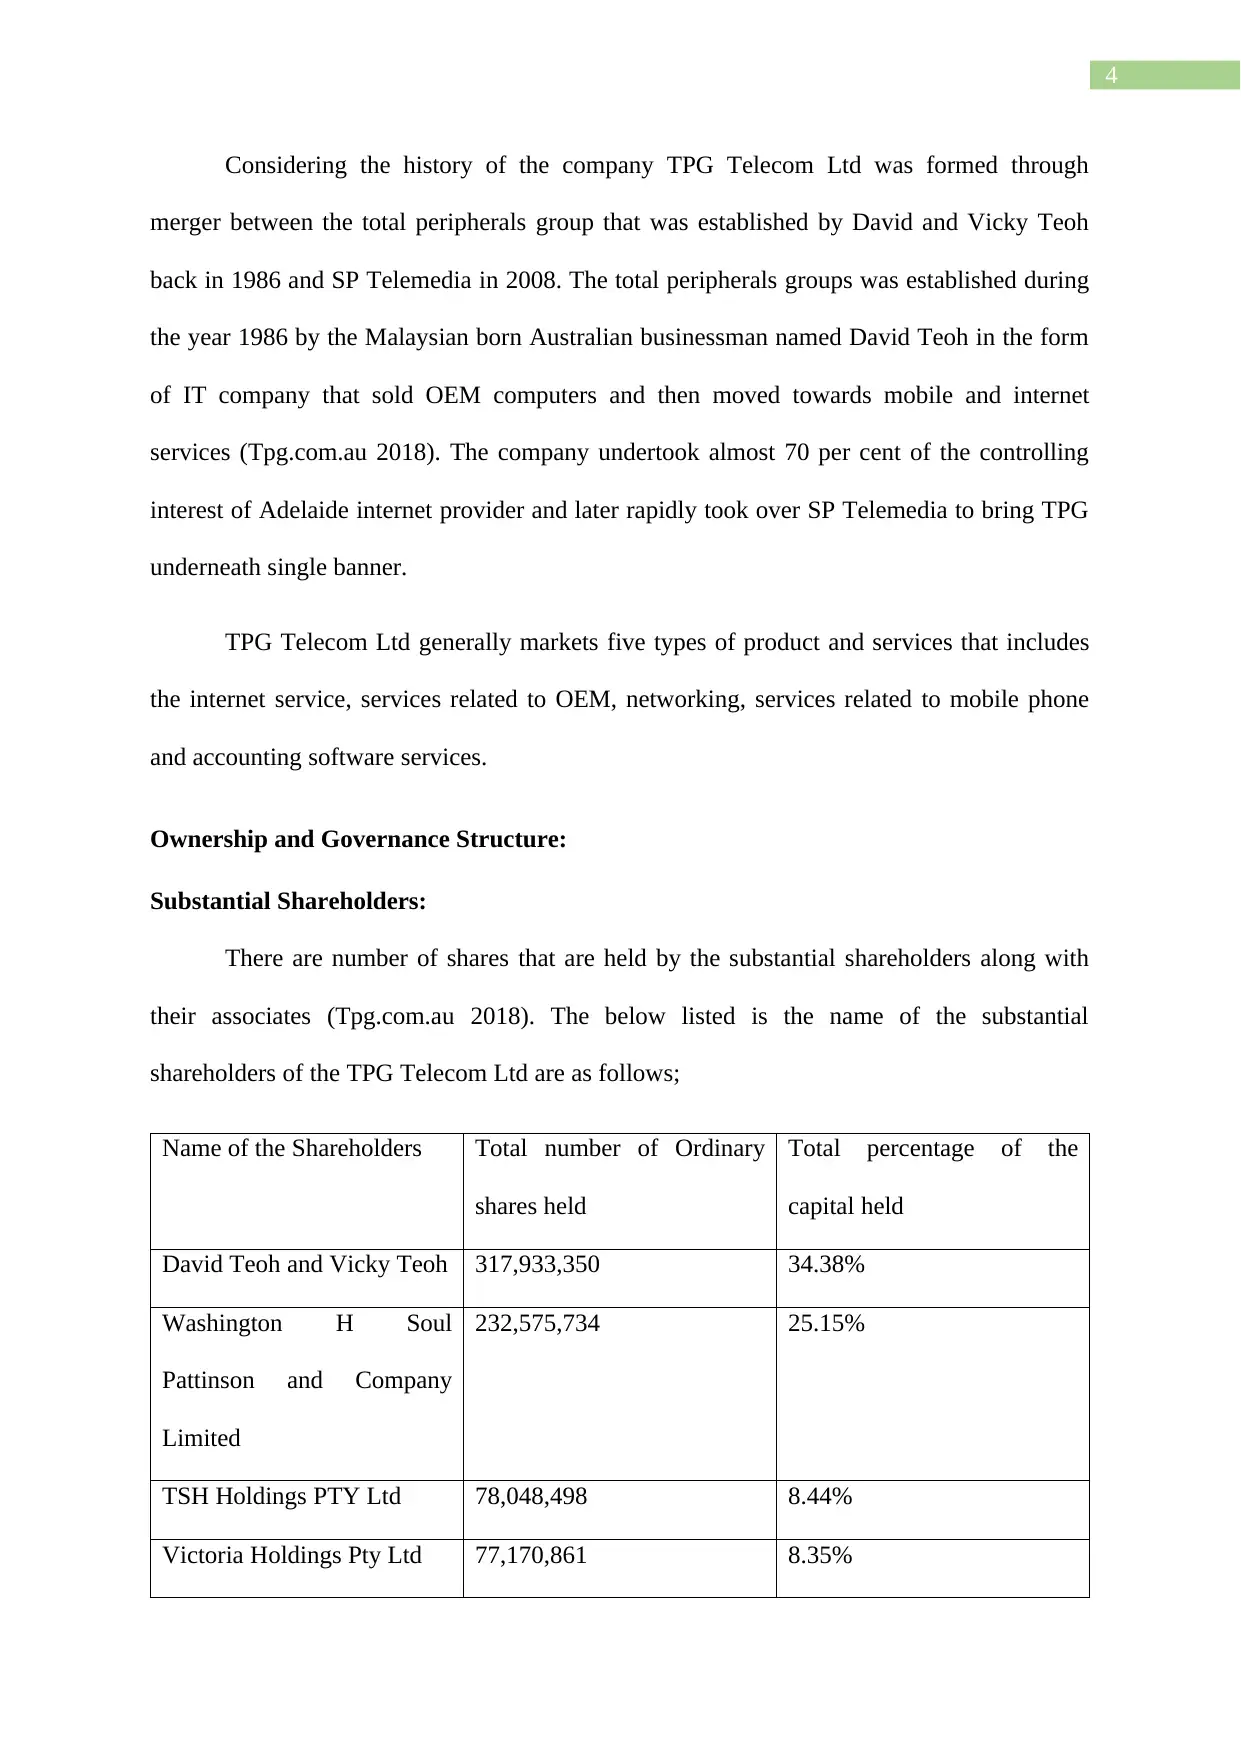
Ownership and Governance Structure:
Substantial Shareholders:
There are number of shares that are held by the substantial shareholders along with
their associates (Tpg.com.au 2018). The below listed is the name of the substantial
shareholders of the TPG Telecom Ltd are as follows;
Name of the Shareholders Total number of Ordinary
shares held
Total percentage of the
capital held
David Teoh and Vicky Teoh 317,933,350 34.38%
Washington H Soul
Pattinson and Company
Limited
232,575,734 25.15%
TSH Holdings PTY Ltd 78,048,498 8.44%
Victoria Holdings Pty Ltd 77,170,861 8.35%
Considering the history of the company TPG Telecom Ltd was formed through
merger between the total peripherals group that was established by David and Vicky Teoh
back in 1986 and SP Telemedia in 2008. The total peripherals groups was established during
the year 1986 by the Malaysian born Australian businessman named David Teoh in the form
of IT company that sold OEM computers and then moved towards mobile and internet
services (Tpg.com.au 2018). The company undertook almost 70 per cent of the controlling
interest of Adelaide internet provider and later rapidly took over SP Telemedia to bring TPG
underneath single banner.
TPG Telecom Ltd generally markets five types of product and services that includes
the internet service, services related to OEM, networking, services related to mobile phone
and accounting software services.
Ownership and Governance Structure:
Substantial Shareholders:
There are number of shares that are held by the substantial shareholders along with
their associates (Tpg.com.au 2018). The below listed is the name of the substantial
shareholders of the TPG Telecom Ltd are as follows;
Name of the Shareholders Total number of Ordinary
shares held
Total percentage of the
capital held
David Teoh and Vicky Teoh 317,933,350 34.38%
Washington H Soul
Pattinson and Company
Limited
232,575,734 25.15%
TSH Holdings PTY Ltd 78,048,498 8.44%
Victoria Holdings Pty Ltd 77,170,861 8.35%
5
HSBC Custody Nominees
(Australia Ltd)
66,398,784 7.18
David Teoh 47,476,499 5.13%
Vicky Teoh 47,100,369 5.09
The tabular representation provides that there are two substantial shareholders that
holds greater than 20% of the shareholdings for TPG Telecom Ltd. This included a combined
shareholdings of David and Vicky Toeh of 34.38% while the Washington H Soul Pattinson
and Company Limited held 25.15% of the total share capital (Tpg.com.au 2018). On the other
hand there were five shareholders that held 5% or more of the share capital for TPG Telecom
Ltd with TSH Holding and Victoria Holdings Pty Ltd each held 8.44% and 8.35% of shares
respectively. On the basis of classification of the shareholdings, TPG Telecom Ltd can be
considered as the family company this is because a combined 34.38% of the shares are held
by David and Vicky Teoh.
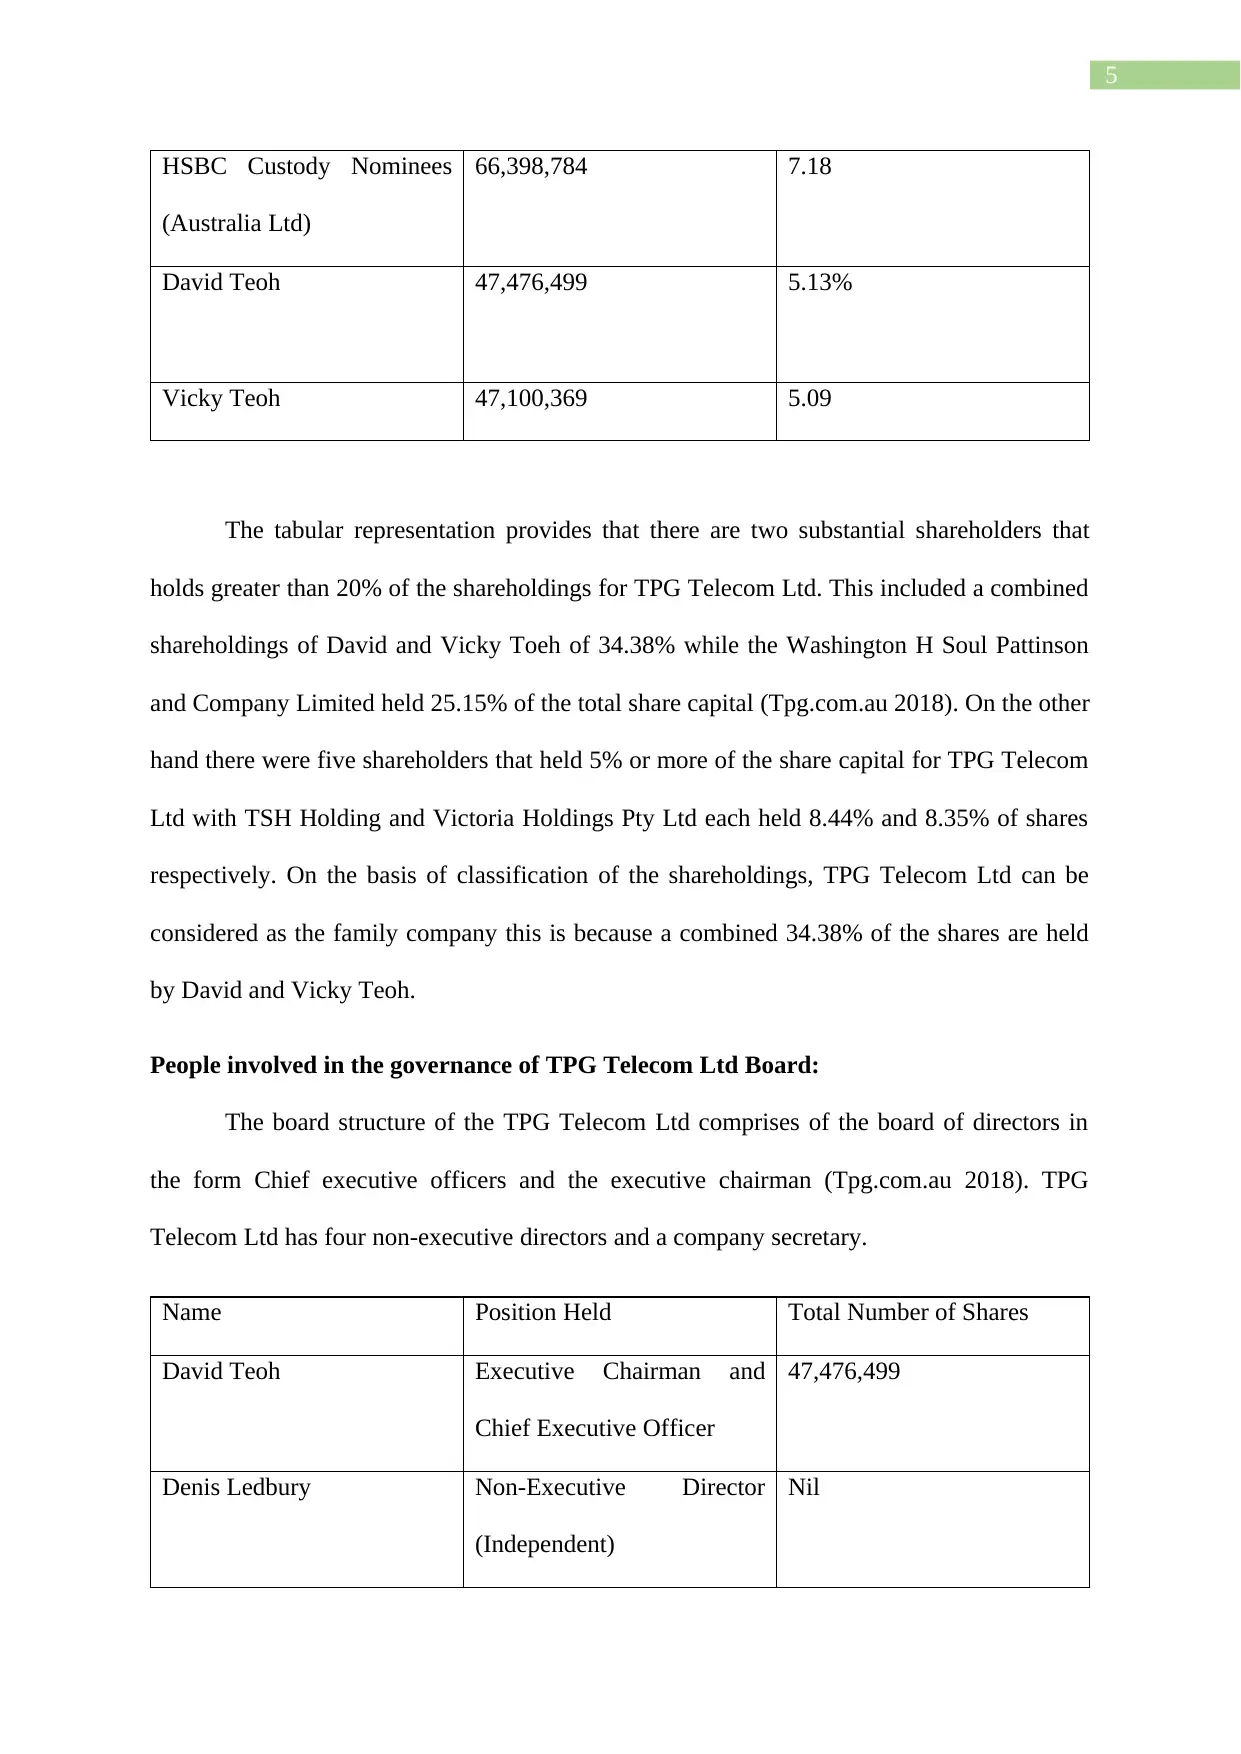
People involved in the governance of TPG Telecom Ltd Board:
The board structure of the TPG Telecom Ltd comprises of the board of directors in
the form Chief executive officers and the executive chairman (Tpg.com.au 2018). TPG
Telecom Ltd has four non-executive directors and a company secretary.
Name Position Held Total Number of Shares
David Teoh Executive Chairman and
Chief Executive Officer
47,476,499
Denis Ledbury Non-Executive Director
(Independent)
Nil
HSBC Custody Nominees
(Australia Ltd)
66,398,784 7.18
David Teoh 47,476,499 5.13%
Vicky Teoh 47,100,369 5.09
The tabular representation provides that there are two substantial shareholders that
holds greater than 20% of the shareholdings for TPG Telecom Ltd. This included a combined
shareholdings of David and Vicky Toeh of 34.38% while the Washington H Soul Pattinson
and Company Limited held 25.15% of the total share capital (Tpg.com.au 2018). On the other
hand there were five shareholders that held 5% or more of the share capital for TPG Telecom
Ltd with TSH Holding and Victoria Holdings Pty Ltd each held 8.44% and 8.35% of shares
respectively. On the basis of classification of the shareholdings, TPG Telecom Ltd can be
considered as the family company this is because a combined 34.38% of the shares are held
by David and Vicky Teoh.
People involved in the governance of TPG Telecom Ltd Board:
The board structure of the TPG Telecom Ltd comprises of the board of directors in
the form Chief executive officers and the executive chairman (Tpg.com.au 2018). TPG
Telecom Ltd has four non-executive directors and a company secretary.
Name Position Held Total Number of Shares
David Teoh Executive Chairman and
Chief Executive Officer
47,476,499
Denis Ledbury Non-Executive Director
(Independent)
Nil
⊘ This is a preview!⊘
Do you want full access?
Subscribe today to unlock all pages.
Trusted by 1+ million students worldwide
6
Robert Milner Non-Executive Director Nil
Joseph Pang Non-Executive Director
(Independent)
Nil
Shane Teoh Non-Executive Director
Mr Stephan Banfield Company Secretary
The tabular representation provides the governance structure of TPG Telecom Ltd.
While the above listed people that are involved in the corporate governance of the company
involves David Teoh that holds 5% of the share capital (Tpg.com.au 2018). While the rest of
the directors does not have shareholdings and there are no such people in the firm governance
that holds more than 20% of the share capital. An argument can be bought forward by stating
that TPG Telecom Ltd cannot be classified as the company that has family members involved
in the corporate governance of the firm.
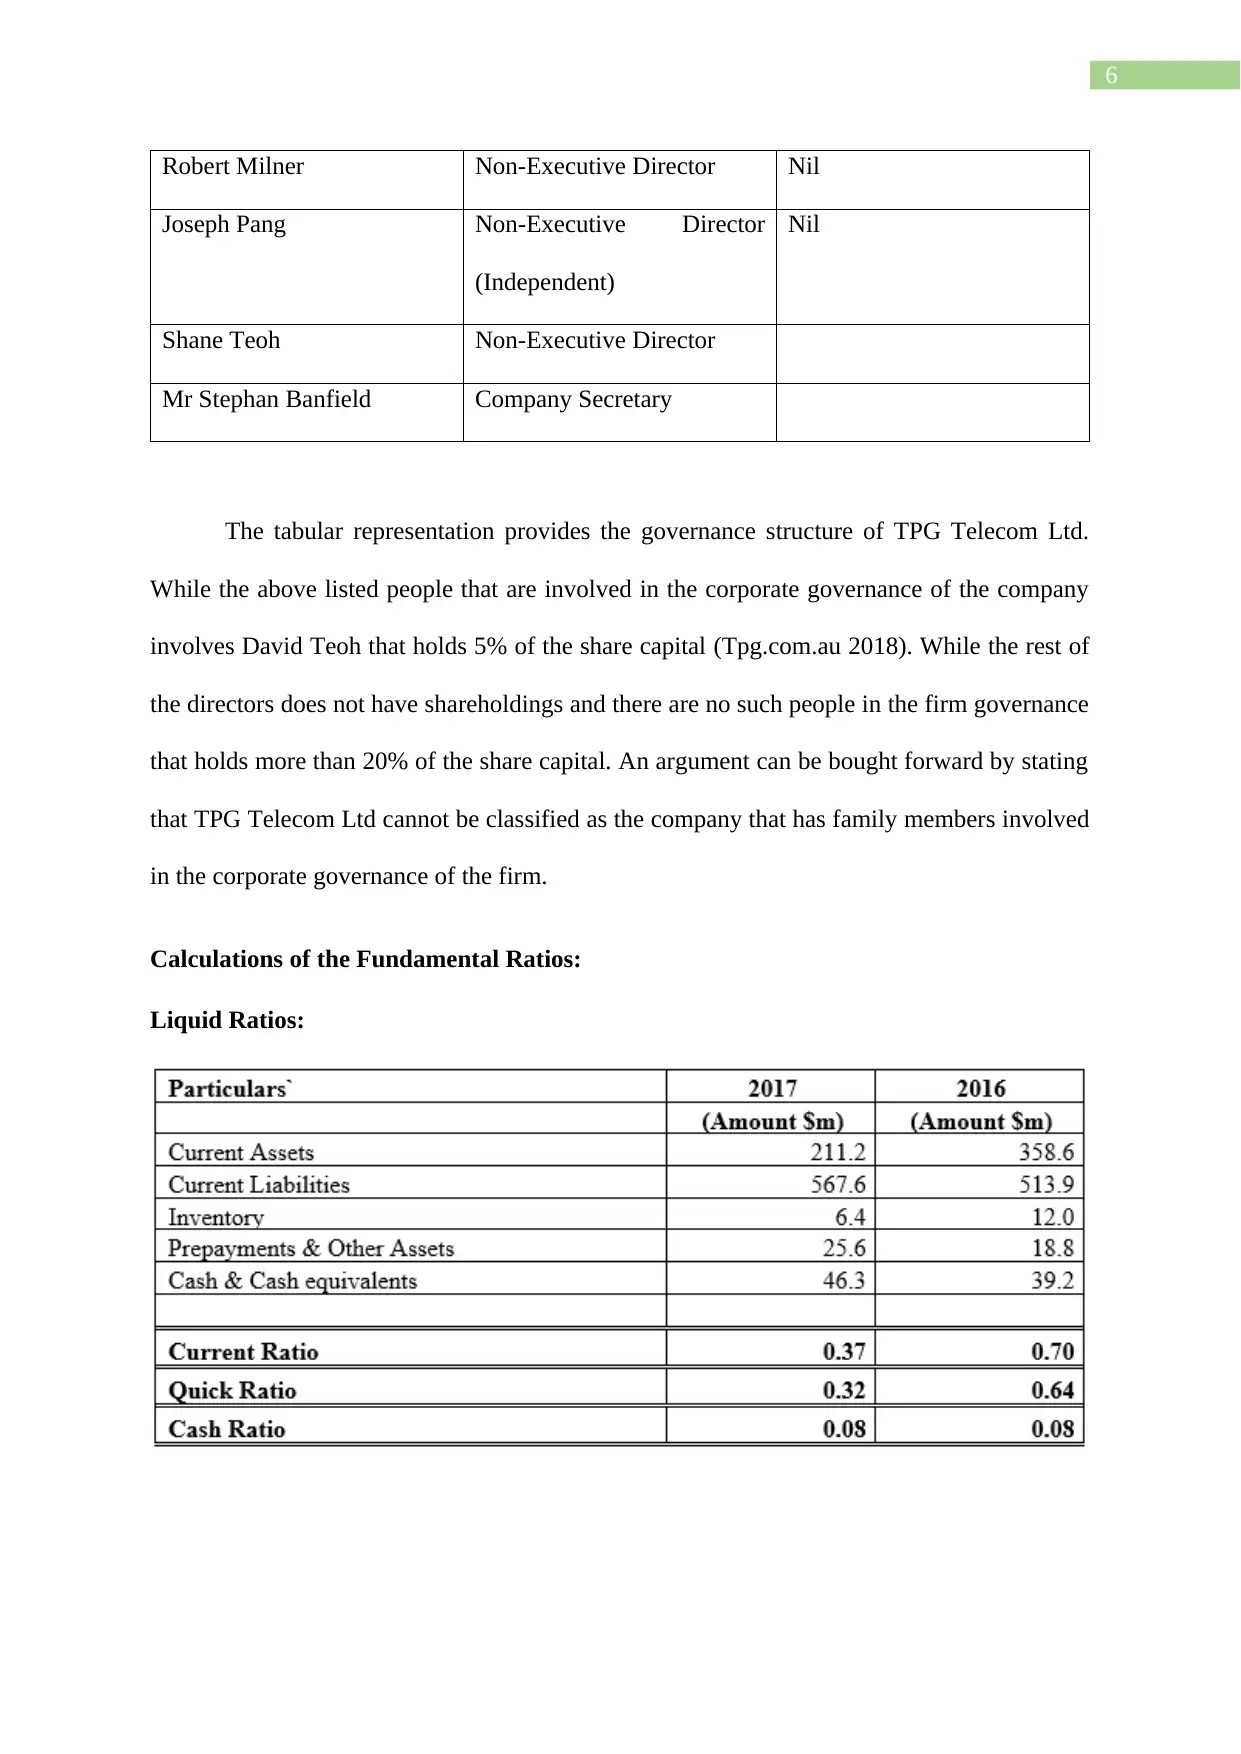
Calculations of the Fundamental Ratios:
Liquid Ratios:
Robert Milner Non-Executive Director Nil
Joseph Pang Non-Executive Director
(Independent)
Nil
Shane Teoh Non-Executive Director
Mr Stephan Banfield Company Secretary
The tabular representation provides the governance structure of TPG Telecom Ltd.
While the above listed people that are involved in the corporate governance of the company
involves David Teoh that holds 5% of the share capital (Tpg.com.au 2018). While the rest of
the directors does not have shareholdings and there are no such people in the firm governance
that holds more than 20% of the share capital. An argument can be bought forward by stating
that TPG Telecom Ltd cannot be classified as the company that has family members involved
in the corporate governance of the firm.
Calculations of the Fundamental Ratios:
Liquid Ratios:
Paraphrase This Document
Need a fresh take? Get an instant paraphrase of this document with our AI Paraphraser
7
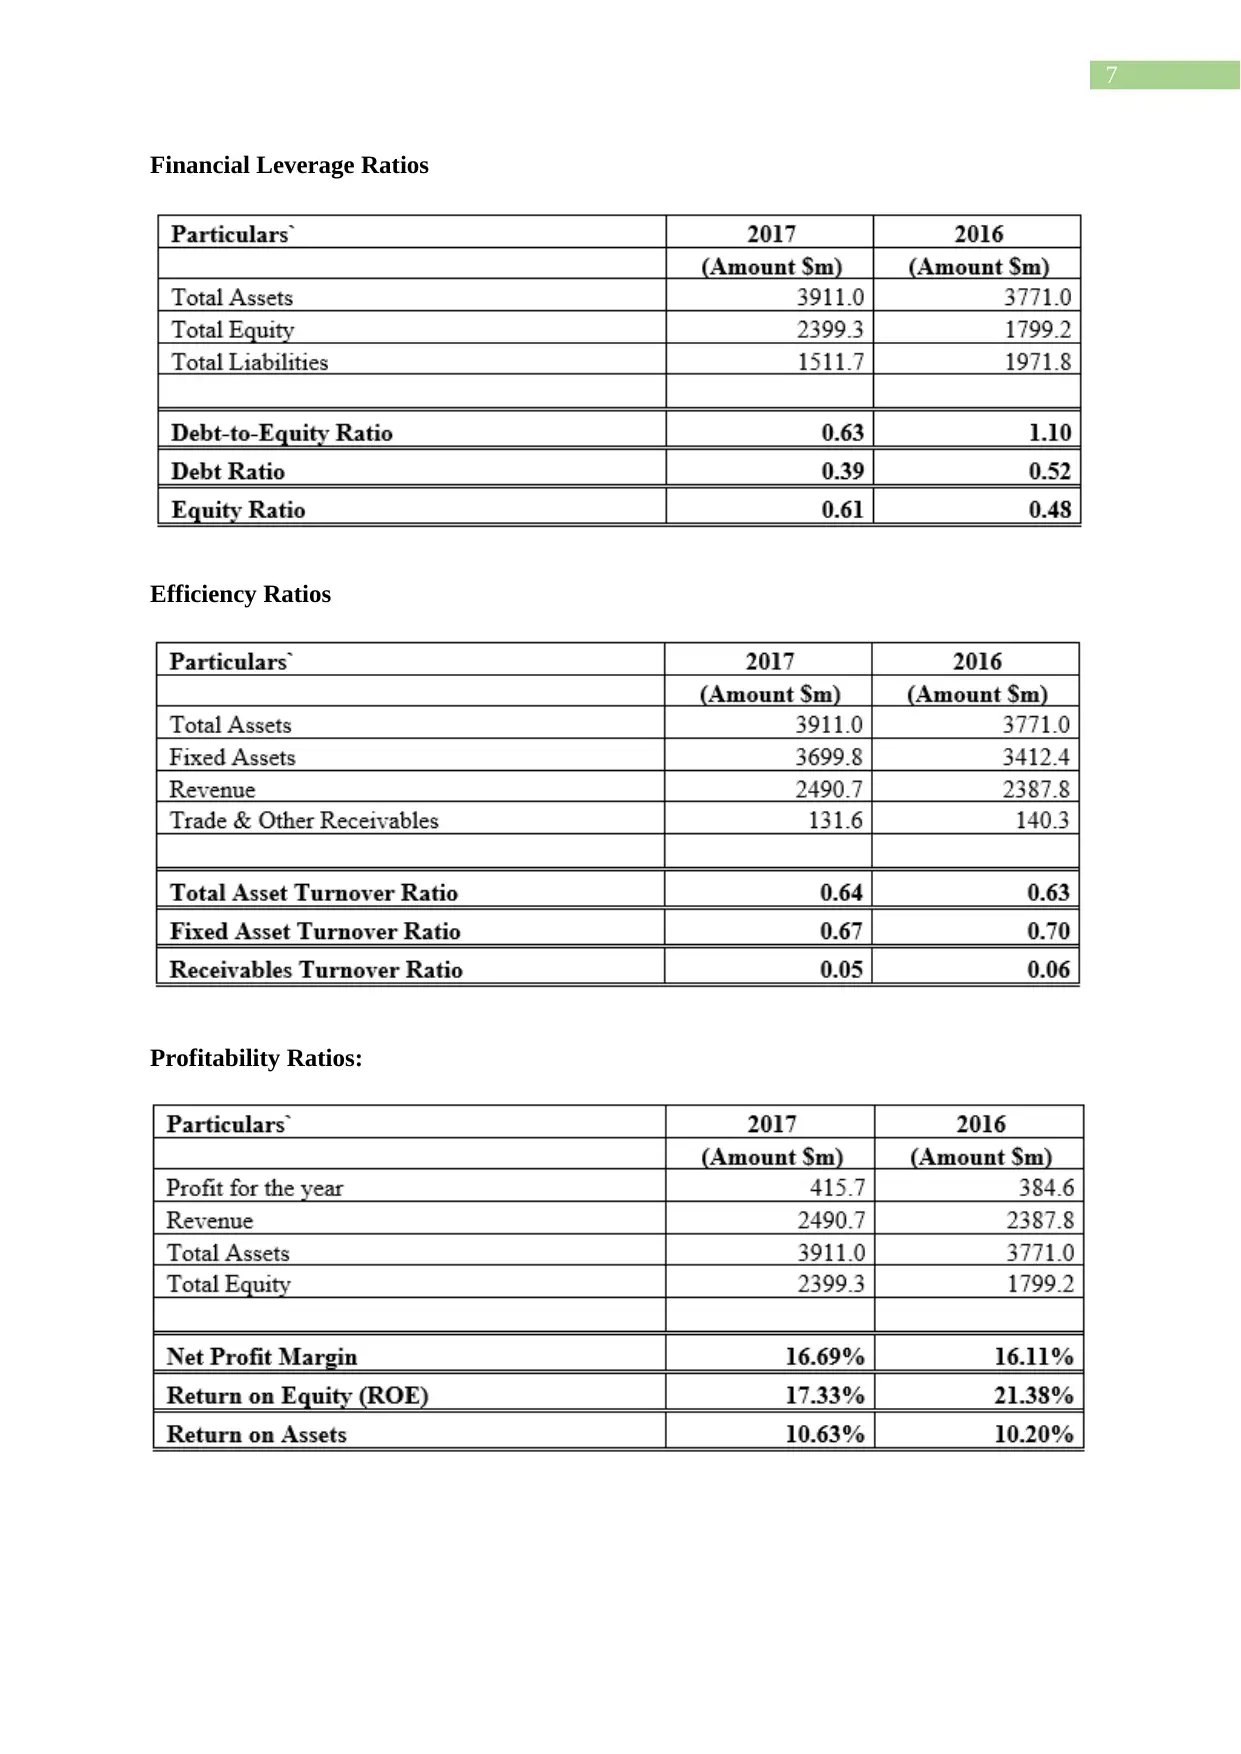
Financial Leverage Ratios
Efficiency Ratios
Profitability Ratios:
Financial Leverage Ratios
Efficiency Ratios
Profitability Ratios:
8
Market Value Ratios
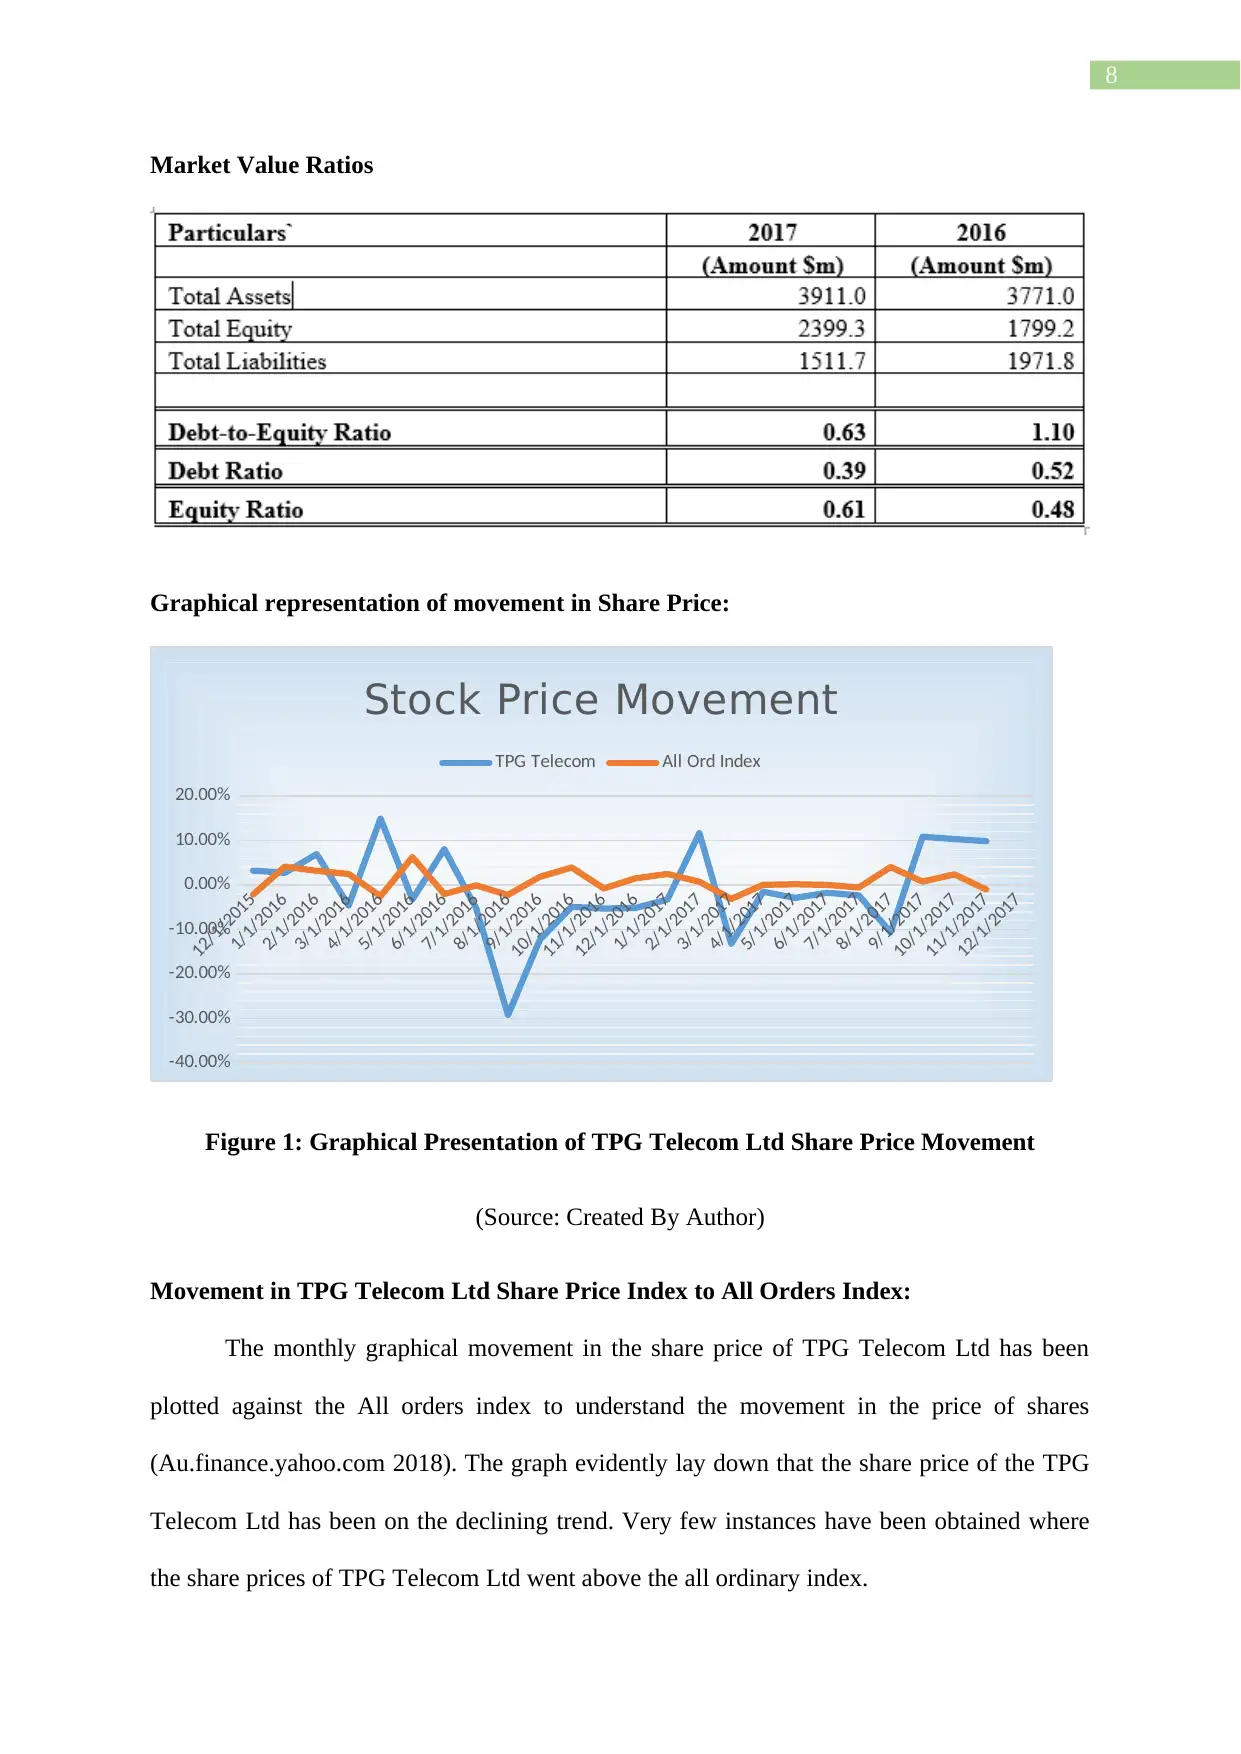
Graphical representation of movement in Share Price:
12/1/2015
1/1/2016
2/1/2016
3/1/2016
4/1/2016
5/1/2016
6/1/2016
7/1/2016
8/1/2016
9/1/2016
10/1/2016
11/1/2016
12/1/2016
1/1/2017
2/1/2017
3/1/2017
4/1/2017
5/1/2017
6/1/2017
7/1/2017
8/1/2017
9/1/2017
10/1/2017
11/1/2017
12/1/2017
-40.00%
-30.00%
-20.00%
-10.00%
0.00%
10.00%
20.00%
Stock Price Movement
TPG Telecom All Ord Index
Figure 1: Graphical Presentation of TPG Telecom Ltd Share Price Movement
(Source: Created By Author)
Movement in TPG Telecom Ltd Share Price Index to All Orders Index:
The monthly graphical movement in the share price of TPG Telecom Ltd has been
plotted against the All orders index to understand the movement in the price of shares
(Au.finance.yahoo.com 2018). The graph evidently lay down that the share price of the TPG
Telecom Ltd has been on the declining trend. Very few instances have been obtained where
the share prices of TPG Telecom Ltd went above the all ordinary index.
Market Value Ratios
Graphical representation of movement in Share Price:
12/1/2015
1/1/2016
2/1/2016
3/1/2016
4/1/2016
5/1/2016
6/1/2016
7/1/2016
8/1/2016
9/1/2016
10/1/2016
11/1/2016
12/1/2016
1/1/2017
2/1/2017
3/1/2017
4/1/2017
5/1/2017
6/1/2017
7/1/2017
8/1/2017
9/1/2017
10/1/2017
11/1/2017
12/1/2017
-40.00%
-30.00%
-20.00%
-10.00%
0.00%
10.00%
20.00%
Stock Price Movement
TPG Telecom All Ord Index
Figure 1: Graphical Presentation of TPG Telecom Ltd Share Price Movement
(Source: Created By Author)
Movement in TPG Telecom Ltd Share Price Index to All Orders Index:
The monthly graphical movement in the share price of TPG Telecom Ltd has been
plotted against the All orders index to understand the movement in the price of shares
(Au.finance.yahoo.com 2018). The graph evidently lay down that the share price of the TPG
Telecom Ltd has been on the declining trend. Very few instances have been obtained where
the share prices of TPG Telecom Ltd went above the all ordinary index.
⊘ This is a preview!⊘
Do you want full access?
Subscribe today to unlock all pages.
Trusted by 1+ million students worldwide
9
The graphical representation of the share price of TPG Telecom Ltd shows that in the
month of March 2016 the share price to stand at 6.96% against the all ordinary index of
3.19% (Au.finance.yahoo.com 2018). However in the following month of April the share
price represented a sharp declined as the share price stood negatively at -4.64% against the all
ordinary index of 2.48% (Finance.yahoo.com 2018). In the preceding month of May the share
price took a sharp turn and increased positively to stand at14.95%.
12/1/2015
1/1/2016
2/1/2016
3/1/2016
4/1/2016
5/1/2016
6/1/2016
7/1/2016
8/1/2016
9/1/2016
10/1/2016
11/1/2016
12/1/2016
1/1/2017
2/1/2017
3/1/2017
4/1/2017
5/1/2017
6/1/2017
7/1/2017
8/1/2017
9/1/2017
10/1/2017
11/1/2017
12/1/2017
0.00
2.00
4.00
6.00
8.00
10.00
12.00
14.00
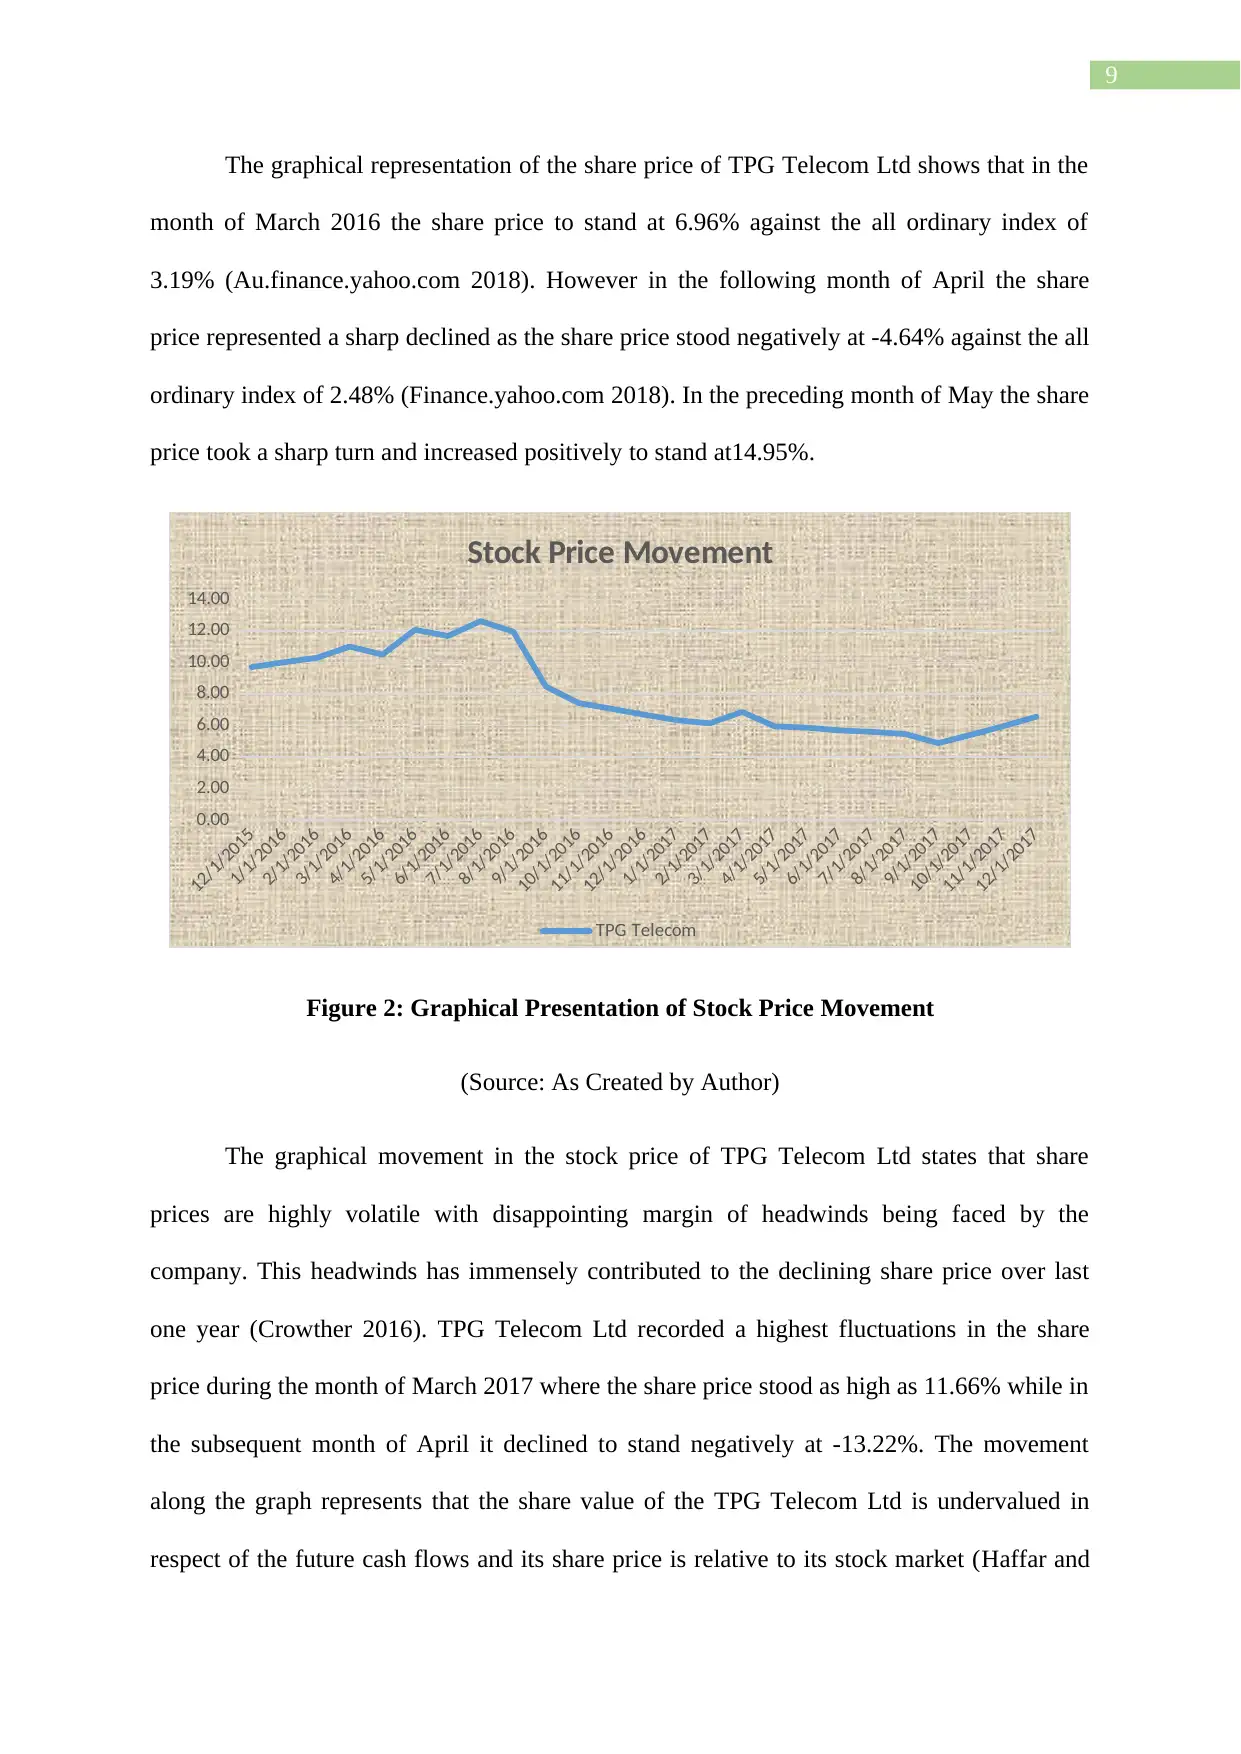
Stock Price Movement
TPG Telecom
Figure 2: Graphical Presentation of Stock Price Movement
(Source: As Created by Author)
The graphical movement in the stock price of TPG Telecom Ltd states that share
prices are highly volatile with disappointing margin of headwinds being faced by the
company. This headwinds has immensely contributed to the declining share price over last
one year (Crowther 2016). TPG Telecom Ltd recorded a highest fluctuations in the share
price during the month of March 2017 where the share price stood as high as 11.66% while in
the subsequent month of April it declined to stand negatively at -13.22%. The movement
along the graph represents that the share value of the TPG Telecom Ltd is undervalued in
respect of the future cash flows and its share price is relative to its stock market (Haffar and
The graphical representation of the share price of TPG Telecom Ltd shows that in the
month of March 2016 the share price to stand at 6.96% against the all ordinary index of
3.19% (Au.finance.yahoo.com 2018). However in the following month of April the share
price represented a sharp declined as the share price stood negatively at -4.64% against the all
ordinary index of 2.48% (Finance.yahoo.com 2018). In the preceding month of May the share
price took a sharp turn and increased positively to stand at14.95%.
12/1/2015
1/1/2016
2/1/2016
3/1/2016
4/1/2016
5/1/2016
6/1/2016
7/1/2016
8/1/2016
9/1/2016
10/1/2016
11/1/2016
12/1/2016
1/1/2017
2/1/2017
3/1/2017
4/1/2017
5/1/2017
6/1/2017
7/1/2017
8/1/2017
9/1/2017
10/1/2017
11/1/2017
12/1/2017
0.00
2.00
4.00
6.00
8.00
10.00
12.00
14.00
Stock Price Movement
TPG Telecom
Figure 2: Graphical Presentation of Stock Price Movement
(Source: As Created by Author)
The graphical movement in the stock price of TPG Telecom Ltd states that share
prices are highly volatile with disappointing margin of headwinds being faced by the
company. This headwinds has immensely contributed to the declining share price over last
one year (Crowther 2016). TPG Telecom Ltd recorded a highest fluctuations in the share
price during the month of March 2017 where the share price stood as high as 11.66% while in
the subsequent month of April it declined to stand negatively at -13.22%. The movement
along the graph represents that the share value of the TPG Telecom Ltd is undervalued in
respect of the future cash flows and its share price is relative to its stock market (Haffar and
Paraphrase This Document
Need a fresh take? Get an instant paraphrase of this document with our AI Paraphraser
10
Searcy 2018). However with the recent upward rising trend in the share price of the TPG
Telecom Ltd it can be stated that the present share price of the company is over the future
cash flow value.
Significant Announcement that Influences Share price of TPG Telecom Ltd:
TPG Telecom Ltd which is one of the telecom company having based in Australia
witnessed a decent growth at the teen level in the ASX over the last few months (Eccles and
Serafeim 2014). In spite of gaining the company witnessed a decline in its share prices over
the last year. An important factor that contributed to the declined in the share prices of the
TPG Telecom Ltd is the “changes in the management earnings forecast”. The
management of the company held the non-current investment of the group’s ownerships in
the Covota Ltd. The value of the non-current investment decreased beyond the management
earnings forecast and as a result there was a decline in the share prices of Covota that
ultimately contributed to the fall in the share prices of TPG Telecom Ltd TPG (Busco 2016).
The industry factors suggest that the decline in the share price was primary because of
the slow growth rate and the analyst forecast have suggested that would continue to remain
slow. The “macroeconomic factors” on the other hand states that the company has cut the
dividend to 2 per cent that ultimate resulted in forecasted decline for the financial year of
2018 (Adams 2017). Amid these factors the company “significant announcement” included
an increase in the debt facilities by additional $750 million. As a result this enabled the
company to fund its capital expenditure for its mobile network along with the spectrum with
the help of debt instead of using equity (Du Plessis Hargovan and Harris 2018). This
ultimately contributed to the late rise in the price of shares for TPG Telecom Ltd.
Another important factor that contributed to share price of TPG Telecom Ltd is the
impact of competitors. The announcement of the company stated that it anticipates a lower
11
profit forecast for the entire group based on the recent release of the data obtained from the
“Australian Coopetition and Consumer Commission and Competitors” (Amran, Lee and
Devi 2014). The NBN can be considered as the one of the primary reason for the lower stock
price by 55.7% since TPG Telecom Ltd had to pay more money to obtain the access of the
fibre broadband network (Tricker and Tricker 2015). The “industry wide factors” such as
decrease in the Australian market average contributed to the falling share price of the
company over the last year.
Calculation of Beta and Required Rate of Return under CAPM:
Beta Calculated of TPG Telecom Ltd:
The calculated beta for the TPG Telecom Ltd stands 1.95.
Calculations of Required rate of Return:
Particulars Amount
Beta of the company A 1.95
Risk Free Rate B 4%
Market Risk Premium C 6%
Required Rate of Return D=B+[AxC] 15.70%
As evident from the above stated computation an assertion can be bought forward by
stating that the risk free rate stood 4% while the market risk represented 6%. Therefore, the
computed value of the require rate of return for the TPG Telecom Ltd stood 15.70%.
Justification behind the “Conservative Investment”
The rationale for making a conservative investment in the TPG Telecom Ltd is
because the company has better value in terms of earnings as compared to the other
Australian telecom industry average (Ioannou and Serafeim 2017). Additionally the company
is also regarded as better value based on the earnings in comparison to the Australian market.
⊘ This is a preview!⊘
Do you want full access?
Subscribe today to unlock all pages.
Trusted by 1+ million students worldwide
1 out of 19
Related Documents


Your All-in-One AI-Powered Toolkit for Academic Success.
+13062052269
info@desklib.com
Available 24*7 on WhatsApp / Email
![[object Object]](/_next/static/media/star-bottom.7253800d.svg)
Unlock your academic potential
Copyright © 2020–2026 A2Z Services. All Rights Reserved. Developed and managed by ZUCOL.