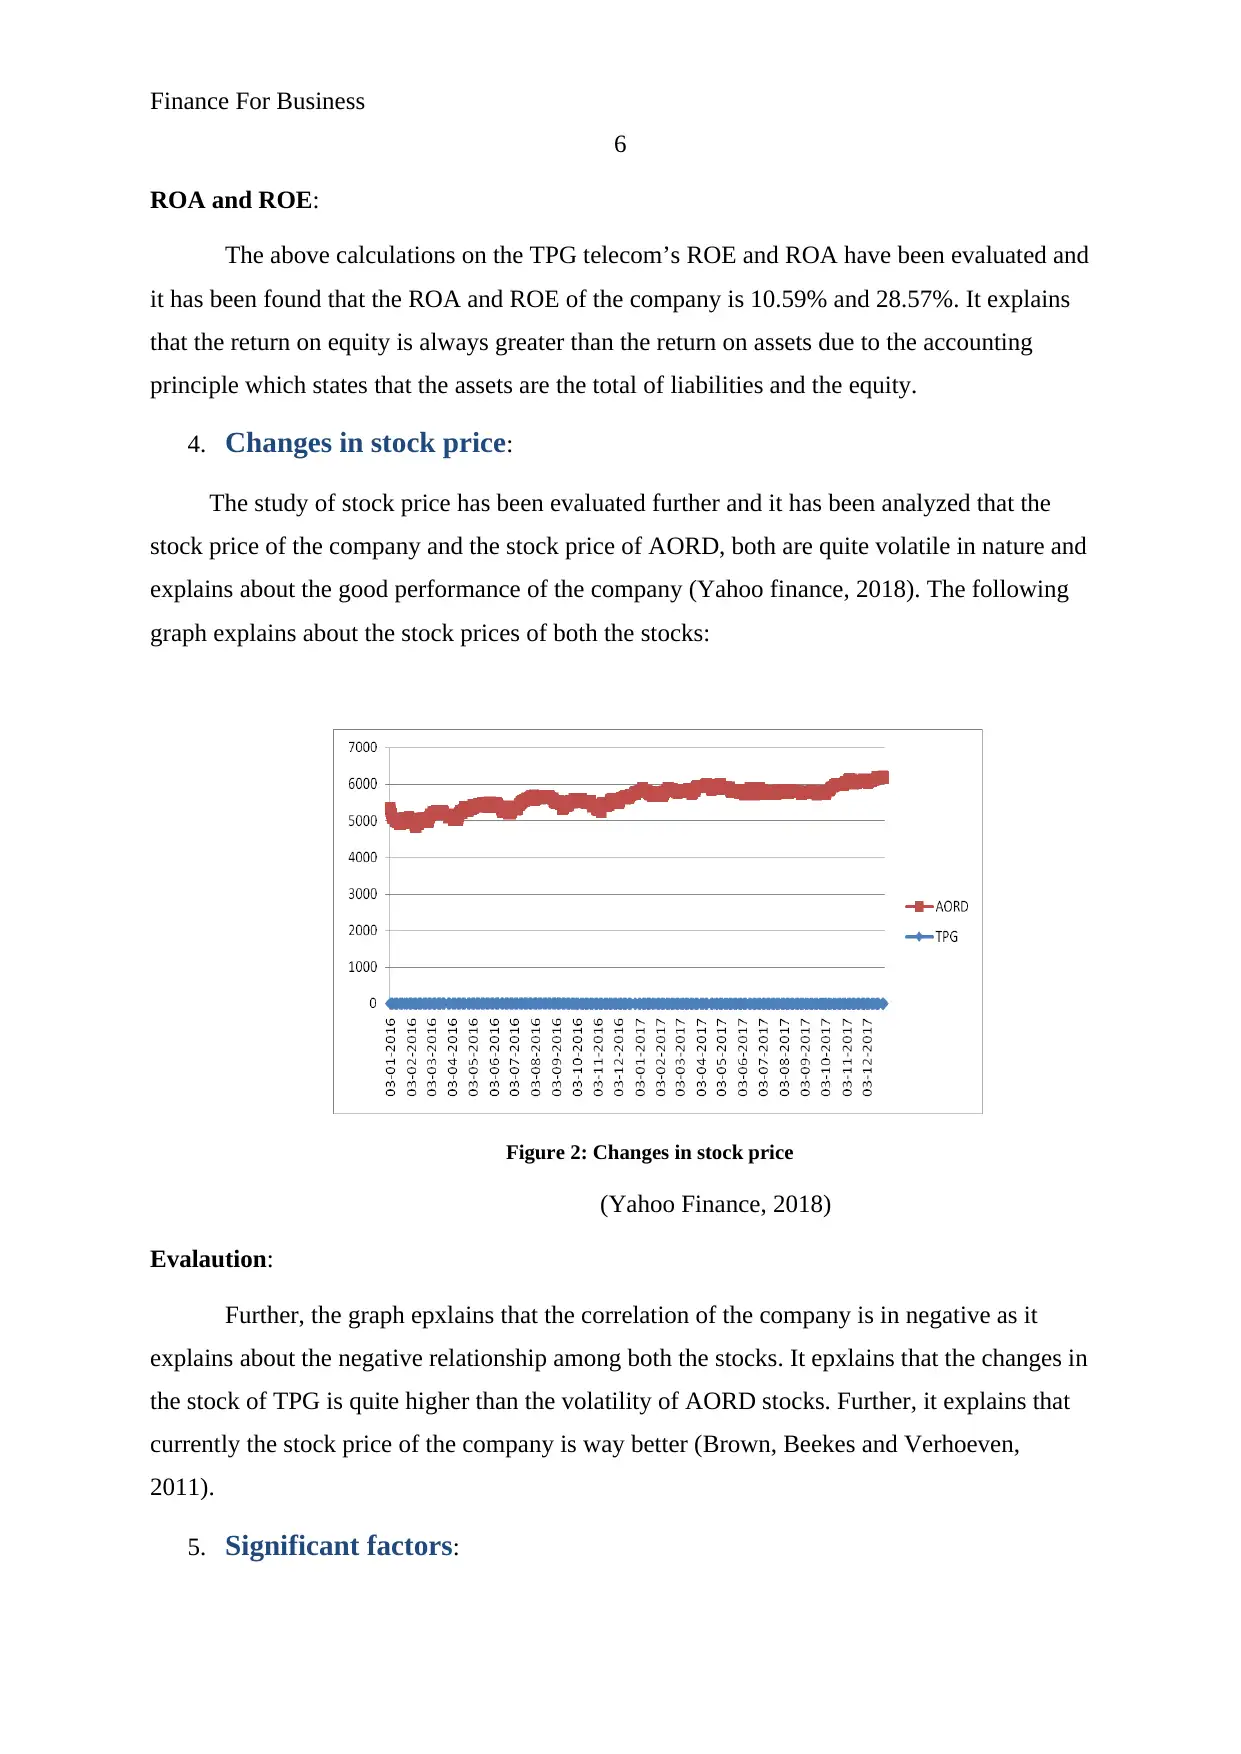
Analysis of TPG Telecom Ltd's Financial Performance from 2013 to 2022
VerifiedAdded on  2020/05/16
|13
|3134
|37
AI Summary
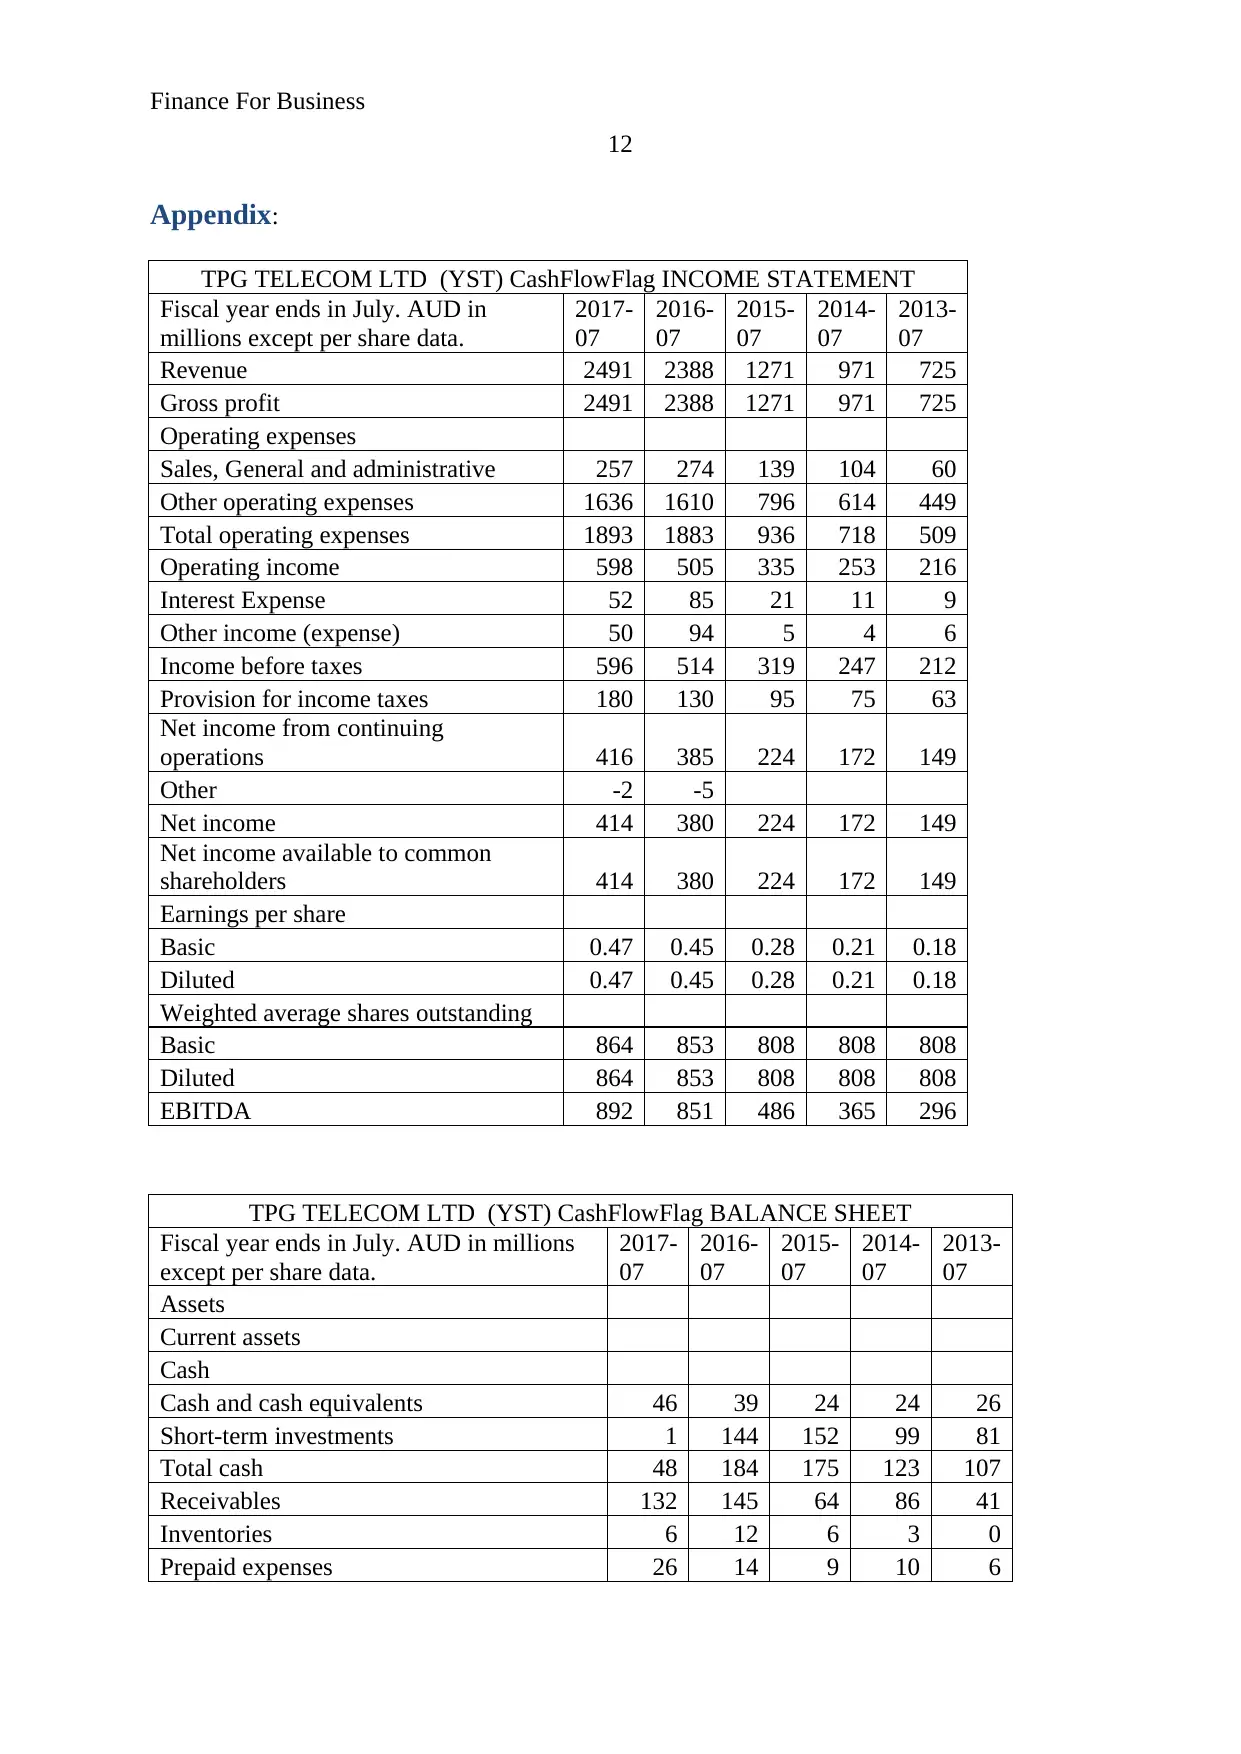
This analysis covers TPG Telecom Ltd.'s financial health from 2013 to 2017 based on their statement of cash flows and comparative balance sheet information. Key components include evaluating cash flows from operating, investing, and financing activities, alongside examining changes in assets, liabilities, and shareholders' equity. The operating section shows consistently positive net cash provided by operations, while significant fluctuations are noted in investing activities due to acquisitions and asset purchases. Financing activities reflect debt management practices with notable issuance and repayment actions. A critical metric, free cash flow, highlights operational liquidity post capital expenditures, showing an overall increase from 2015 onwards. The balance sheet data illustrates growth in assets and equity, countered by increasing liabilities, suggesting a strategic leverage approach to support expansion. This assignment aims to interpret these financial dynamics, providing insights into TPG Telecom’s fiscal strategies, efficiency in cash utilization, and potential investment attractiveness.

Running Head: Finance For Business
1
Project Report: Finance for business
1
Project Report: Finance for business
Paraphrase This Document
Need a fresh take? Get an instant paraphrase of this document with our AI Paraphraser

Finance For Business
2
Contents
1. Company description...............................................................................................3
2. Ownership governance structure.............................................................................3
3. Performance ratios...................................................................................................4
4. Changes in stock price.............................................................................................5
5. Significant factors....................................................................................................6
6. Calculation of CAPM and beta values.....................................................................6
7. WACC calculations.................................................................................................7
8. Debt ratios................................................................................................................8
9. Dividend policy........................................................................................................8
10. Recommendation and Conclusion...........................................................................8
References.......................................................................................................................10
Appendix.........................................................................................................................11

Finance For Business
3
1. Company description:
This report has been prepared on an Australian company which name is TPG Telecom
limited. This company is working under the IT industry and the Australian
telecommunication industry. The main services of the company are mobile telephone services
and the internet services. According to a report, TPG telecom is the second largest comapny
in Australian market in internet service provider companies. This company is mainly a
merger between total peripherals group. This company has been founded in 1992 by Vickey
Teoh and David. Basically, this company is performing well in terms of finance as well as in
terms of finance (About us, 2018).
2. Ownership governance structure:
Substantial stakeholders:
Ownership corporate governance of the TPG telecom expresses about the way good
structure of the investors. 82.74% stock of the company own by the top 20 shareholders. The
largest shareholder of the company is WASHINGTON H SOUL PATTINSON AND
COMPANY LIMITED. The company has held 25.15% stock of the company. Currently,
there are 6 stockholders in the company who has more than 5% stock in the company’s shares
and only 1 stockholder has more than 20% stock.
⊘ This is a preview!⊘
Do you want full access?
Subscribe today to unlock all pages.

Trusted by 1+ million students worldwide

Finance For Business
4
Figure 1: Top twenty shareholders
(Annual Report, 2018)
Main people:
Further, the annual report describe the CEO, executive directors, non executive
directors, CFO etc of the company has been evaluated and David Teoh is the executive
chairman of the company, Denis Ladbury, Robert Millner, Joseph Pang and Shane Teoh is
the non executive directors of the company. The report of top 20 shareholders of the company
explains that no members of the company have more than 2% stock of the company (Annual
Report, 2018).
3. Performance ratios:
Performance ratios of the company have been described below. Performance ratios
explain about the positive changes, position and the performance of the company. Following
are some of the performance ratios of TPG Telecom as follows:
Return on assets:
Return on assets of the company explains that the performance of the company is
quite better. It explains that how much profit is earned by the company in context with the
total assets. Following is the calculations of return on assets of the company:
Paraphrase This Document
Need a fresh take? Get an instant paraphrase of this document with our AI Paraphraser

Finance For Business
5
A. Return on assets= NPAT/ total Assets
414/3911
10.59%
(Jiashu, 2009)
Return on equity:
Return on equity of the company explains that the performance of the company is
quite better. It explains that how much profit is earned by the company in context with the
total equity. Following is the calculations of return on equity of the company:
B. Return on Equity=
Net profit after tax/
ordinary equity
414/1449
28.57%
Debt ratios:
Debt ratios of the company explain about the position and the capital structure of the
company. The current capital structure of the company is way better. It explains that how
much total liabilities are held by the company in context with the total liability. Following is
the calculations of debt ratio of the company:
C. Debt Ratios =
Total Liabilities/ total
assets
1516/3911
38.76%
EBIT / TA * NPAT / EBIT * TA/ OE = NPAT / OE
(598/3911)*(414/598)*(3911/1449)
= (414/1449)
28.57% 28.57%
TA/OE:
Total assets and total equity determine the ROA and ROE of the company with the
help of the Net profit after tax. If the total assets and the total equity of an organization
changes than it directly makes an impact over the ROA and the ROE (Deegan, 2013).

Finance For Business
6
ROA and ROE:
The above calculations on the TPG telecom’s ROE and ROA have been evaluated and
it has been found that the ROA and ROE of the company is 10.59% and 28.57%. It explains
that the return on equity is always greater than the return on assets due to the accounting
principle which states that the assets are the total of liabilities and the equity.
4. Changes in stock price:
The study of stock price has been evaluated further and it has been analyzed that the
stock price of the company and the stock price of AORD, both are quite volatile in nature and
explains about the good performance of the company (Yahoo finance, 2018). The following
graph explains about the stock prices of both the stocks:
Figure 2: Changes in stock price
(Yahoo Finance, 2018)
Evalaution:
Further, the graph epxlains that the correlation of the company is in negative as it
explains about the negative relationship among both the stocks. It epxlains that the changes in
the stock of TPG is quite higher than the volatility of AORD stocks. Further, it explains that
currently the stock price of the company is way better (Brown, Beekes and Verhoeven,
2011).
5. Significant factors:
⊘ This is a preview!⊘
Do you want full access?
Subscribe today to unlock all pages.

Trusted by 1+ million students worldwide

Finance For Business
7
Further, the factors has been evalauted which have imapcted on the stock price and due
to which the stock of the company has been changed. The main reason behind chnage is the
competetion level of the company, current report about the company that is the second largest
company in the industry, further, the analysts has described in their report about a better
position of the company in the market (Davies and Crawford, 2011). On the other hand, due
to new technology and compatetion the stock price of the company has been lowered 2 to 3
times.
6. Calculation of CAPM and beta values:
Beta:
The calculation on the stock price of the company depicts that the beta of the
company is 0.7415.
Required rate of return:
The required rate of return of the company is as follows:
Calculation of cost of equity (CAPM)
RF 4.00%
RM 6.00%
Beta 74.15%
Required rate of
return
5.48%
(Morningstar, 2018)
Explanation:
The above calculations express that the company’s cost in terms of equity is 5.48%. If
the company wants to raises the funds through equity than the company has to pay 5.48% of
total profit as cost of equity to the stockholders of the company. The cost of equity of the
company is moderate.
Conservative company:
Paraphrase This Document
Need a fresh take? Get an instant paraphrase of this document with our AI Paraphraser

Finance For Business
8
According to the evaluation, it has been found that the risk of the company is lower
and return of the company is quite higher and thus the company is a conservative investment.
7. WACC calculations:
Calculations of WACC are as follows:
Calculation of WACC
Price Cost Weight WACC
Debt 949 4.20% 0.39575 0.01662
Equity 1,449 5.48% 0.60425 0.03313
2,398 Kd 4.98%
(Morningstar, 2018)
Working Note:
Calculation of cost of debt
Outstanding debt 949
interest rate 6%
Tax rate 0.3
Kd 4.20%
Calculation of cost of equity
(CAPM)
RF 4.00%
RM 6.00%
Beta 74.51%
Required rate of return 5.48%
Evaluation:
The above calculations express that the company’s cost in terms of equity is 5.48%
and in terms of debt is 4.2%. If the company wants to raises the funds through equity than the
company has to pay 5.48% of total profit as cost of equity to the stockholders of the
company. On the other hand, in terms of debt, company has to pay 4.2%. The cost of equity
of the company is higher than the cost of debt of the company. The above calculations
express that the cost of capital of the company is 4.07%.
8. Debt ratios:

Finance For Business
9
Optimal capital structure:
Optimal capital structure of the company explains that the liabilities of the company
have been reduced by the company to manage a better capital structure.
2017 2016
Debt Ratios
Total Liabilities/ total
assets
Total Liabilities/ total
assets
1516/3911 1997/3771
38.76% 52.96%
(Brown, Beekes and Verhoeven, 2011)
Gearing ratios:
Gearing ratios of the company explains about the liabilities of the company which has
been reduced and the borrowings of the company has been increased in current month and
thus the gearing ratios of the company has been lowered.
2017 2016
Gearing ratios
Total Liabilities/
Capital employed
Total Liabilities/
Capital employed
1516/(3911-568) 1997/(3771-514)
45.35% 61.31%
9. Dividend policy:
The annual report of the company expresses that the company offers a great dividend to
the company with a 1.25% growth rate each year. It depicts that the company is following
relevant dividend policies (Annual report, 2018). Relevant dividend policies are a part of
dividend policies. These policies explain to the company that they should announce and give
a good amount of dividend to the stockholder so that the investment level of the company
could be enhanced.
10. Recommendation and Conclusion:
To,
The Client.
Date: 29th Jan 2017.
⊘ This is a preview!⊘
Do you want full access?
Subscribe today to unlock all pages.

Trusted by 1+ million students worldwide

Finance For Business
10
Subject: Recommendation about investment.
Dear Client,
It is recommended to you to invest into TPG telecom. The report of evaluation of TPG
telecom briefs that the current position of the company is quite attractive. It presents that the
huge profit is earned by the company and the great amount of dividend is given to the
shareholders of the company. The market stock price of the company is also good. It explains
that the investors should invest into the company.
So, it is the best option for you to invest right now.
Faithfully,
Financial Analyst.
Paraphrase This Document
Need a fresh take? Get an instant paraphrase of this document with our AI Paraphraser

Finance For Business
11
References:
About us. 2018. TPG Telecom Limited. viewed Jan 25, 2018, https://www.tpg.com.au/
Annual Report. 2018. TPG Telecom Limited. viewed Jan 25, 2018,
https://www.tpg.com.au/about/pdfs/FY17%20Annual%20Report.pdf
Brown, P., Beekes, W., and Verhoeven, P. 2011. Corporate governance, accounting and
finance: A review. Accounting & finance, 51(1), 96-172.
Davies, T. and Crawford, I., 2011. Business accounting and finance. Pearson.
Deegan, C., 2013. Financial accounting theory. McGraw-Hill Education Australia.
Jiashu, G. 2009. Study on Fair Value Accounting——on the essential characteristics of
financial accounting [J]. Accounting Research, 5, 003.
Morningstar. 2018. TPG Telecom Limited. viewed Jan 25, 2018,
http://financials.morningstar.com/cash-flow/cf.html?t=XBER:YST®ion=deu&culture=en-
US
Yahoo Finance. 2018. TPG Telecom Limited. viewed Jan 25, 2018,
https://au.finance.yahoo.com/quote/TPM.AX/chart?p=TPM.AX

Finance For Business
12
Appendix:
TPG TELECOM LTD (YST) CashFlowFlag INCOME STATEMENT
Fiscal year ends in July. AUD in
millions except per share data.
2017-
07
2016-
07
2015-
07
2014-
07
2013-
07
Revenue 2491 2388 1271 971 725
Gross profit 2491 2388 1271 971 725
Operating expenses
Sales, General and administrative 257 274 139 104 60
Other operating expenses 1636 1610 796 614 449
Total operating expenses 1893 1883 936 718 509
Operating income 598 505 335 253 216
Interest Expense 52 85 21 11 9
Other income (expense) 50 94 5 4 6
Income before taxes 596 514 319 247 212
Provision for income taxes 180 130 95 75 63
Net income from continuing
operations 416 385 224 172 149
Other -2 -5
Net income 414 380 224 172 149
Net income available to common
shareholders 414 380 224 172 149
Earnings per share
Basic 0.47 0.45 0.28 0.21 0.18
Diluted 0.47 0.45 0.28 0.21 0.18
Weighted average shares outstanding
Basic 864 853 808 808 808
Diluted 864 853 808 808 808
EBITDA 892 851 486 365 296
TPG TELECOM LTD (YST) CashFlowFlag BALANCE SHEET
Fiscal year ends in July. AUD in millions
except per share data.
2017-
07
2016-
07
2015-
07
2014-
07
2013-
07
Assets
Current assets
Cash
Cash and cash equivalents 46 39 24 24 26
Short-term investments 1 144 152 99 81
Total cash 48 184 175 123 107
Receivables 132 145 64 86 41
Inventories 6 12 6 3 0
Prepaid expenses 26 14 9 10 6
⊘ This is a preview!⊘
Do you want full access?
Subscribe today to unlock all pages.

Trusted by 1+ million students worldwide
1 out of 13
Related Documents

Your All-in-One AI-Powered Toolkit for Academic Success.
 +13062052269
info@desklib.com
Available 24*7 on WhatsApp / Email
Unlock your academic potential
Copyright © 2020–2025 A2Z Services. All Rights Reserved. Developed and managed by ZUCOL.