Comprehensive Financial Analysis and Valuation of TPG Telecom Limited
VerifiedAdded on 2023/06/04
|18
|3903
|228
Report
AI Summary
This report provides a comprehensive financial analysis of TPG Telecom Limited, evaluating its performance over two years. It examines short-term and long-term solvency ratios, including quick, current, debt-equity, and debt-to-asset ratios, to assess the company's ability to meet its financial obligations. Efficiency ratios, such as accounts receivable turnover and total asset turnover, are calculated to gauge the effective utilization of assets. Profitability ratios, including return on equity and earnings per share, are analyzed to determine the company's profitability. Market value ratios, such as book value per share, are also discussed. The report includes a share valuation using the constant dividend growth model and concludes with recommendations based on the financial analysis.

TPG TELECOM LIMITED
Page 1 of 18
Page 1 of 18
Paraphrase This Document
Need a fresh take? Get an instant paraphrase of this document with our AI Paraphraser
Table of Contents
Introduction................................................................................................................................4
Brief Description of the TPG.....................................................................................................4
Calculation and Analysis of Performance Ratios.......................................................................4
Short-term solvency ratios......................................................................................................4
• Quick ratio........................................................................................................................5
• Current ratio.....................................................................................................................5
Long-term solvency ratios or Leverage ratio.........................................................................5
• Debt equity ratio...............................................................................................................6
• Debt to assets ratios..........................................................................................................6
• Debt to capital ratio..........................................................................................................6
• Debt to EBITDA ratio......................................................................................................6
• The asset to equity ratio....................................................................................................7
Efficiency ratio.......................................................................................................................8
• Accounts receivable turnover...........................................................................................8
• Inventory turnover............................................................................................................8
• Accounts Payable turnover...............................................................................................8
• Total assets turnover.........................................................................................................8
• Fixed assets turnover ratio................................................................................................8
• Operating expense ratio....................................................................................................9
• Return on investment........................................................................................................9
• Average collection period.................................................................................................9
• Average payment period...................................................................................................9
Profitability ratio..................................................................................................................10
• Return on equity.............................................................................................................11
• Earning per share............................................................................................................11
• Dividend per share..........................................................................................................11
• Price earnings ratio.........................................................................................................11
• Return on capital employed............................................................................................11
• Return on assets..............................................................................................................11
• Gross profit.....................................................................................................................11
• Net profit........................................................................................................................12
Market value ratios...............................................................................................................13
Page 2 of 18

• Book value per share......................................................................................................13
• Dividend Yield...............................................................................................................13
Graphs and comparison of share price movements..................................................................15
Share Valuation: Constant dividend growth model.................................................................15
Conclusion................................................................................................................................16
Recommendations....................................................................................................................16
References................................................................................................................................17
Page 3 of 18
⊘ This is a preview!⊘
Do you want full access?
Subscribe today to unlock all pages.
Trusted by 1+ million students worldwide
Introduction
TPG is the second largest player in the telecom sector operating in Australia. TPG’s
performance is evaluated in various terms for the last two years.
Several ratios have been calculated to identify their performance for the last two years. The
deep understanding will enable shareholders to gain knowledge about the performance of the
company, return on investment, valuation of earning per share, market price per share,
analysis of assets deployed and the efficiency of its utilization, analysis of capital structure,
the flow of interest towards long-term debt and short-term debt.
Brief Description of the TPG
TPG deals in the telecommunications industry, where customers are delivered with the best
communication services which are fast, reliable and cost-effective. They deal in various types
of customers ranging from residential users, small and medium enterprises, government
bodies, large corporate enterprise to wholesale customers. TPG was formed with the
combination of two companies, Total Peripheral Group and SP Telemedia. The major areas
covered by this company are Australia, New Zealand, and Singapore.
Calculation and Analysis of Performance Ratios
Short-term solvency ratios
This ratio helps a company to understand its ability to meet its short-term financial
obligations, which helps a company to know about the financial loan prevailing in the short
run (Alexander, 2018). The short-term solvency ratios are categorized into two parts. These
are
Page 4 of 18
Paraphrase This Document
Need a fresh take? Get an instant paraphrase of this document with our AI Paraphraser
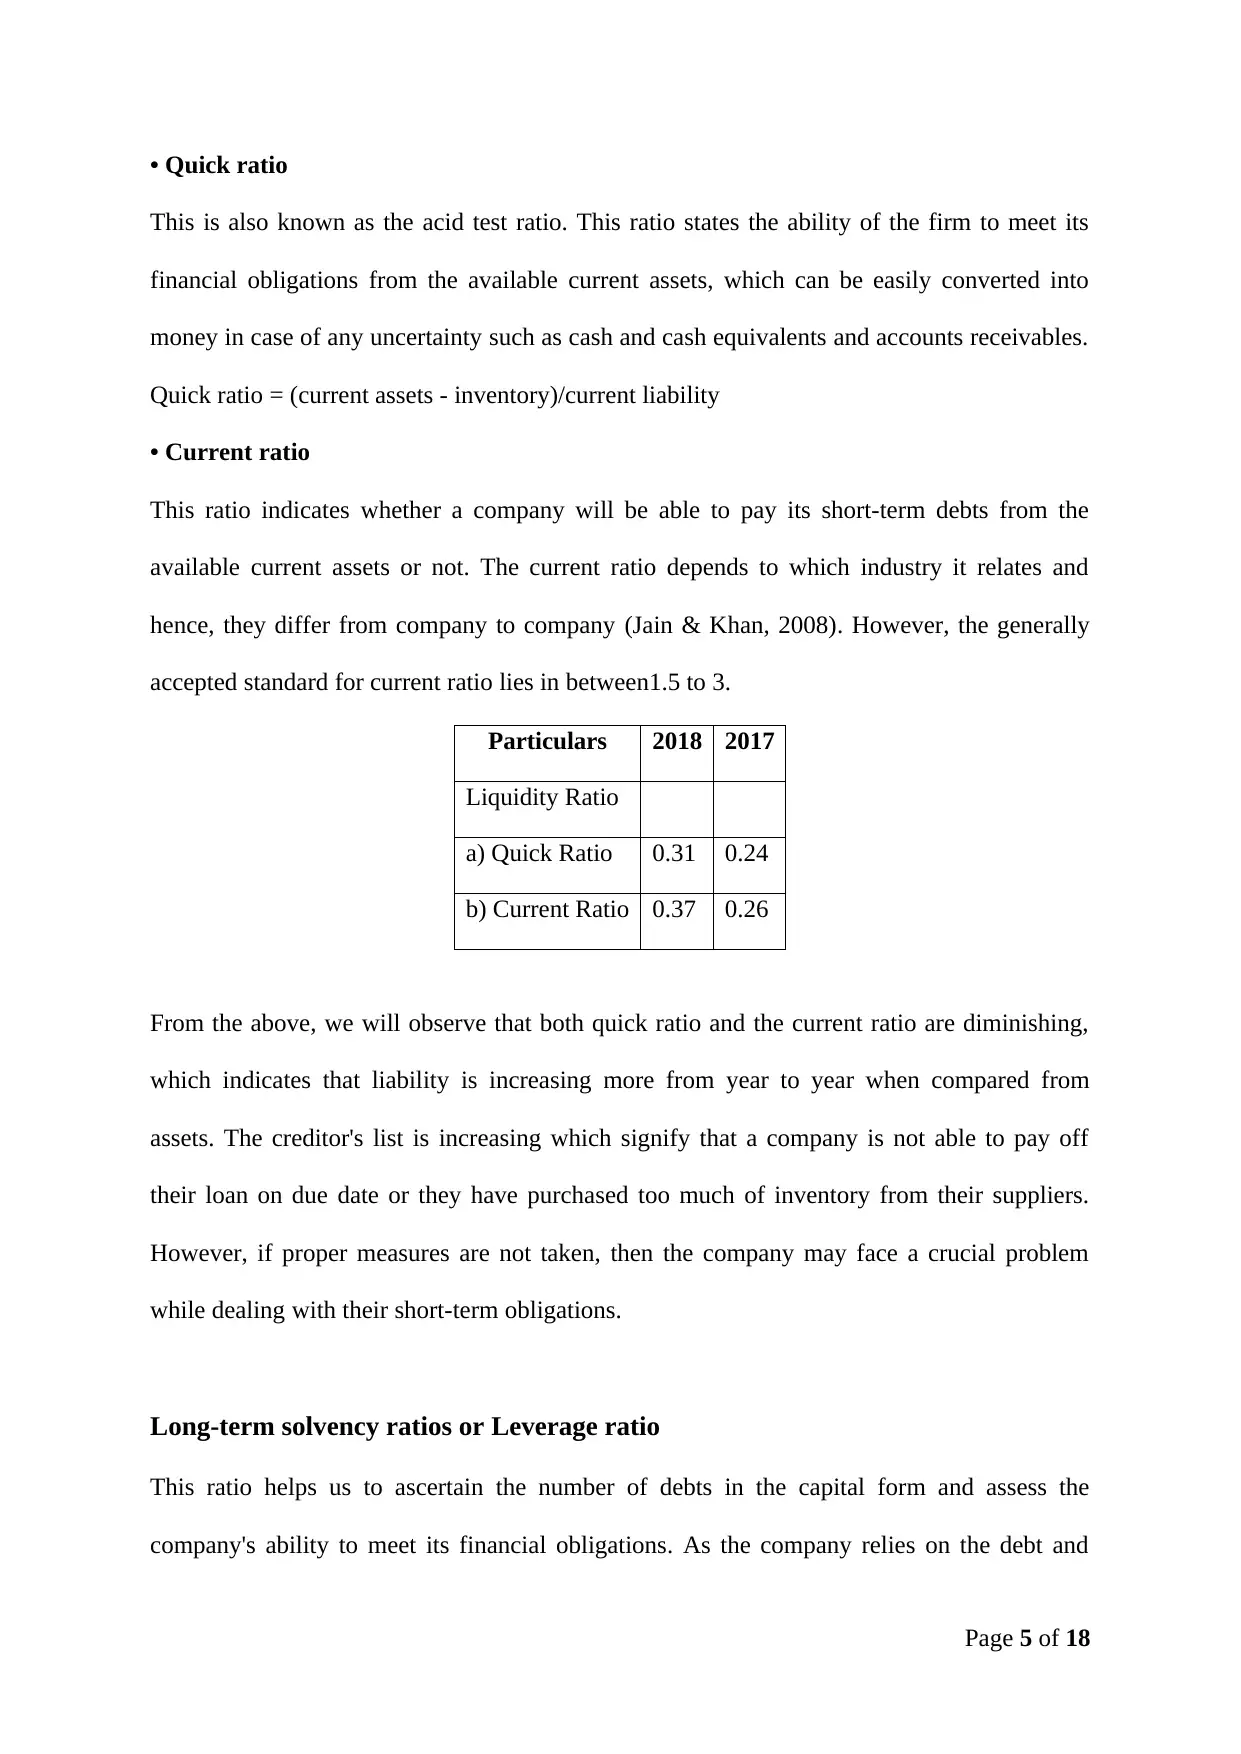
• Quick ratio
This is also known as the acid test ratio. This ratio states the ability of the firm to meet its
financial obligations from the available current assets, which can be easily converted into
money in case of any uncertainty such as cash and cash equivalents and accounts receivables.
Quick ratio = (current assets - inventory)/current liability
• Current ratio
This ratio indicates whether a company will be able to pay its short-term debts from the
available current assets or not. The current ratio depends to which industry it relates and
hence, they differ from company to company (Jain & Khan, 2008). However, the generally
accepted standard for current ratio lies in between1.5 to 3.
Particulars 2018 2017
Liquidity Ratio
a) Quick Ratio 0.31 0.24
b) Current Ratio 0.37 0.26
From the above, we will observe that both quick ratio and the current ratio are diminishing,
which indicates that liability is increasing more from year to year when compared from
assets. The creditor's list is increasing which signify that a company is not able to pay off
their loan on due date or they have purchased too much of inventory from their suppliers.
However, if proper measures are not taken, then the company may face a crucial problem
while dealing with their short-term obligations.
Long-term solvency ratios or Leverage ratio
This ratio helps us to ascertain the number of debts in the capital form and assess the
company's ability to meet its financial obligations. As the company relies on the debt and
Page 5 of 18
equity for its long-term financial goals, it is necessary to know whether the company will be
able to pay its obligations on due date. This ratio is subdivided into three parts:
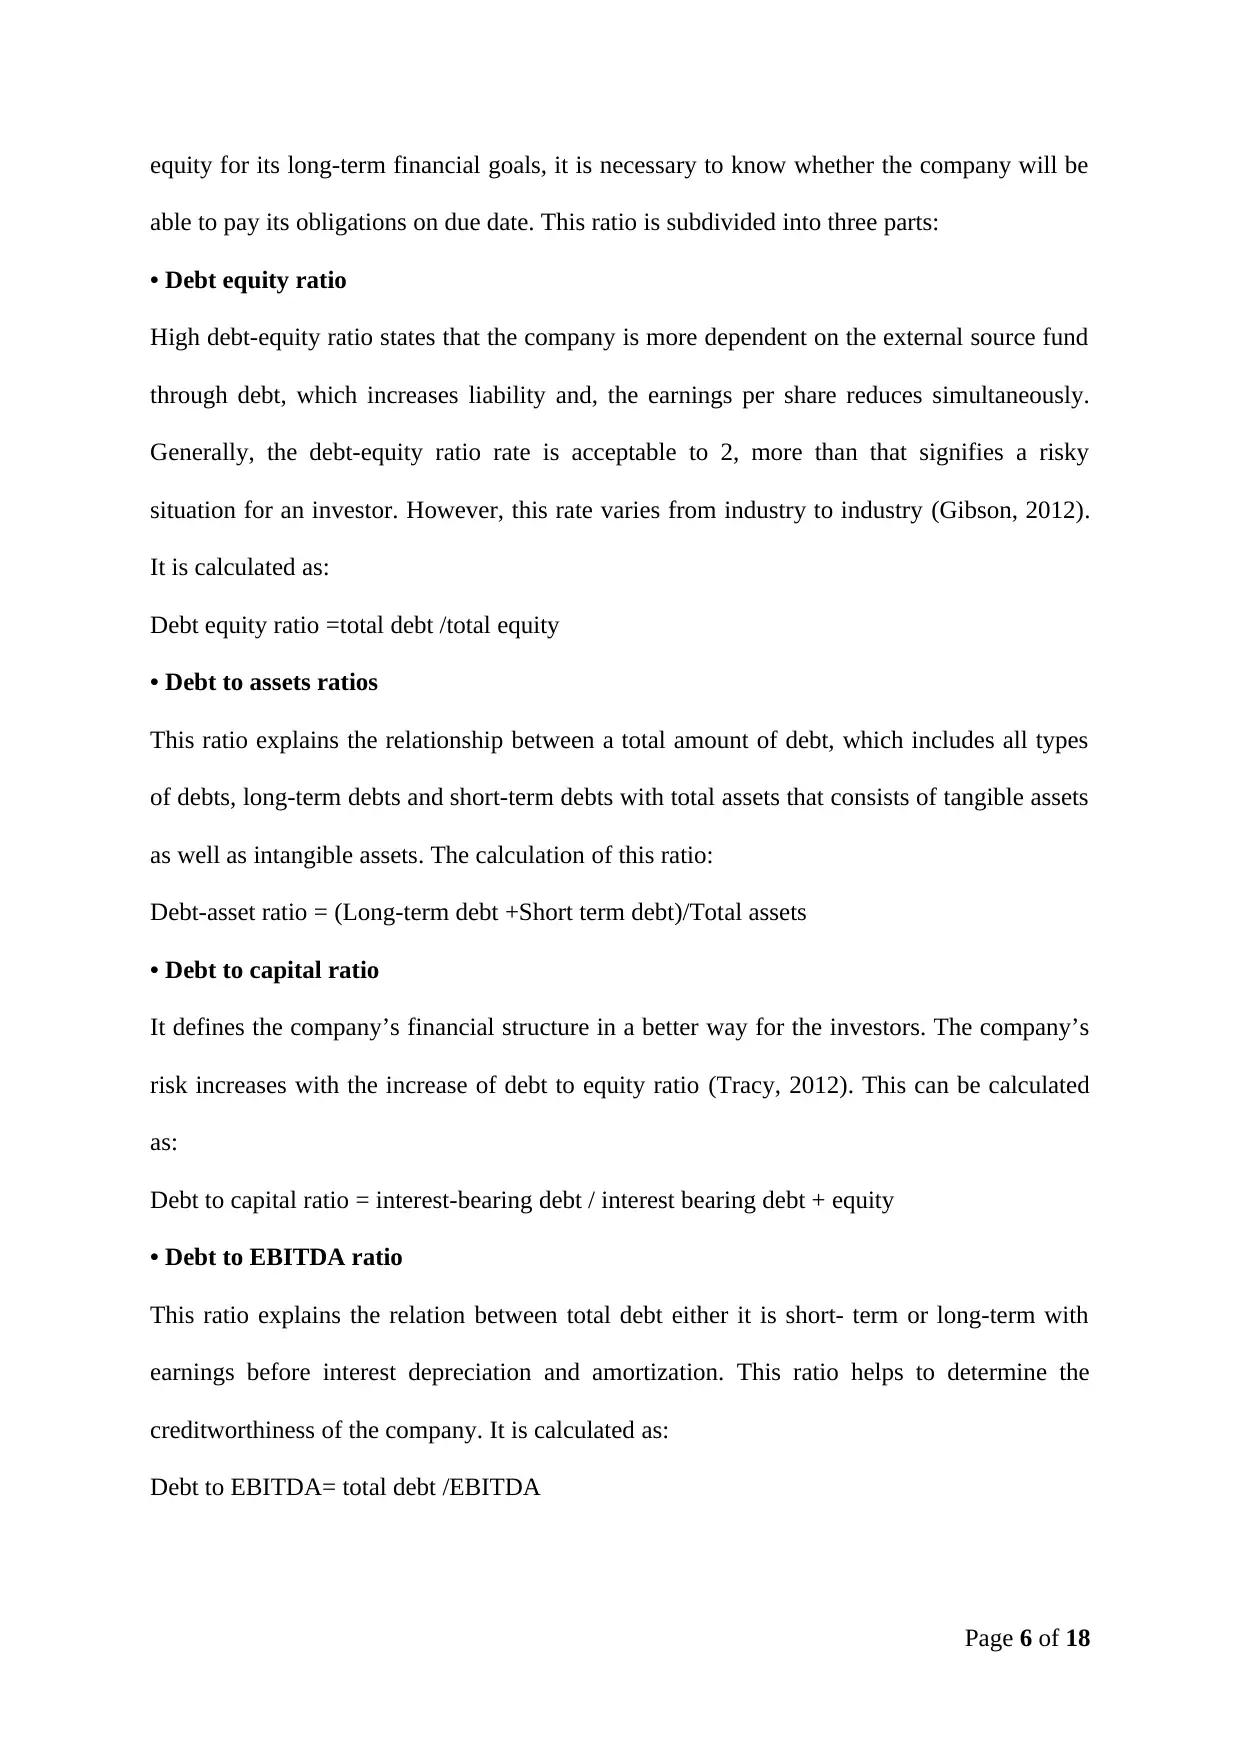
• Debt equity ratio
High debt-equity ratio states that the company is more dependent on the external source fund
through debt, which increases liability and, the earnings per share reduces simultaneously.
Generally, the debt-equity ratio rate is acceptable to 2, more than that signifies a risky
situation for an investor. However, this rate varies from industry to industry (Gibson, 2012).
It is calculated as:
Debt equity ratio =total debt /total equity
• Debt to assets ratios
This ratio explains the relationship between a total amount of debt, which includes all types
of debts, long-term debts and short-term debts with total assets that consists of tangible assets
as well as intangible assets. The calculation of this ratio:
Debt-asset ratio = (Long-term debt +Short term debt)/Total assets
• Debt to capital ratio
It defines the company’s financial structure in a better way for the investors. The company’s
risk increases with the increase of debt to equity ratio (Tracy, 2012). This can be calculated
as:
Debt to capital ratio = interest-bearing debt / interest bearing debt + equity
• Debt to EBITDA ratio
This ratio explains the relation between total debt either it is short- term or long-term with
earnings before interest depreciation and amortization. This ratio helps to determine the
creditworthiness of the company. It is calculated as:
Debt to EBITDA= total debt /EBITDA
Page 6 of 18
able to pay its obligations on due date. This ratio is subdivided into three parts:
• Debt equity ratio
High debt-equity ratio states that the company is more dependent on the external source fund
through debt, which increases liability and, the earnings per share reduces simultaneously.
Generally, the debt-equity ratio rate is acceptable to 2, more than that signifies a risky
situation for an investor. However, this rate varies from industry to industry (Gibson, 2012).
It is calculated as:
Debt equity ratio =total debt /total equity
• Debt to assets ratios
This ratio explains the relationship between a total amount of debt, which includes all types
of debts, long-term debts and short-term debts with total assets that consists of tangible assets
as well as intangible assets. The calculation of this ratio:
Debt-asset ratio = (Long-term debt +Short term debt)/Total assets
• Debt to capital ratio
It defines the company’s financial structure in a better way for the investors. The company’s
risk increases with the increase of debt to equity ratio (Tracy, 2012). This can be calculated
as:
Debt to capital ratio = interest-bearing debt / interest bearing debt + equity
• Debt to EBITDA ratio
This ratio explains the relation between total debt either it is short- term or long-term with
earnings before interest depreciation and amortization. This ratio helps to determine the
creditworthiness of the company. It is calculated as:
Debt to EBITDA= total debt /EBITDA
Page 6 of 18
⊘ This is a preview!⊘
Do you want full access?
Subscribe today to unlock all pages.
Trusted by 1+ million students worldwide
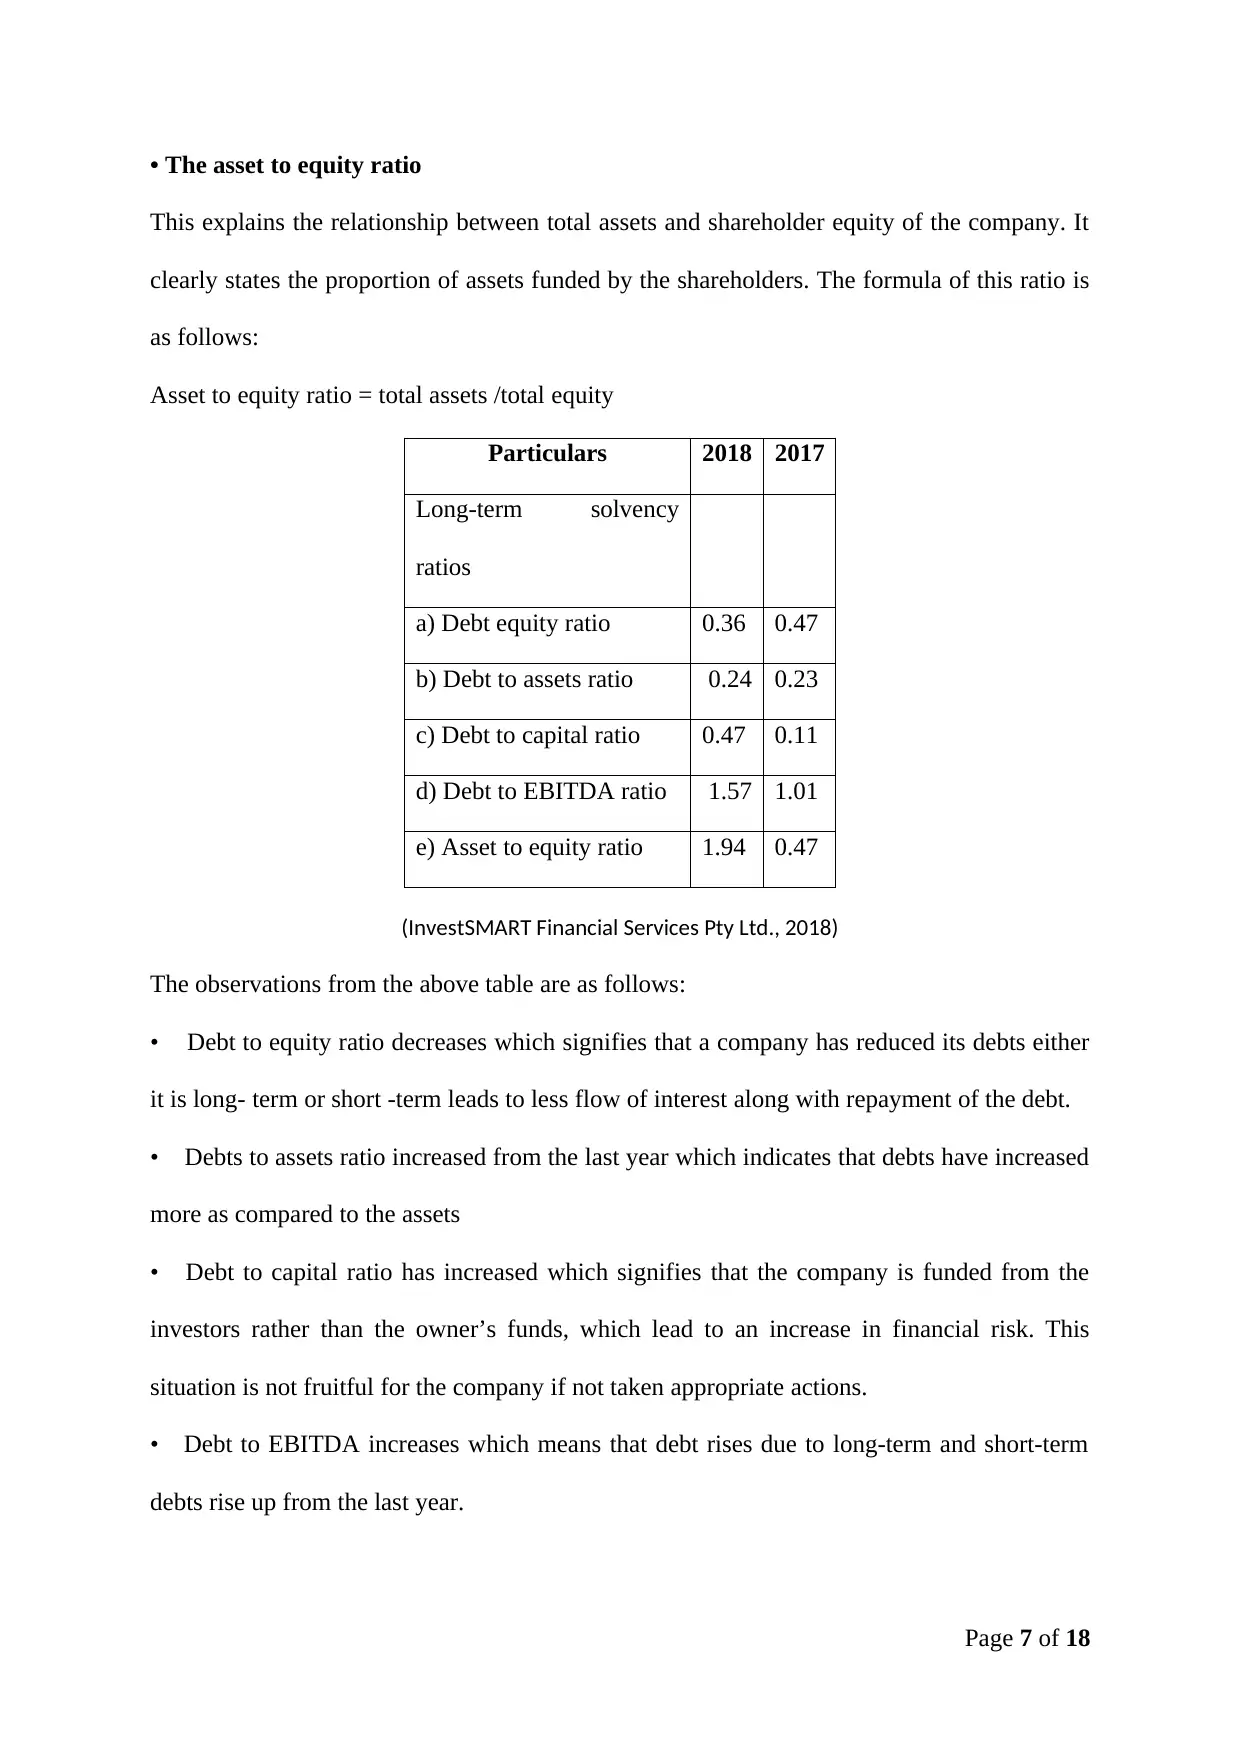
• The asset to equity ratio
This explains the relationship between total assets and shareholder equity of the company. It
clearly states the proportion of assets funded by the shareholders. The formula of this ratio is
as follows:
Asset to equity ratio = total assets /total equity
Particulars 2018 2017
Long-term solvency
ratios
a) Debt equity ratio 0.36 0.47
b) Debt to assets ratio 0.24 0.23
c) Debt to capital ratio 0.47 0.11
d) Debt to EBITDA ratio 1.57 1.01
e) Asset to equity ratio 1.94 0.47
(InvestSMART Financial Services Pty Ltd., 2018)
The observations from the above table are as follows:
• Debt to equity ratio decreases which signifies that a company has reduced its debts either
it is long- term or short -term leads to less flow of interest along with repayment of the debt.
• Debts to assets ratio increased from the last year which indicates that debts have increased
more as compared to the assets
• Debt to capital ratio has increased which signifies that the company is funded from the
investors rather than the owner’s funds, which lead to an increase in financial risk. This
situation is not fruitful for the company if not taken appropriate actions.
• Debt to EBITDA increases which means that debt rises due to long-term and short-term
debts rise up from the last year.
Page 7 of 18
Paraphrase This Document
Need a fresh take? Get an instant paraphrase of this document with our AI Paraphraser
• The rate of asset rises which indicates that the company has undertaken more assets in the
current financial year.
Efficiency ratio
This ratio clearly states out regarding applications of company's assets efficiently, which help
to generate profit and control debt (Lindsayt, 2014). This ratio can further be categorized into
the following:
• Accounts receivable turnover
This is used to measure the company’s credit policy and evaluate how effectively it's
working. It is preferable to have a high rate of accounts receivable turnover ratio.
Accounts receivable turnover = revenue/ average accounts receivable
• Inventory turnover
This ratio helps in identification of company’s performance with respect to their inventory
levels. It is calculated as:
Inventory turnover = cost of sales / average inventory
• Accounts Payable turnover
This ratio defines the company's ability to pay their immediate bills from the available
resources. It is calculated as:
Accounts Payable turnover = cost of sales / average accounts payables
• Total assets turnover
This ratio will explain your efficiency level about the utilization of their short- term and long-
term asset with respect to sales. It is calculated as follows:
Total asset turnover = revenue / average total asset
Page 8 of 18
• Fixed assets turnover ratio
This ratio will help to determine the investment of the company towards fixed assets. This
can be computed as follows:
Fixed assets turnover ratio = net sales /average net fixed assets
• Operating expense ratio
This ratio explains the operating cost of a property against the derived income. It can be
calculated as:
Operating expense ratio= operating expense /total gross income
• Return on investment
This ratio clearly states the rate of return from the particular investment invested by the
investor. It is calculated as:
Return on investment = net profit before tax /net worth
• Average collection period
This ratio helps us to determine the relationship between the credit transactions and
receivables of the same. It can be calculated as:
Average collection period =365 days/ average receivable turnover
• Average payment period
This ratio determines the average number of days that a company take to clear its dues. This
can be computed as:
Average payment period =365 days/average payable turnover
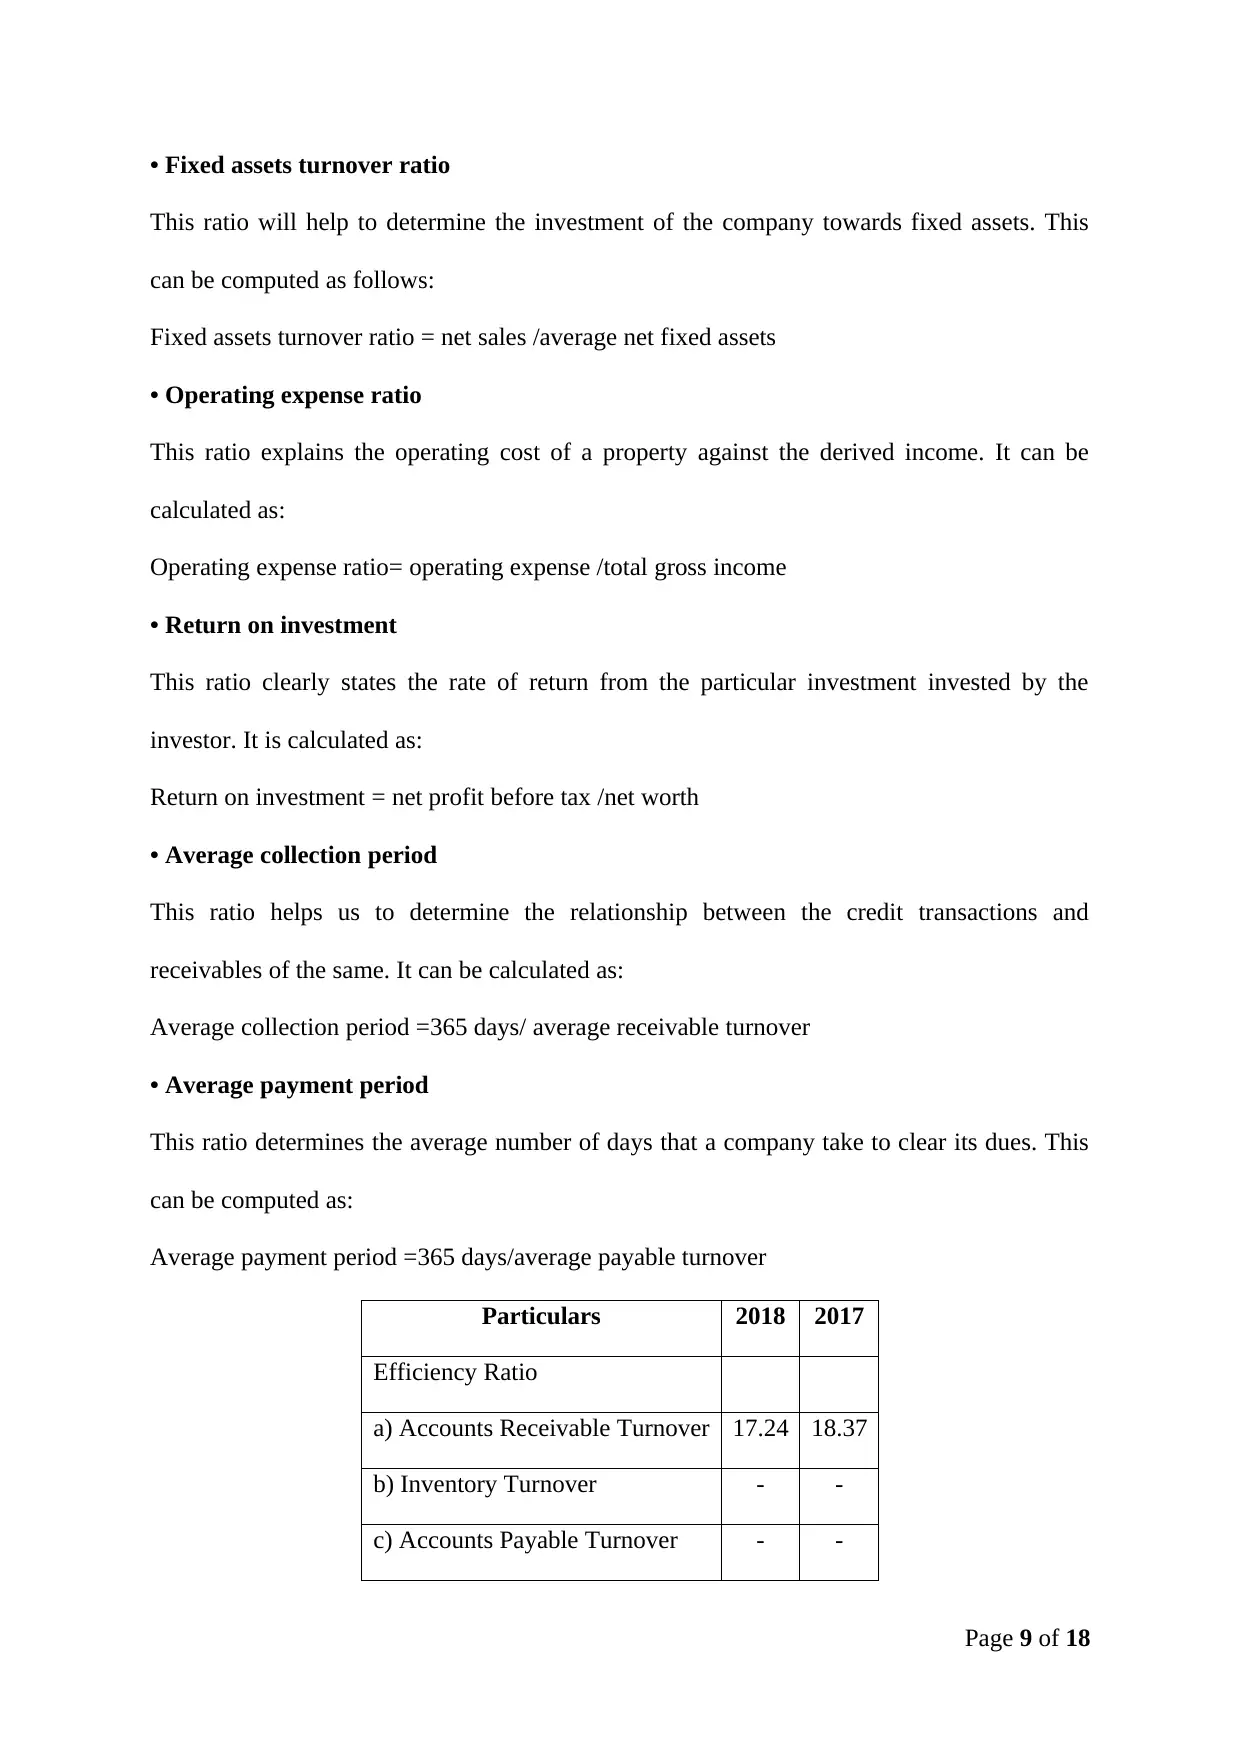
Particulars 2018 2017
Efficiency Ratio
a) Accounts Receivable Turnover 17.24 18.37
b) Inventory Turnover - -
c) Accounts Payable Turnover - -
Page 9 of 18
This ratio will help to determine the investment of the company towards fixed assets. This
can be computed as follows:
Fixed assets turnover ratio = net sales /average net fixed assets
• Operating expense ratio
This ratio explains the operating cost of a property against the derived income. It can be
calculated as:
Operating expense ratio= operating expense /total gross income
• Return on investment
This ratio clearly states the rate of return from the particular investment invested by the
investor. It is calculated as:
Return on investment = net profit before tax /net worth
• Average collection period
This ratio helps us to determine the relationship between the credit transactions and
receivables of the same. It can be calculated as:
Average collection period =365 days/ average receivable turnover
• Average payment period
This ratio determines the average number of days that a company take to clear its dues. This
can be computed as:
Average payment period =365 days/average payable turnover
Particulars 2018 2017
Efficiency Ratio
a) Accounts Receivable Turnover 17.24 18.37
b) Inventory Turnover - -
c) Accounts Payable Turnover - -
Page 9 of 18
⊘ This is a preview!⊘
Do you want full access?
Subscribe today to unlock all pages.
Trusted by 1+ million students worldwide
d) Total assets Turnover 0.65 0.54
e) Fixed Assets Turnover 2.55 2.17
f) Operating Expense Ratio - -
g) Return on Investments 10 14
h) Average Collection Period 3.58 3.23
i) Average Payment Period 1.96 1.72
(Dow Jones & Company, Inc. , 2018)
From the above table we will conclude that:
• Accounts receivable turnover has reduced compared from last year, which means that the
company is finding hard to collect payments from the customers due to which, after some
point of time they will find difficulty for the payment of their obligations.
• Since there is no inventory, hence this ratio will not prevail for this situation due to non-
existence of cost of sales.
• Total assets turnover increased which signify that a company is improving their efficiency
level regarding their utilization of assets.
• Fixed assets turnover increased which indicates that the company has invested in fixed
assets properly. Hence, the company has also focussed on other assets also.
• Return on investment decreases from the previous year which signifies a negative return
for the shareholders.
• Average collection period increased from the previous year which means that the
company is able to recover their collection from the debtors properly.
• Average Payment period rises up from the past year, which indicates that either the
creditor's list increases or the company are unable to pay their debts at the due date.
Profitability ratio
Page 10 of 18
Paraphrase This Document
Need a fresh take? Get an instant paraphrase of this document with our AI Paraphraser
This ratio will help you to determine the amount of profit derived from the current operations,
which help to deliver the final result of the company to an investor, to understand the
performance of the operations perfectly (Clear tax, 2017). This ratio has categorized into
various parts:
• Return on equity
This ratio explains the profit generated by deploying the shareholder's equity of the company
for the financial year. This can be calculated as:
Return on equity= profit after tax /net worth
• Earning per share
This ratio describes earning from each ordinary shareholder point of view. Hence,
shareholder prefers high ratio. This can be computed as:
Earnings per share= net profit /total no of shares
• Dividend per share
This ratio explains the distribution of dividend by the company to each shareholder. It can be
calculated as:
Dividend per share =total dividend attributable to shareholders/number of shares
• Price earnings ratio
This ratio helps an investor to analyze the company’s share price. This can be computed as:
Price earnings ratio =market price per share/earnings per share
• Return on capital employed
This ratio explains the percentage return on funds deployed by the owner in the business. It
can be computed as
Return on capital employed=(net operating profit x 100) /capital employed
Page 11 of 18
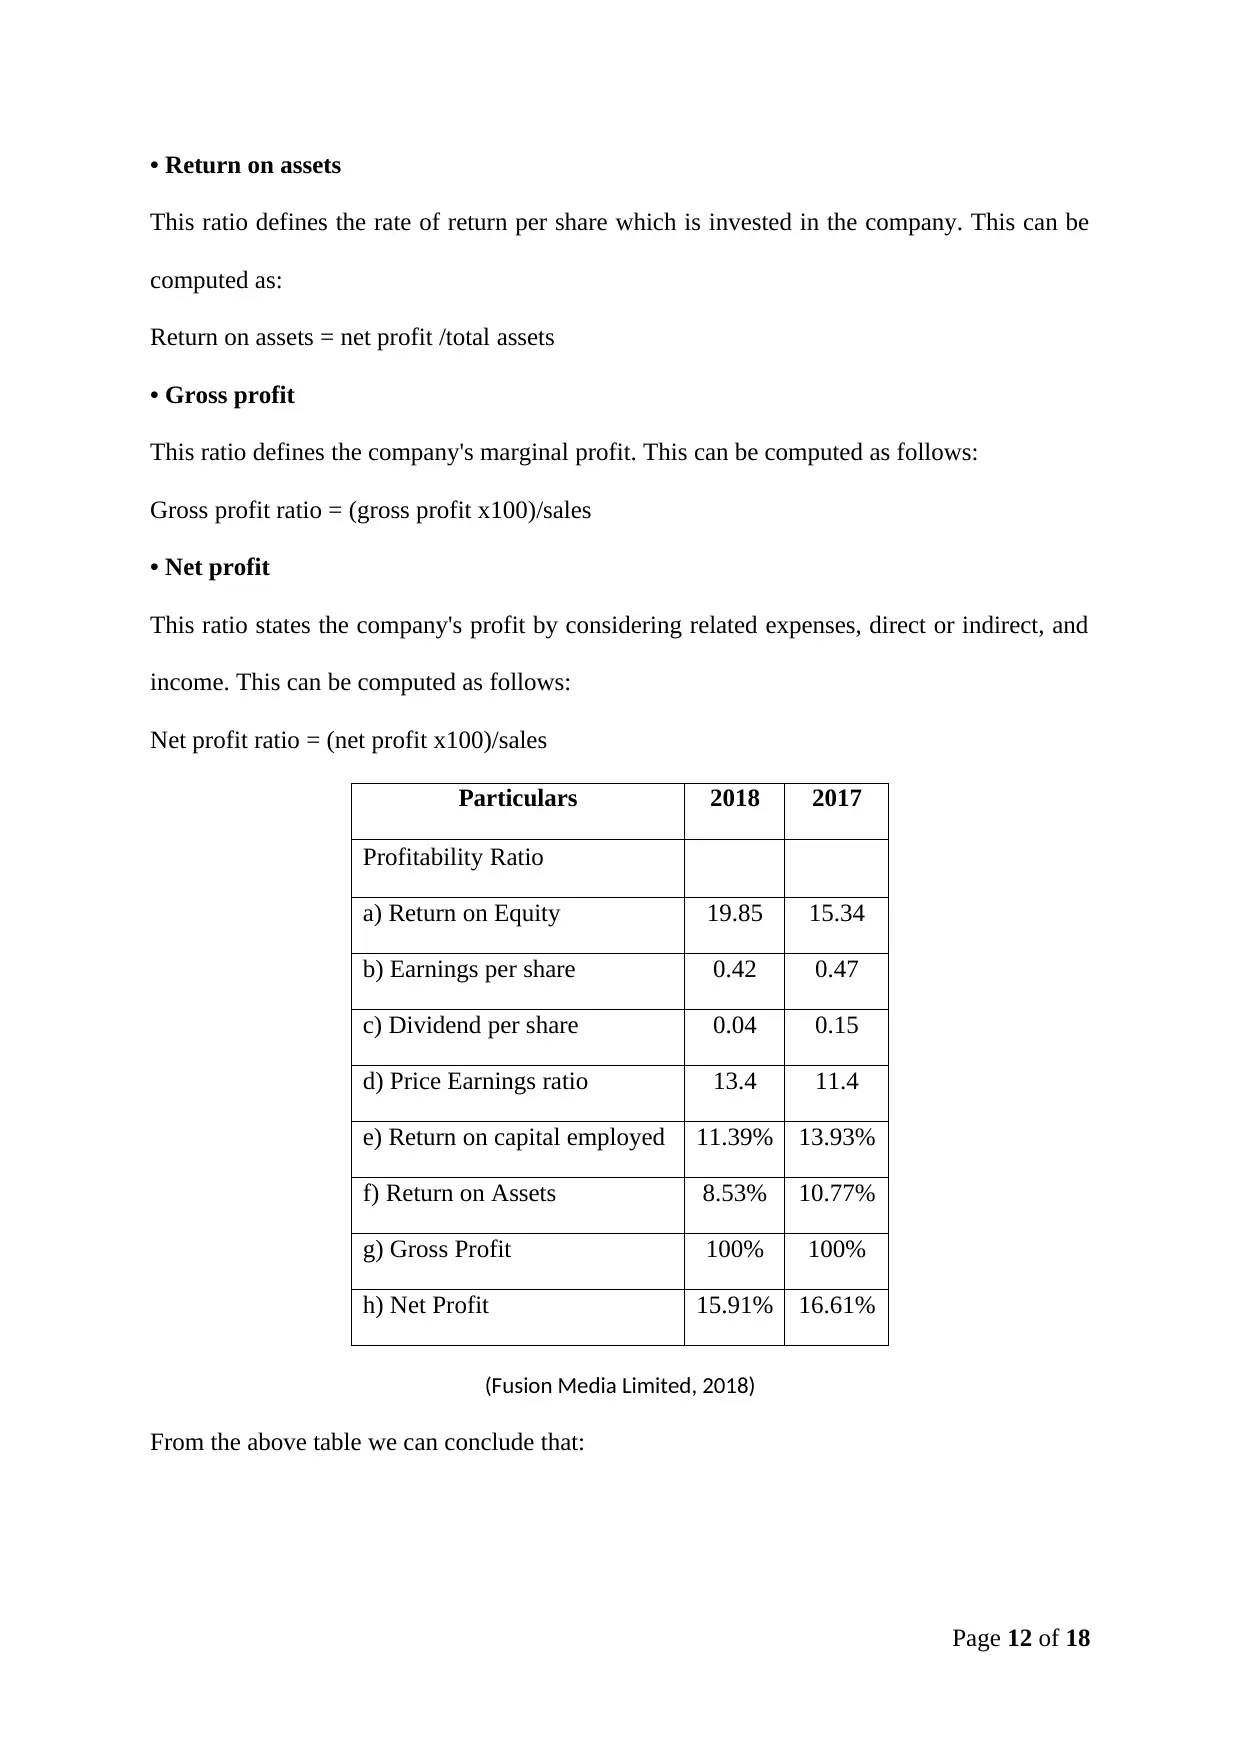
• Return on assets
This ratio defines the rate of return per share which is invested in the company. This can be
computed as:
Return on assets = net profit /total assets
• Gross profit
This ratio defines the company's marginal profit. This can be computed as follows:
Gross profit ratio = (gross profit x100)/sales
• Net profit
This ratio states the company's profit by considering related expenses, direct or indirect, and
income. This can be computed as follows:
Net profit ratio = (net profit x100)/sales
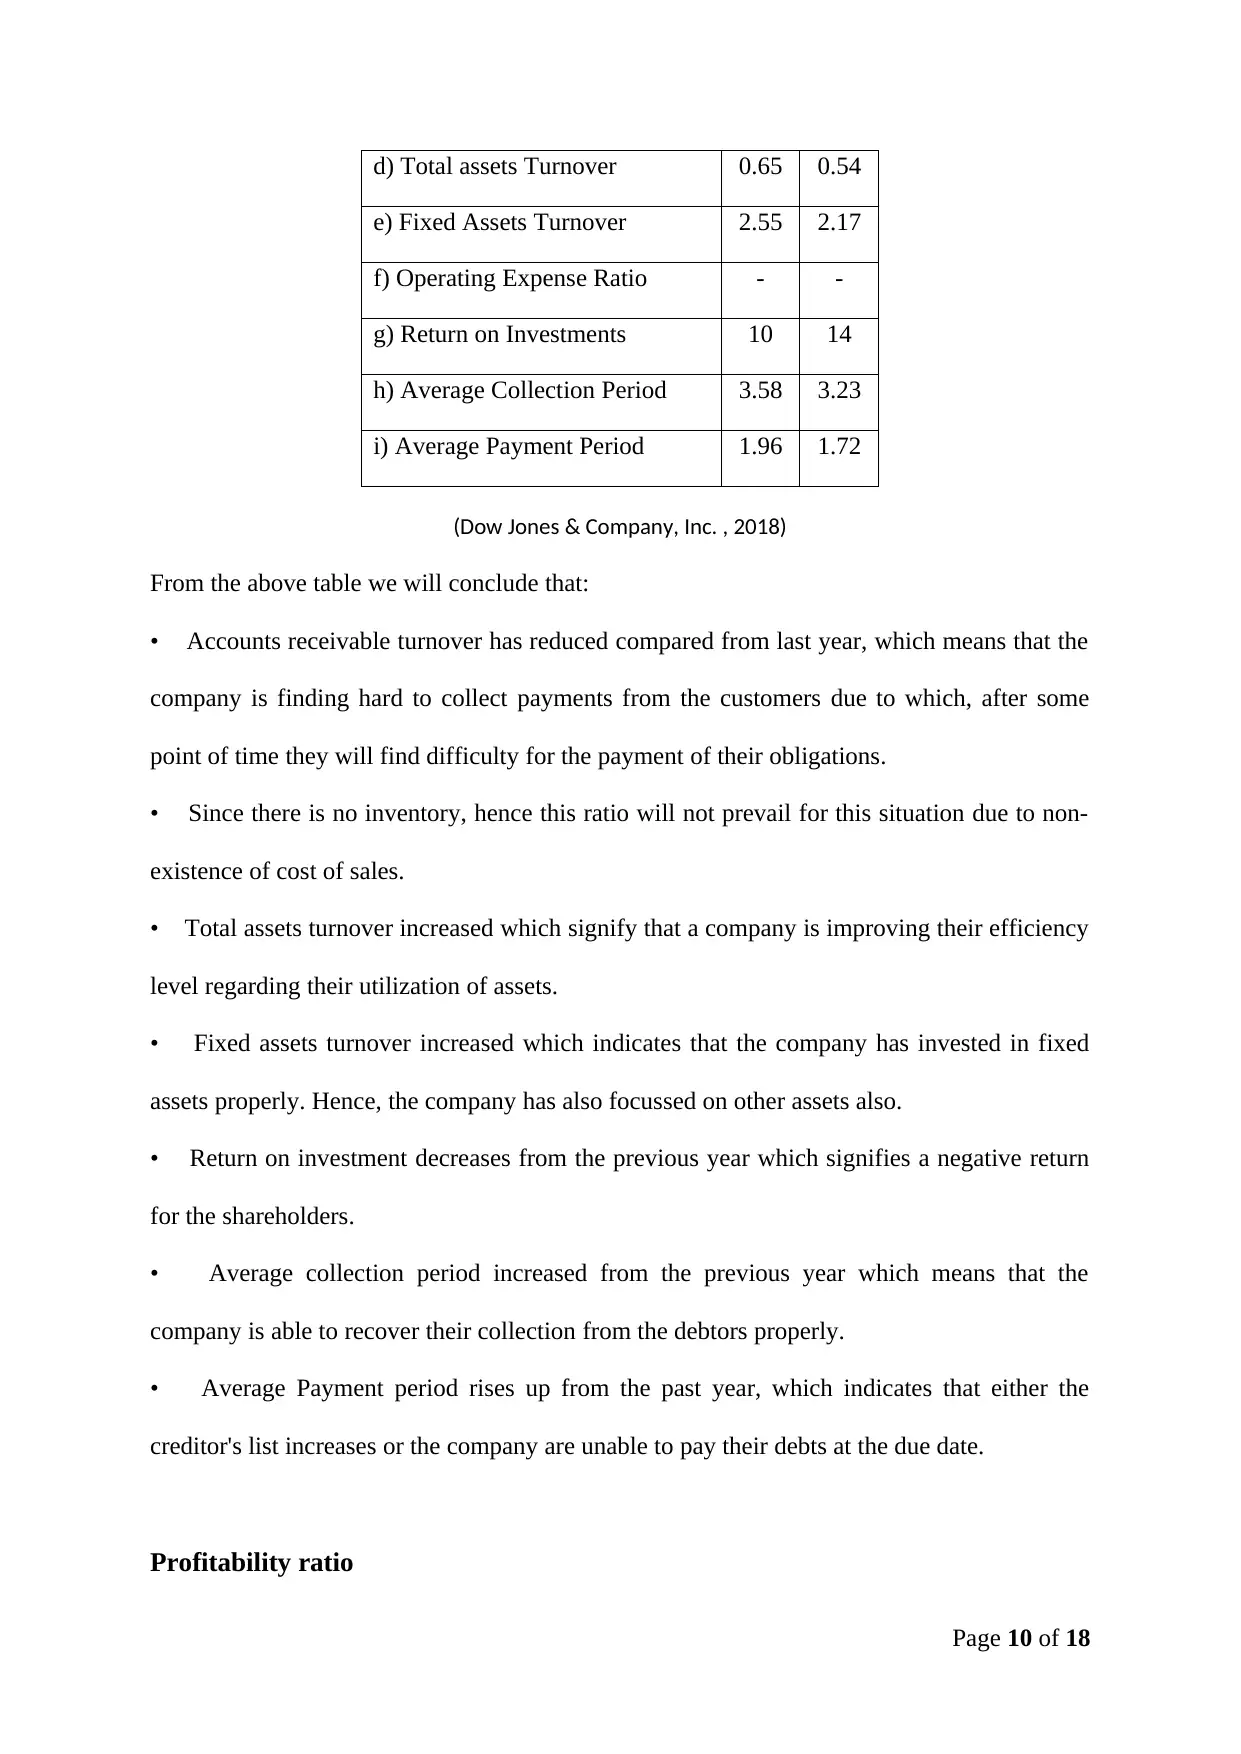
Particulars 2018 2017
Profitability Ratio
a) Return on Equity 19.85 15.34
b) Earnings per share 0.42 0.47
c) Dividend per share 0.04 0.15
d) Price Earnings ratio 13.4 11.4
e) Return on capital employed 11.39% 13.93%
f) Return on Assets 8.53% 10.77%
g) Gross Profit 100% 100%
h) Net Profit 15.91% 16.61%
(Fusion Media Limited, 2018)
From the above table we can conclude that:
Page 12 of 18
This ratio defines the rate of return per share which is invested in the company. This can be
computed as:
Return on assets = net profit /total assets
• Gross profit
This ratio defines the company's marginal profit. This can be computed as follows:
Gross profit ratio = (gross profit x100)/sales
• Net profit
This ratio states the company's profit by considering related expenses, direct or indirect, and
income. This can be computed as follows:
Net profit ratio = (net profit x100)/sales
Particulars 2018 2017
Profitability Ratio
a) Return on Equity 19.85 15.34
b) Earnings per share 0.42 0.47
c) Dividend per share 0.04 0.15
d) Price Earnings ratio 13.4 11.4
e) Return on capital employed 11.39% 13.93%
f) Return on Assets 8.53% 10.77%
g) Gross Profit 100% 100%
h) Net Profit 15.91% 16.61%
(Fusion Media Limited, 2018)
From the above table we can conclude that:
Page 12 of 18
⊘ This is a preview!⊘
Do you want full access?
Subscribe today to unlock all pages.
Trusted by 1+ million students worldwide
1 out of 18
Related Documents


Your All-in-One AI-Powered Toolkit for Academic Success.
+13062052269
info@desklib.com
Available 24*7 on WhatsApp / Email
![[object Object]](/_next/static/media/star-bottom.7253800d.svg)
Unlock your academic potential
Copyright © 2020–2026 A2Z Services. All Rights Reserved. Developed and managed by ZUCOL.