Financial Analysis of TPG Telecom Limited: Performance Report
VerifiedAdded on 2023/01/12
|13
|3693
|46
Report
AI Summary
This report presents a financial analysis of TPG Telecom Limited, an Australian telecommunications company. It begins with an introduction to financial management and its application to TPG Telecom. The report analyzes the company's financial performance using profitability, liquidity, and efficiency ratios, evaluating its financial health and position. It covers key financial metrics, including return on capital employed, return on equity, gross profit margin, and net profit margin, assessing the company's ability to generate profits and manage its resources effectively. The report also explores the impact of political and competitive environments, ethical considerations during insolvency, and external factors affecting the organization. Recommendations are provided based on the analysis, offering insights into TPG Telecom's financial strategies and performance. The analysis utilizes financial statements from 2018 and 2019 to provide a comprehensive overview of the company's financial standing.

FINANCIAL MANAGEMENT
(TPG)
(TPG)
Paraphrase This Document
Need a fresh take? Get an instant paraphrase of this document with our AI Paraphraser
TABLE OF CONTENTS
TABLE OF CONTENTS................................................................................................................2
INTRODUCTION...........................................................................................................................1
REPORT..........................................................................................................................................1
TPG Telecom Limited.................................................................................................................1
Financial Analysis of TPG Telecom Limited..............................................................................1
Profitability Ratios.......................................................................................................................2
Liquidity Ratio.............................................................................................................................5
Efficiency Ratios.........................................................................................................................6
Capital Structure..........................................................................................................................7
Impact of political impact over the business...............................................................................8
Ethical consideration when organisation becomes insolvent......................................................9
External factors to be considered by the organisation.................................................................9
CONCLUSION & RECOMMENDTION.......................................................................................9
REFERENCES..............................................................................................................................11
INTRODUCTION
Financial management refers to planning, organising, directing and controlling financial
activities like the procurement and utilisation of the financial resources of the company. This
refers to application of principles of the general management for financial management in the
company. It helps the business in taking various business decisions such as investment,
procurement of funds and the management of existing financial resources of the company.
Report is based on the case study of TPG Telecom which is an Australian
telecommunication and IT company. It will provide the application of various theories and
principles of the financial management. This will provide the use of financial statements in
analysing the financial health and position of the company. Report will also cover the impact of
political and competitive environment on the company. Ethical consideration when organisation
becomes insolvent is also covered in the study. There are number of external factors that are
required to be taken into consideration by the organisation. Research will enhance the
understanding of the various concepts of the financial management
REPORT
TPG Telecom Limited
It is an Australian IT and telecommunication company specialising in the consumer as well
as business internet services and mobile telephone services. As August 2015, it became the 2n
largest service provider for internet in Australia and is also biggest virtual network mobile
operator. Company is formed by merger of Total Peripherals Group and SP Telemedia in year
2008. TPG is providing five ranges of the product and services which are networking, internet
access, cell phone services, OEM services and accounting software. Company has faced a
lawsuit in year 2010 by Australian Competition and Consumer Commission
Financial Analysis of TPG Telecom Limited
The performance of the company during the year has been significant. Company is
achieving and excellence in the sector from years. It has become the 2nd largest internet service
provider of Australia. Company had earned total revenues of 2434 million in 2019, operating
income of 327 million and net income of 277.1 million. The net assets of company as the year
ending 2019 were 2962.7. Company has seen a decline in the profitability and returns from the
last year due to non monetary items which are impairment of spectrum & mobile assets and
1
⊘ This is a preview!⊘
Do you want full access?
Subscribe today to unlock all pages.
Trusted by 1+ million students worldwide
amortisation of the intangibles. However company has efficiently managed to maintain the
revenue levels.
Ratio Analysis
The financial position of the company is analysed by the company using ratio analysis tool.
It is focused over assessing the internal functioning of the organisation. Ratio analysis helps the
company in analysing the efficiency of the company in managing its resources and generating
adequate returns using effective corporate strategies. It helps the investors in analysing the option
of investments. They can identify whether the organisation will be profitable in the long run or
not. This helps the business in making the right choices between the organisations operating in
the market for investing their funds
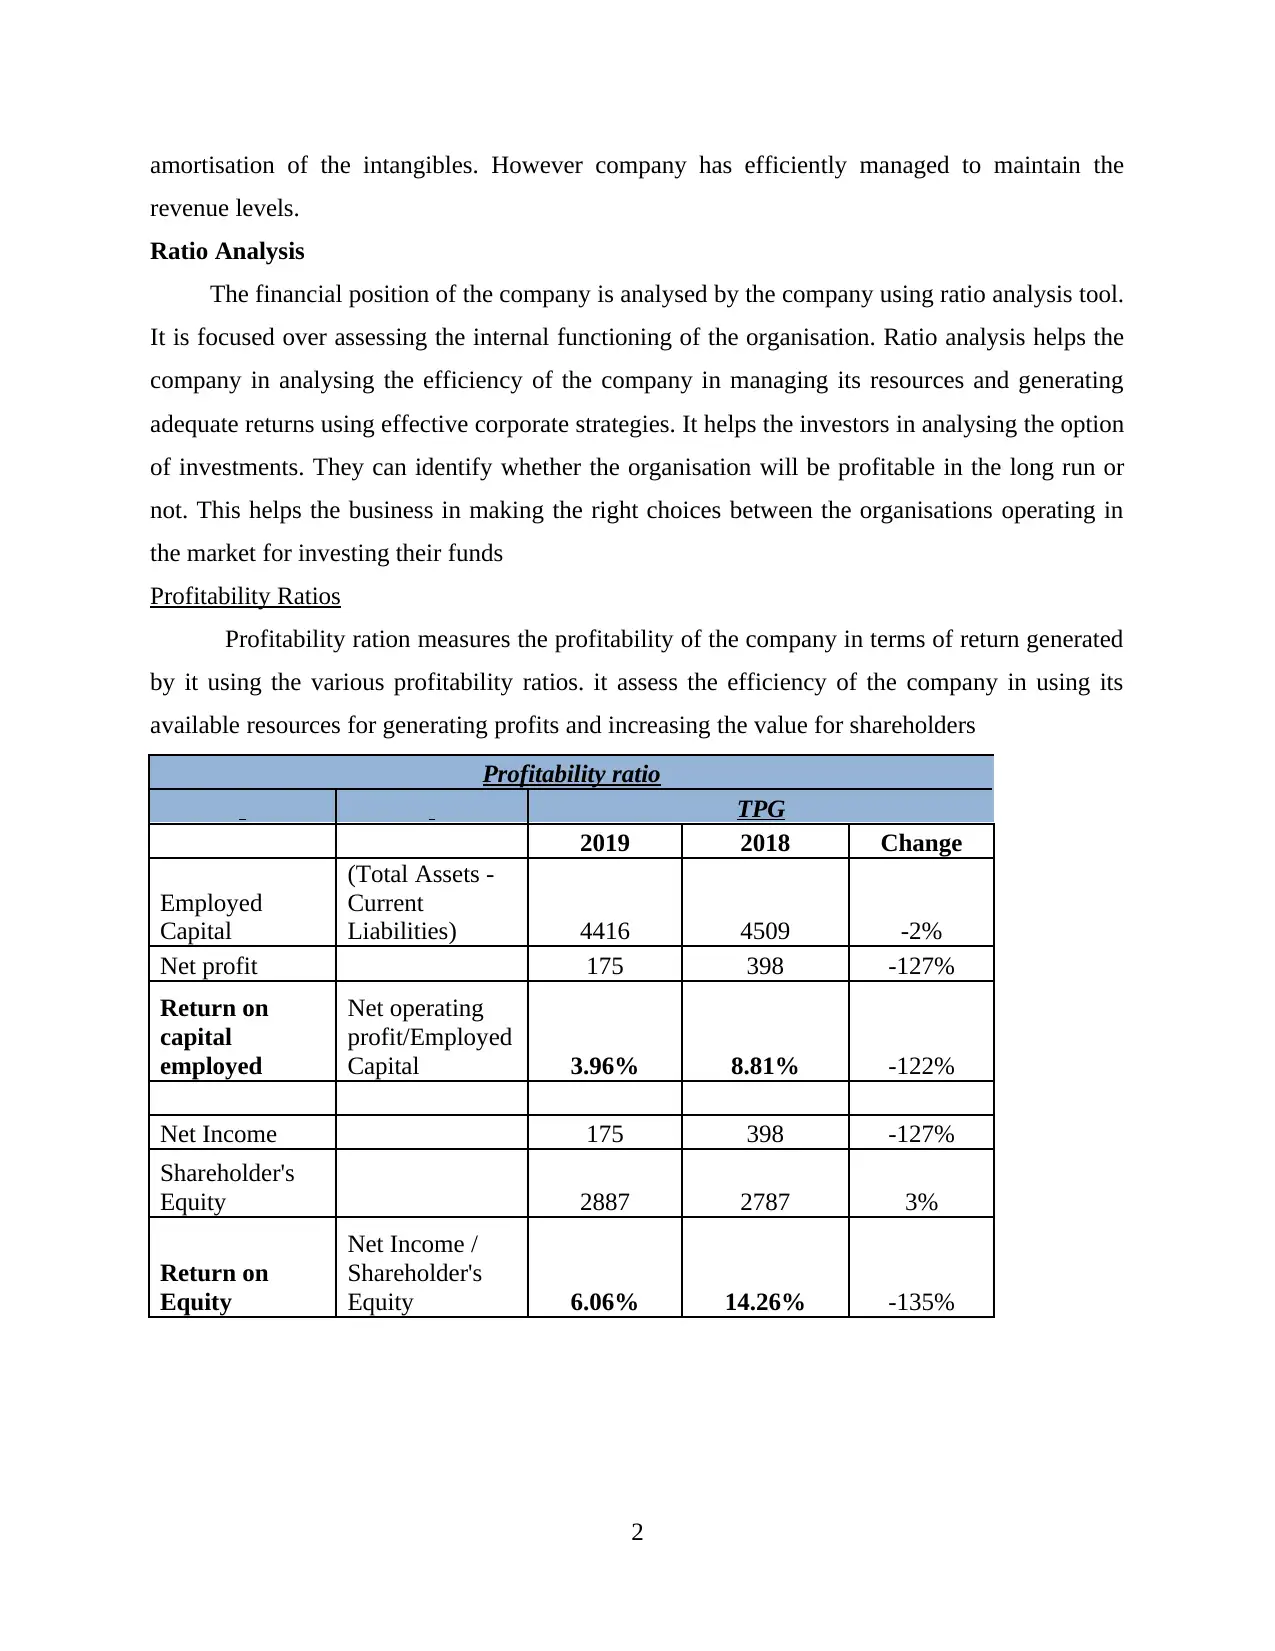
Profitability Ratios
Profitability ration measures the profitability of the company in terms of return generated
by it using the various profitability ratios. it assess the efficiency of the company in using its
available resources for generating profits and increasing the value for shareholders
Profitability ratio
TPG
2019 2018 Change
Employed
Capital
(Total Assets -
Current
Liabilities) 4416 4509 -2%
Net profit 175 398 -127%
Return on
capital
employed
Net operating
profit/Employed
Capital 3.96% 8.81% -122%
Net Income 175 398 -127%
Shareholder's
Equity 2887 2787 3%
Return on
Equity
Net Income /
Shareholder's
Equity 6.06% 14.26% -135%
2
revenue levels.
Ratio Analysis
The financial position of the company is analysed by the company using ratio analysis tool.
It is focused over assessing the internal functioning of the organisation. Ratio analysis helps the
company in analysing the efficiency of the company in managing its resources and generating
adequate returns using effective corporate strategies. It helps the investors in analysing the option
of investments. They can identify whether the organisation will be profitable in the long run or
not. This helps the business in making the right choices between the organisations operating in
the market for investing their funds
Profitability Ratios
Profitability ration measures the profitability of the company in terms of return generated
by it using the various profitability ratios. it assess the efficiency of the company in using its
available resources for generating profits and increasing the value for shareholders
Profitability ratio
TPG
2019 2018 Change
Employed
Capital
(Total Assets -
Current
Liabilities) 4416 4509 -2%
Net profit 175 398 -127%
Return on
capital
employed
Net operating
profit/Employed
Capital 3.96% 8.81% -122%
Net Income 175 398 -127%
Shareholder's
Equity 2887 2787 3%
Return on
Equity
Net Income /
Shareholder's
Equity 6.06% 14.26% -135%
2
Paraphrase This Document
Need a fresh take? Get an instant paraphrase of this document with our AI Paraphraser
Return on capital employed
Return on capital employed shows the return generated by company by using its existing
financial resources. ROCE of TPG has decreased to 3.96% in 2019 from 8.81% in year 2018.
There has been a significant decline in the return of the company from last year. ROCE has
moved downward with 122%. The significant decline in the returns is due to the decrease in
profits levels from last year. This shows that even after making effective utilisation of the
existing resources the return has gone down. ROCE of the company should be high it shows that
the company is capable of utilising the assets in the most efficient manner (Shapiro and
Hanouna, 2019). It could be seen that the company using the existing resources but the
amortisation of the spectrum and intangibles has decreased the ratio. Company should take
further measures for increasing the returns over capital. It should write off the unproductive
assets of the company.
Return on Equity
It measures the return generated by the company over its equity capital. Equity capital is
the shareholder’s investment in the company. Return on equity of company is 6.06 % which has
decreased by 135% from the last year. Return on equity shows that the shareholder’s have earned
a return of 6.06 over their investments. ROE of the company should be high where of company
is also high from the last. The return is required to be maintained by the company as it directly
impacts the market cap of the firm. Investors tend to move their investments towards more
profitable companies. However it could be identified that decrease is not seen due to the
increased costs or expenses but due to non monetary expenses.
It is the key ratio that is analysed by the investors for making investments. The foremost
motive of the investors is earning return over their investments along with maximising the wealth
of the shareholders. Investors do not invest in companies with low return overt their equity and
also the wealth is not maximised by investing their shares. It could be noted that the wealth is
maximised by the increase in share prices that are directly linked with the profitability and
returns over company (Madura, 2020). Company should plan its strategies keeping in mind the
returns to the shareholders.
3
TPG
2019 2018 Change
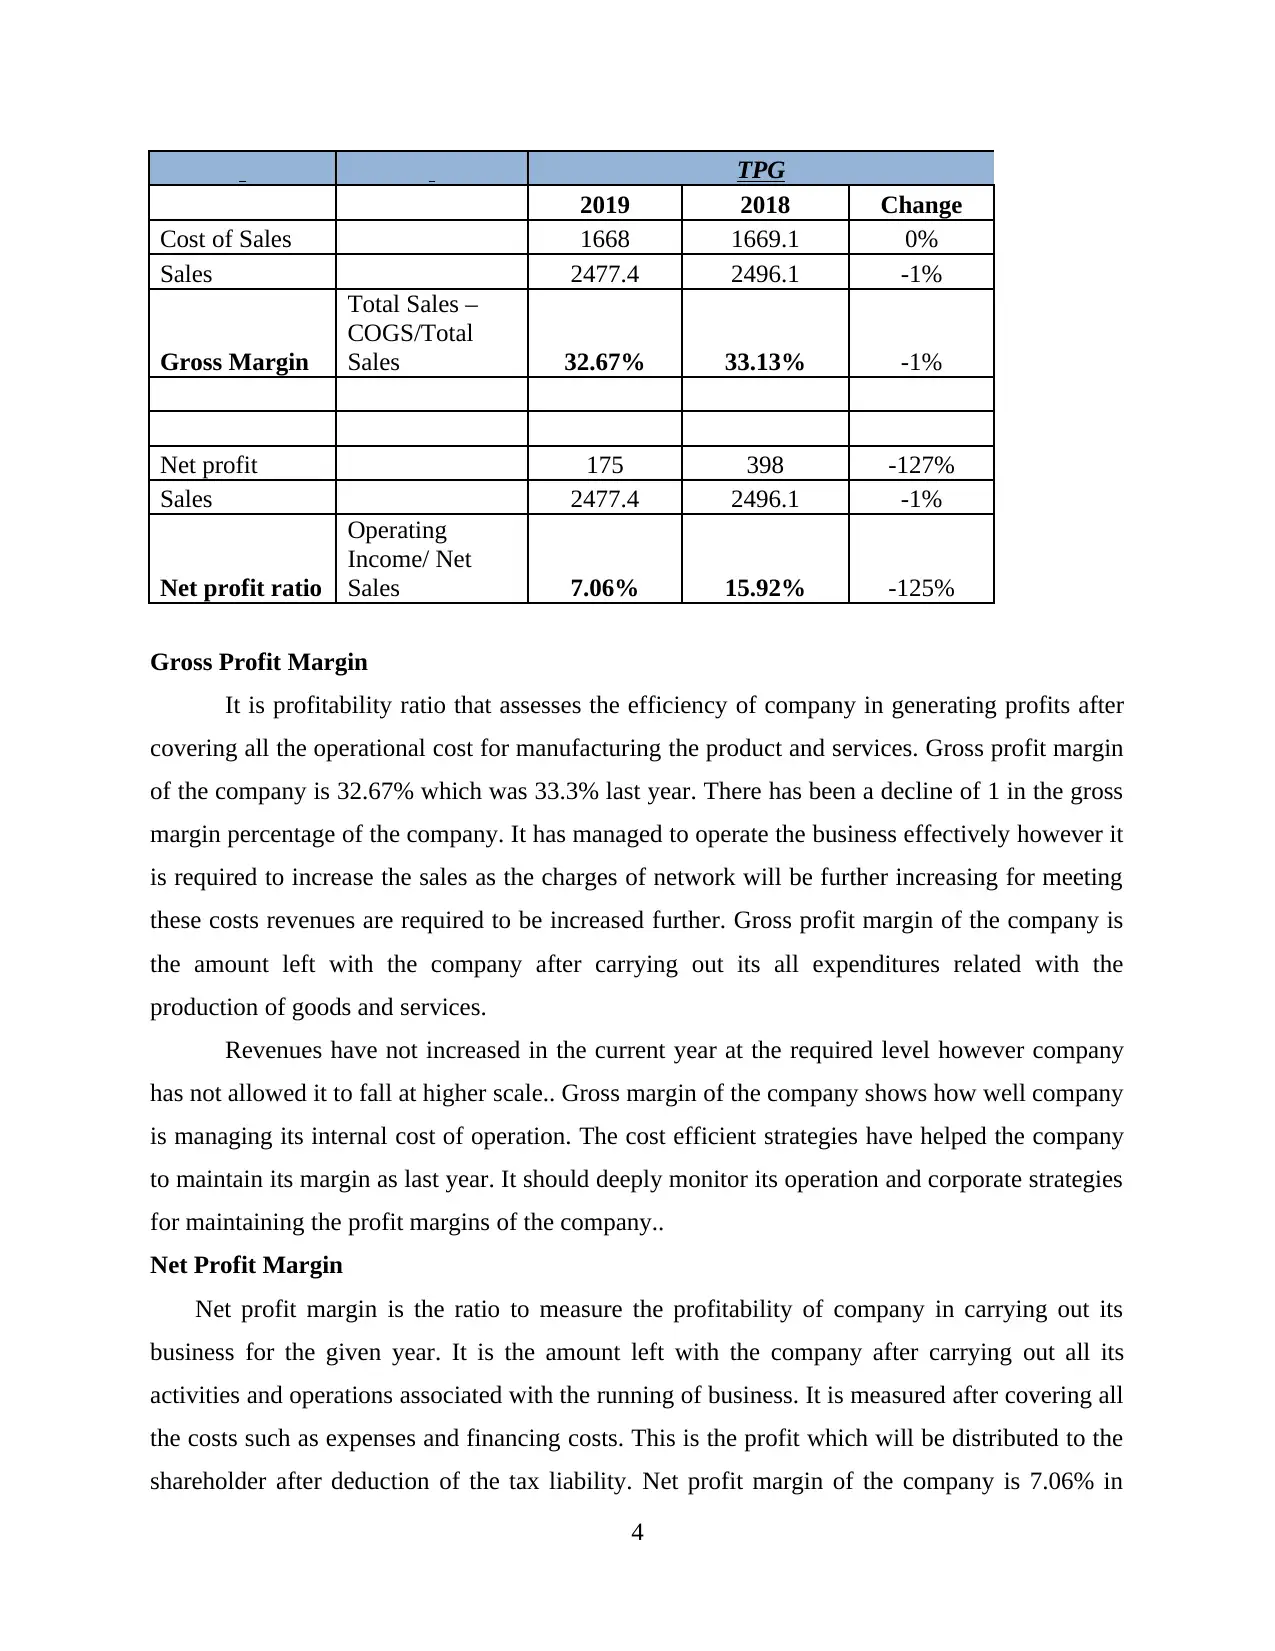
Cost of Sales 1668 1669.1 0%
Sales 2477.4 2496.1 -1%
Gross Margin
Total Sales –
COGS/Total
Sales 32.67% 33.13% -1%
Net profit 175 398 -127%
Sales 2477.4 2496.1 -1%
Net profit ratio
Operating
Income/ Net
Sales 7.06% 15.92% -125%
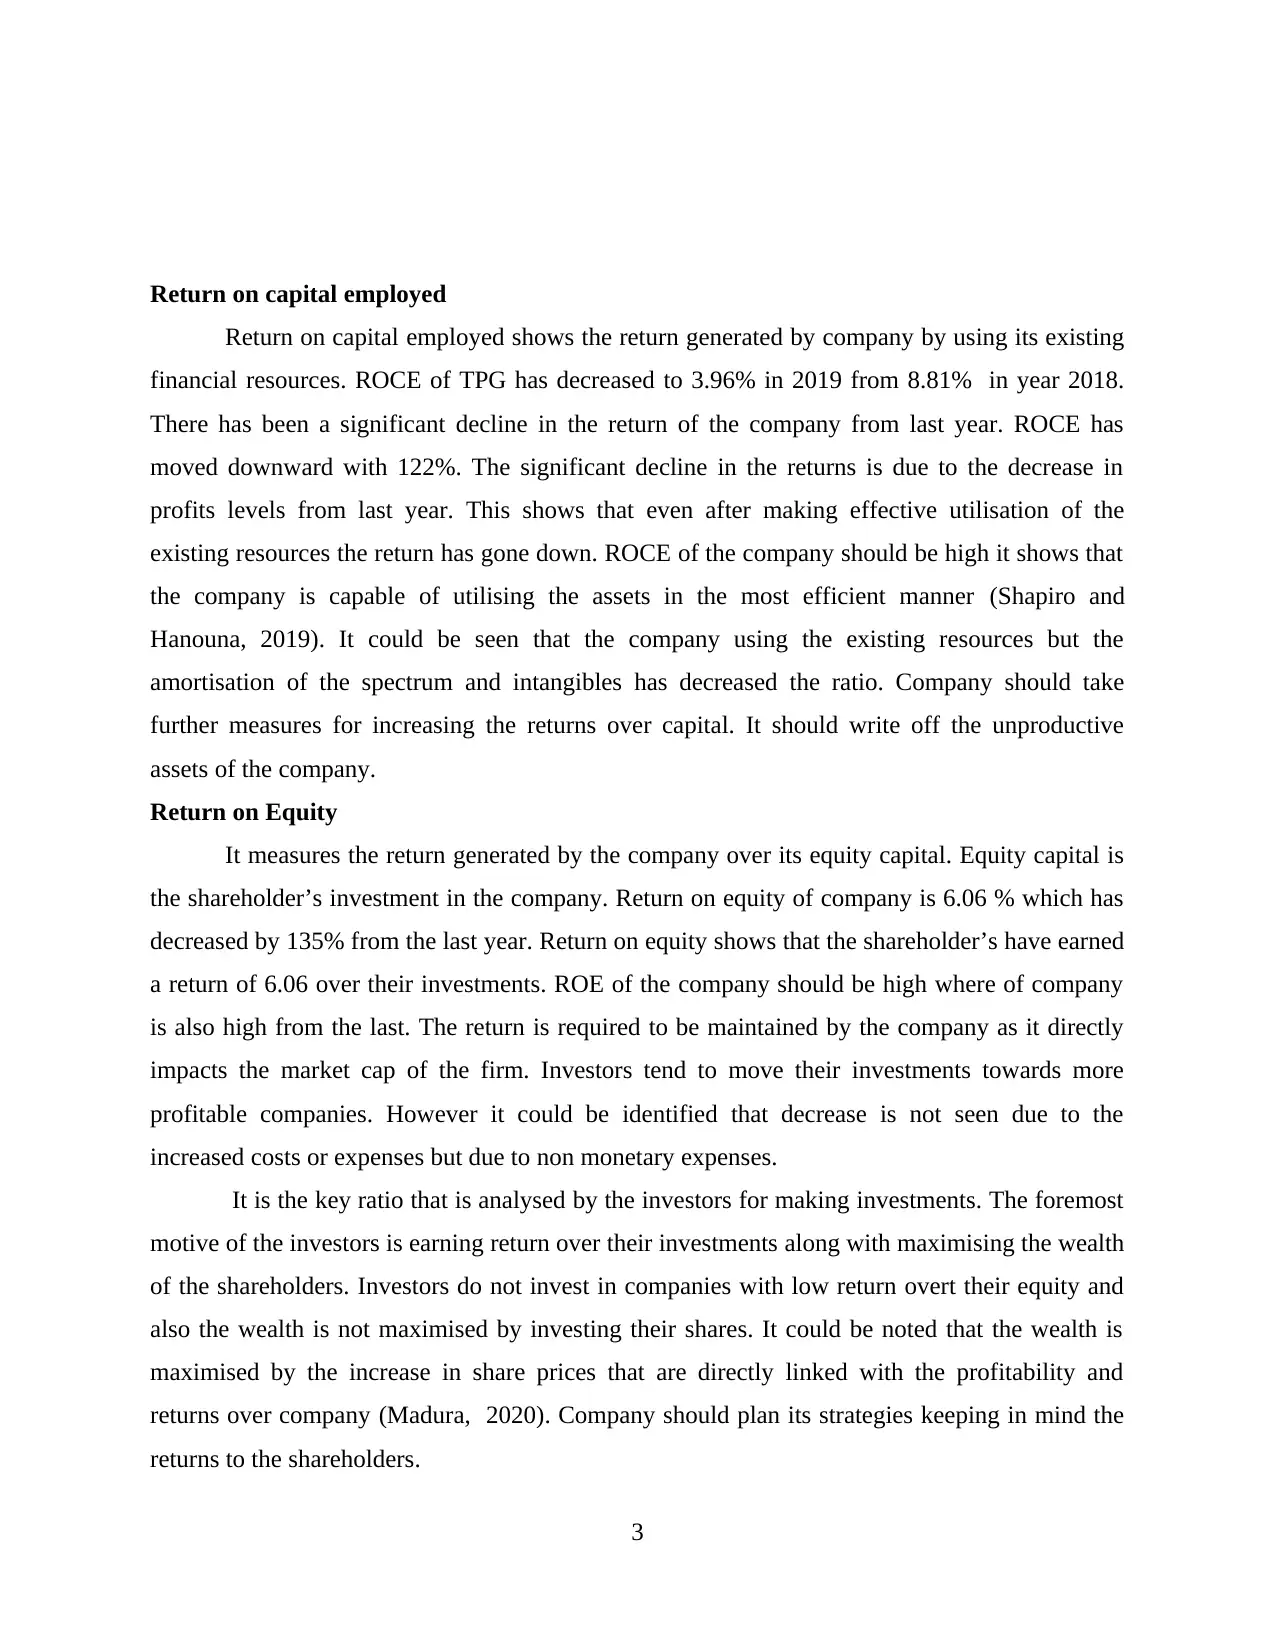
Gross Profit Margin
It is profitability ratio that assesses the efficiency of company in generating profits after
covering all the operational cost for manufacturing the product and services. Gross profit margin
of the company is 32.67% which was 33.3% last year. There has been a decline of 1 in the gross
margin percentage of the company. It has managed to operate the business effectively however it
is required to increase the sales as the charges of network will be further increasing for meeting
these costs revenues are required to be increased further. Gross profit margin of the company is
the amount left with the company after carrying out its all expenditures related with the
production of goods and services.
Revenues have not increased in the current year at the required level however company
has not allowed it to fall at higher scale.. Gross margin of the company shows how well company
is managing its internal cost of operation. The cost efficient strategies have helped the company
to maintain its margin as last year. It should deeply monitor its operation and corporate strategies
for maintaining the profit margins of the company..
Net Profit Margin
Net profit margin is the ratio to measure the profitability of company in carrying out its
business for the given year. It is the amount left with the company after carrying out all its
activities and operations associated with the running of business. It is measured after covering all
the costs such as expenses and financing costs. This is the profit which will be distributed to the
shareholder after deduction of the tax liability. Net profit margin of the company is 7.06% in
4
2019 2018 Change
Cost of Sales 1668 1669.1 0%
Sales 2477.4 2496.1 -1%
Gross Margin
Total Sales –
COGS/Total
Sales 32.67% 33.13% -1%
Net profit 175 398 -127%
Sales 2477.4 2496.1 -1%
Net profit ratio
Operating
Income/ Net
Sales 7.06% 15.92% -125%
Gross Profit Margin
It is profitability ratio that assesses the efficiency of company in generating profits after
covering all the operational cost for manufacturing the product and services. Gross profit margin
of the company is 32.67% which was 33.3% last year. There has been a decline of 1 in the gross
margin percentage of the company. It has managed to operate the business effectively however it
is required to increase the sales as the charges of network will be further increasing for meeting
these costs revenues are required to be increased further. Gross profit margin of the company is
the amount left with the company after carrying out its all expenditures related with the
production of goods and services.
Revenues have not increased in the current year at the required level however company
has not allowed it to fall at higher scale.. Gross margin of the company shows how well company
is managing its internal cost of operation. The cost efficient strategies have helped the company
to maintain its margin as last year. It should deeply monitor its operation and corporate strategies
for maintaining the profit margins of the company..
Net Profit Margin
Net profit margin is the ratio to measure the profitability of company in carrying out its
business for the given year. It is the amount left with the company after carrying out all its
activities and operations associated with the running of business. It is measured after covering all
the costs such as expenses and financing costs. This is the profit which will be distributed to the
shareholder after deduction of the tax liability. Net profit margin of the company is 7.06% in
4
⊘ This is a preview!⊘
Do you want full access?
Subscribe today to unlock all pages.
Trusted by 1+ million students worldwide
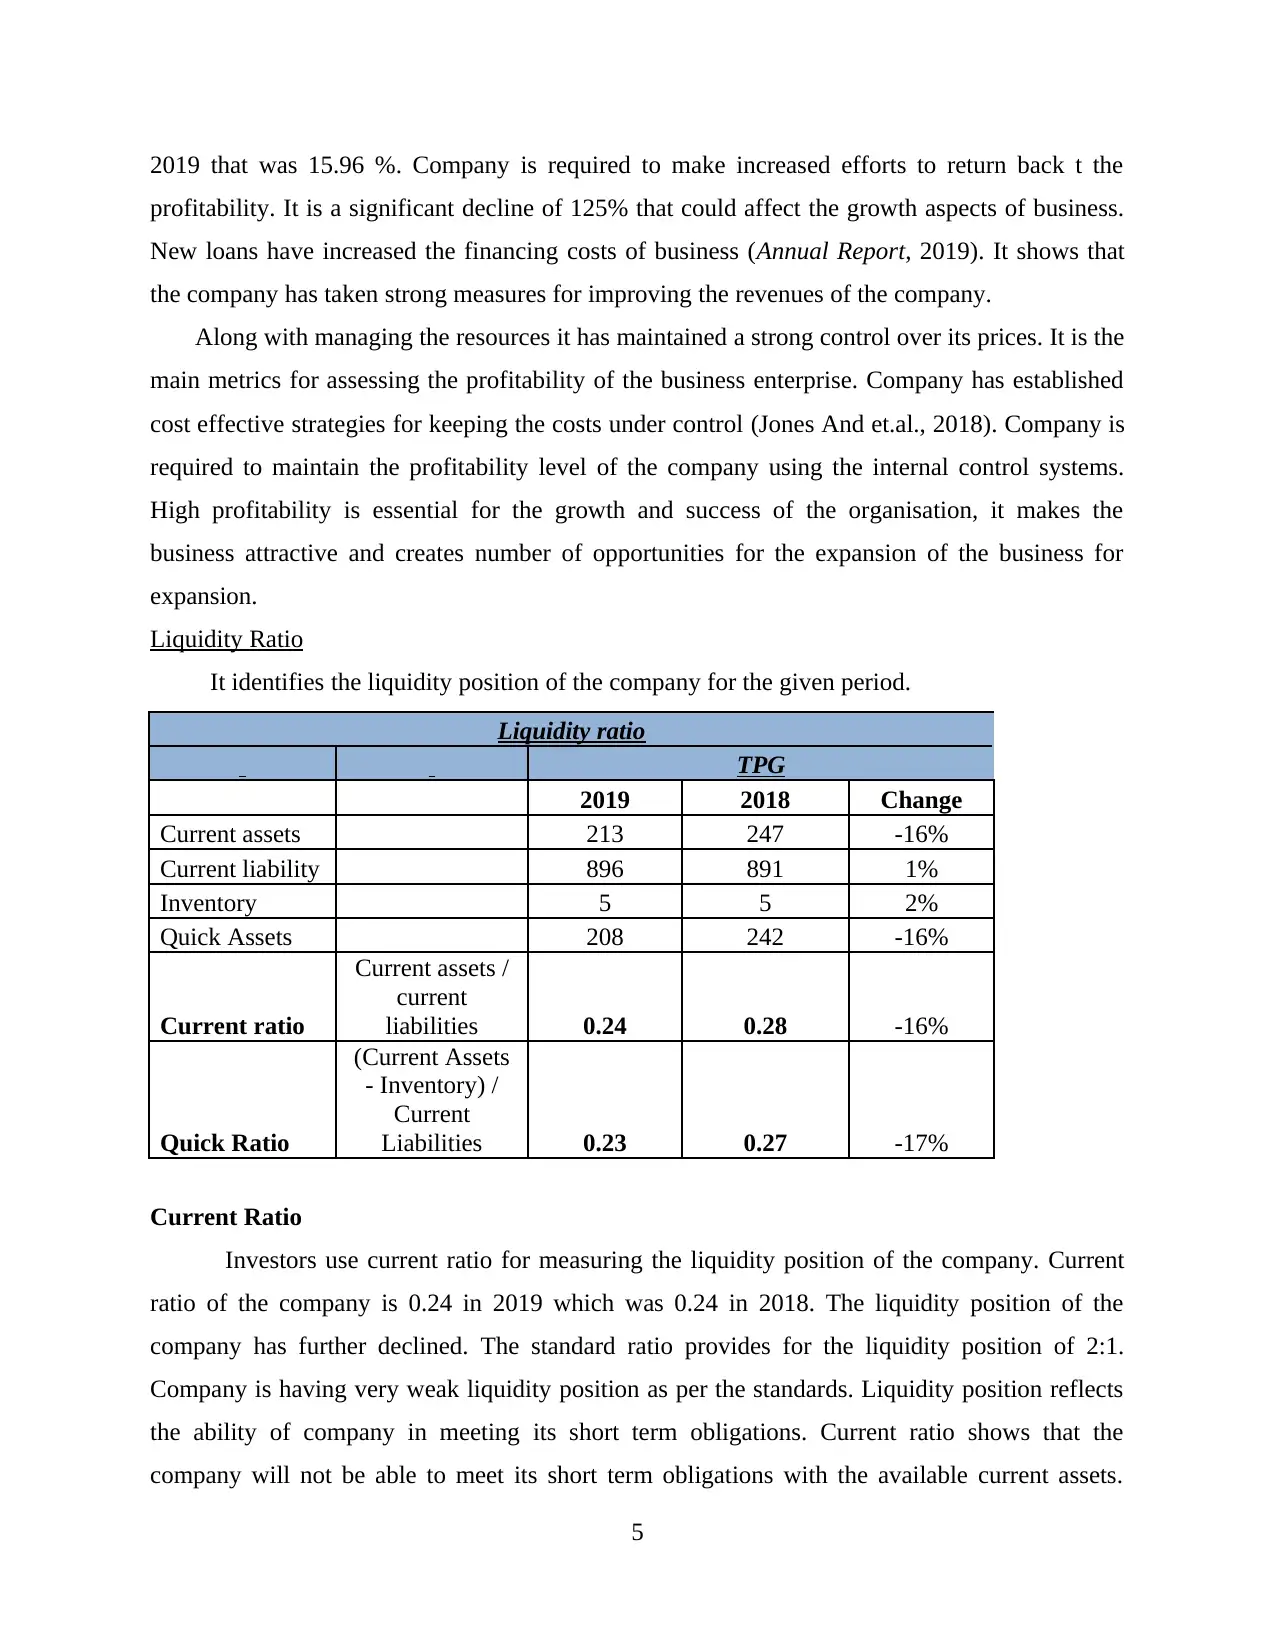
2019 that was 15.96 %. Company is required to make increased efforts to return back t the
profitability. It is a significant decline of 125% that could affect the growth aspects of business.
New loans have increased the financing costs of business (Annual Report, 2019). It shows that
the company has taken strong measures for improving the revenues of the company.
Along with managing the resources it has maintained a strong control over its prices. It is the
main metrics for assessing the profitability of the business enterprise. Company has established
cost effective strategies for keeping the costs under control (Jones And et.al., 2018). Company is
required to maintain the profitability level of the company using the internal control systems.
High profitability is essential for the growth and success of the organisation, it makes the
business attractive and creates number of opportunities for the expansion of the business for
expansion.
Liquidity Ratio
It identifies the liquidity position of the company for the given period.
Liquidity ratio
TPG
2019 2018 Change
Current assets 213 247 -16%
Current liability 896 891 1%
Inventory 5 5 2%
Quick Assets 208 242 -16%
Current ratio
Current assets /
current
liabilities 0.24 0.28 -16%
Quick Ratio
(Current Assets
- Inventory) /
Current
Liabilities 0.23 0.27 -17%
Current Ratio
Investors use current ratio for measuring the liquidity position of the company. Current
ratio of the company is 0.24 in 2019 which was 0.24 in 2018. The liquidity position of the
company has further declined. The standard ratio provides for the liquidity position of 2:1.
Company is having very weak liquidity position as per the standards. Liquidity position reflects
the ability of company in meeting its short term obligations. Current ratio shows that the
company will not be able to meet its short term obligations with the available current assets.
5
Paraphrase This Document
Need a fresh take? Get an instant paraphrase of this document with our AI Paraphraser
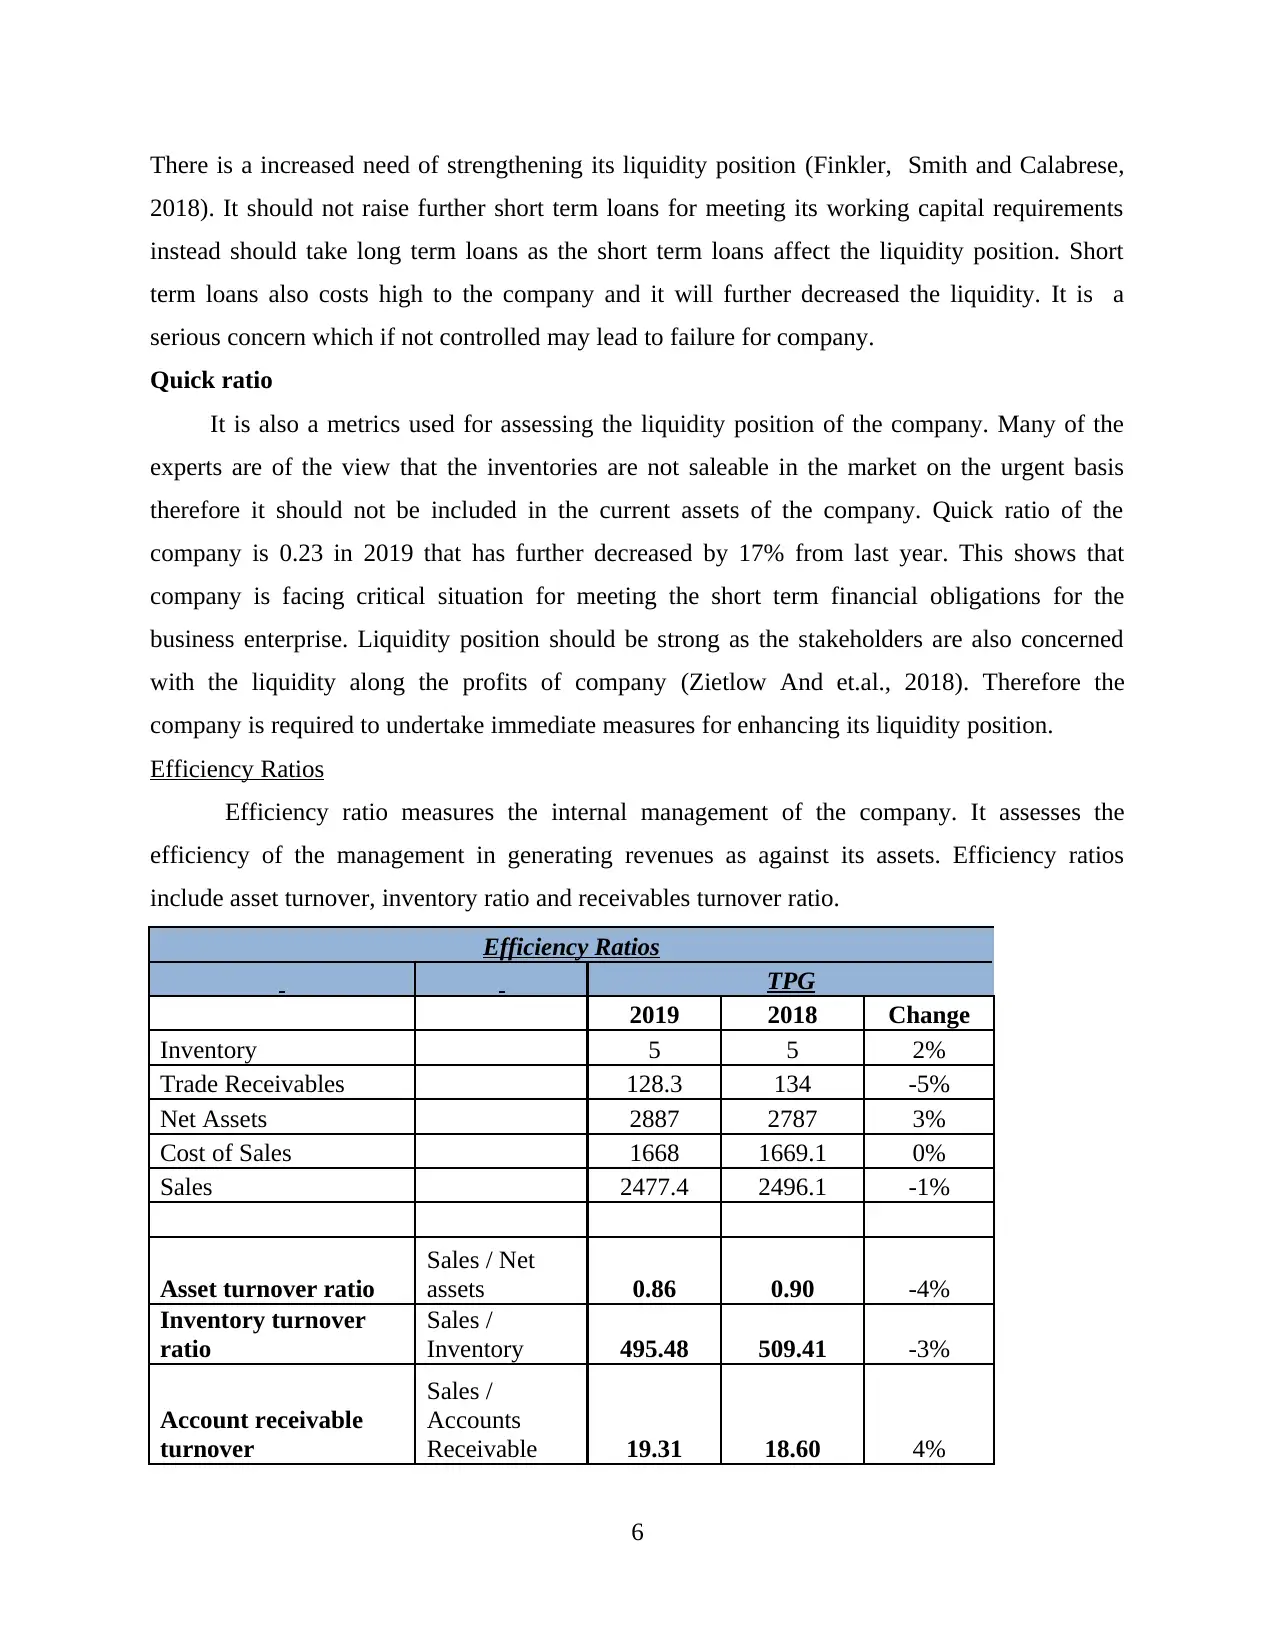
There is a increased need of strengthening its liquidity position (Finkler, Smith and Calabrese,
2018). It should not raise further short term loans for meeting its working capital requirements
instead should take long term loans as the short term loans affect the liquidity position. Short
term loans also costs high to the company and it will further decreased the liquidity. It is a
serious concern which if not controlled may lead to failure for company.
Quick ratio
It is also a metrics used for assessing the liquidity position of the company. Many of the
experts are of the view that the inventories are not saleable in the market on the urgent basis
therefore it should not be included in the current assets of the company. Quick ratio of the
company is 0.23 in 2019 that has further decreased by 17% from last year. This shows that
company is facing critical situation for meeting the short term financial obligations for the
business enterprise. Liquidity position should be strong as the stakeholders are also concerned
with the liquidity along the profits of company (Zietlow And et.al., 2018). Therefore the
company is required to undertake immediate measures for enhancing its liquidity position.
Efficiency Ratios
Efficiency ratio measures the internal management of the company. It assesses the
efficiency of the management in generating revenues as against its assets. Efficiency ratios
include asset turnover, inventory ratio and receivables turnover ratio.
Efficiency Ratios
TPG
2019 2018 Change
Inventory 5 5 2%
Trade Receivables 128.3 134 -5%
Net Assets 2887 2787 3%
Cost of Sales 1668 1669.1 0%
Sales 2477.4 2496.1 -1%
Asset turnover ratio
Sales / Net
assets 0.86 0.90 -4%
Inventory turnover
ratio
Sales /
Inventory 495.48 509.41 -3%
Account receivable
turnover
Sales /
Accounts
Receivable 19.31 18.60 4%
6
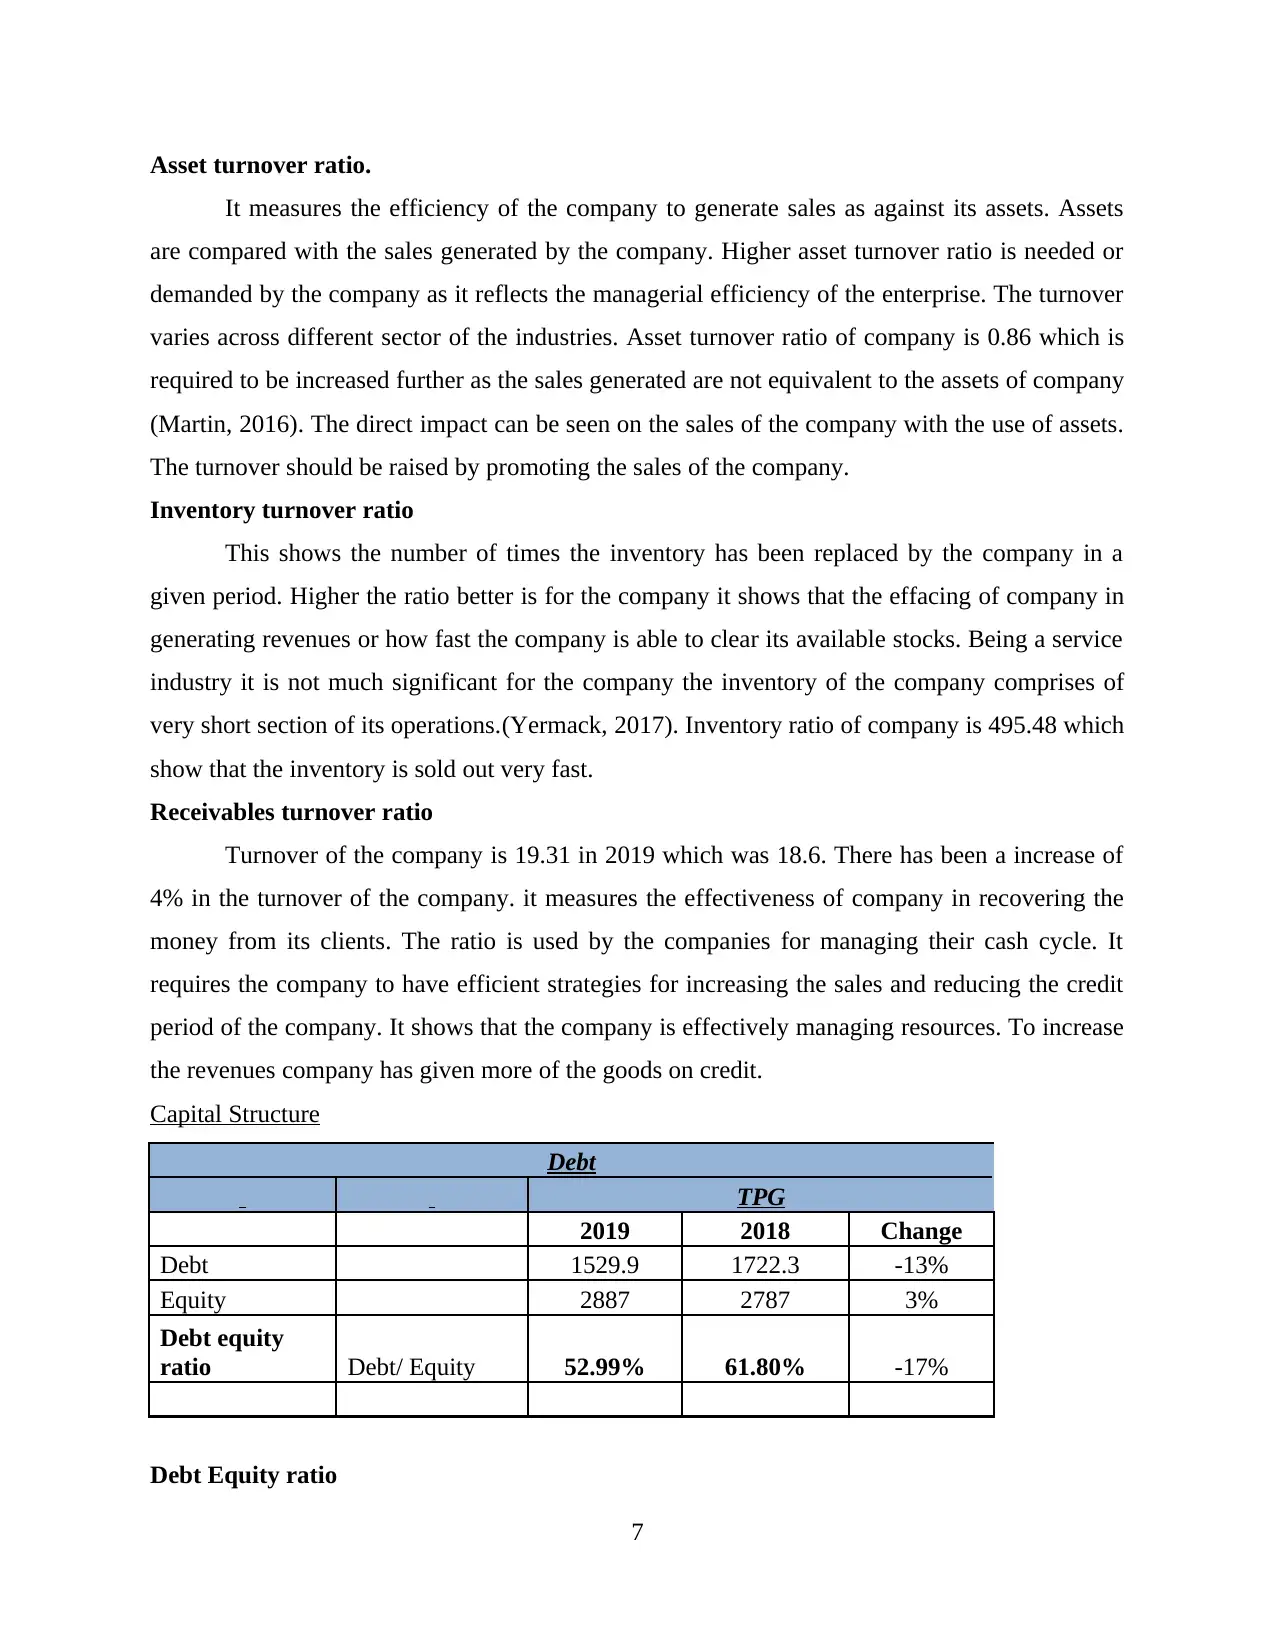
Asset turnover ratio.
It measures the efficiency of the company to generate sales as against its assets. Assets
are compared with the sales generated by the company. Higher asset turnover ratio is needed or
demanded by the company as it reflects the managerial efficiency of the enterprise. The turnover
varies across different sector of the industries. Asset turnover ratio of company is 0.86 which is
required to be increased further as the sales generated are not equivalent to the assets of company
(Martin, 2016). The direct impact can be seen on the sales of the company with the use of assets.
The turnover should be raised by promoting the sales of the company.
Inventory turnover ratio
This shows the number of times the inventory has been replaced by the company in a
given period. Higher the ratio better is for the company it shows that the effacing of company in
generating revenues or how fast the company is able to clear its available stocks. Being a service
industry it is not much significant for the company the inventory of the company comprises of
very short section of its operations.(Yermack, 2017). Inventory ratio of company is 495.48 which
show that the inventory is sold out very fast.
Receivables turnover ratio
Turnover of the company is 19.31 in 2019 which was 18.6. There has been a increase of
4% in the turnover of the company. it measures the effectiveness of company in recovering the
money from its clients. The ratio is used by the companies for managing their cash cycle. It
requires the company to have efficient strategies for increasing the sales and reducing the credit
period of the company. It shows that the company is effectively managing resources. To increase
the revenues company has given more of the goods on credit.
Capital Structure
Debt
TPG
2019 2018 Change
Debt 1529.9 1722.3 -13%
Equity 2887 2787 3%
Debt equity
ratio Debt/ Equity 52.99% 61.80% -17%
Debt Equity ratio
7
⊘ This is a preview!⊘
Do you want full access?
Subscribe today to unlock all pages.
Trusted by 1+ million students worldwide
Debt equity ratio of the company shows the capital structure of the organisation. It is used
to assess the financial risks of the company. Debt equity ratio of the company is 52.99% in year
2019 which was 61.8% in 2018. It could be seen that there has been a decline of 17% in the debt
ratio of company. Higher the debt higher is the financial risk associated with the business. A
company with high financial risks may not be beneficial for the investors in the long run. It also
reflects the capital structure of company is optimum mix which is helping to keep the cost of
capital to minimum. (Tsofa And et.al., 2017).
Using only equity may be costlier for the company as the cost of equity is higher than the
debt capital. Company is available with other benefits over the debt capital such as tax relief and
deduction under income tax for the business expanse. Company should not raise further loans as
this will raise the financial risks of the business and giving rise to liquidity concerns. Investors
tend to invest over companies that are less risky and have lower financial risks. Capital structure
of the company has long term implication over the sustainability of the business.
Impact of political impact over the business
Political factor play significant role in the operation of the business enterprise. It could
impact the smooth functioning of the company. Company is serving in the telecommunication
sector of the country and is prone to direct impact of political issues. The political environment
has proved to be beneficial for the company. Company is required to follow the regulation of
every region in which it operates. Rules and regulations of the statutory bodies have enabled the
company to expand its business.
Competitive environment of the industry is also very strong but being the second largest
Internet service provider of country it is able to manage the competition from other entrants
effectively (Atmadja and Saputra, 2018). It has managed its revenues and the performance
efficiency that shows company has the potential of standing tough in this competitive and
dynamic environment. In past company has also faced controversies of advertising from ACCC.
The issue was smartly managed but it yet impacted the business operations and company was
imposed with specified regulations to follow
Ethical consideration when organisation becomes insolvent
There are situation where the companies go insolvent. Companies are required to follow
the ethics for discharging the liabilities associated with the business. The process of insolvency is
to be carried out as per the laws governing the event. Company should follow a proper procedure
8
Paraphrase This Document
Need a fresh take? Get an instant paraphrase of this document with our AI Paraphraser
when going on liquidation for discharging the liabilities and for carrying out the settlements. The
insolvency should not be carried for excluding the liabilities of the enterprise. The settlement
should be done by the statutory officials by applying proper procedures. The assets of the
company should be used for discharging the liabilities and obligations of the enterprise
positively. Company should be declared insolvent only when the orders have been passed by the
court adjudicating it to be insolvent. Without the orders of the court a company could not be
adjudged as insolvent.
External factors to be considered by the organisation.
A business do not operate solely in the market there are number of external factors
influencing the business that are required to be carefully faced by the company. Company has to
undertake number of challenges for operating in the global environment successfully. External
factors required to be considered by the organisation include political factors that deals with the
regulatory rules and powers of the territory in which the company is operating. Being a
telecommunication company it has to consider the laws and regulations regarding the security
concerns and privacy of data.
Economic factor is an another factor that is required to be considered by the organisation
for ensuring that the economic impacts are adequately managed. Economic conditions have
considerable impact over the performance of company (Brusca, Gómez‐villegas and
Montesinos, 2016). It deals with the purchasing power of the society, unemployment and the
inflation rate. They are required to be considered by the organisation. Social factors refer to the
society with which company has to deal. The usage of the internet over the decade has increased
significantly with the invention of smart phone and so the cyber crimes associated with it. It is
required to ensure that it takes its responsibility towards the society is undertaken actively that it
is not being used for unlawful activities that may affect the society.
CONCLUSION & RECOMMENDTION
Carrying out the above research it could be concluded that the financial performance and
position of the company is strong. Company is having adequate profitability and has also shown
an increase from the last year. Liquidity position of the company is very weak but the
management is striving for managing its resources. As a potential investor one should invest in
the company. The analysis shows that the company is efficient in managing its resources to
9

generate the returns. the decline is due to non monetary activities which will be managed within
short period of time.
10
short period of time.
10
⊘ This is a preview!⊘
Do you want full access?
Subscribe today to unlock all pages.
Trusted by 1+ million students worldwide
1 out of 13
Related Documents


Your All-in-One AI-Powered Toolkit for Academic Success.
+13062052269
info@desklib.com
Available 24*7 on WhatsApp / Email
![[object Object]](/_next/static/media/star-bottom.7253800d.svg)
Unlock your academic potential
Copyright © 2020–2026 A2Z Services. All Rights Reserved. Developed and managed by ZUCOL.