Analyzing Portfolio Performance Using Tracking Error Metrics

Verified

Added on  2020/04/07

|9
|1958
|49
AI Summary
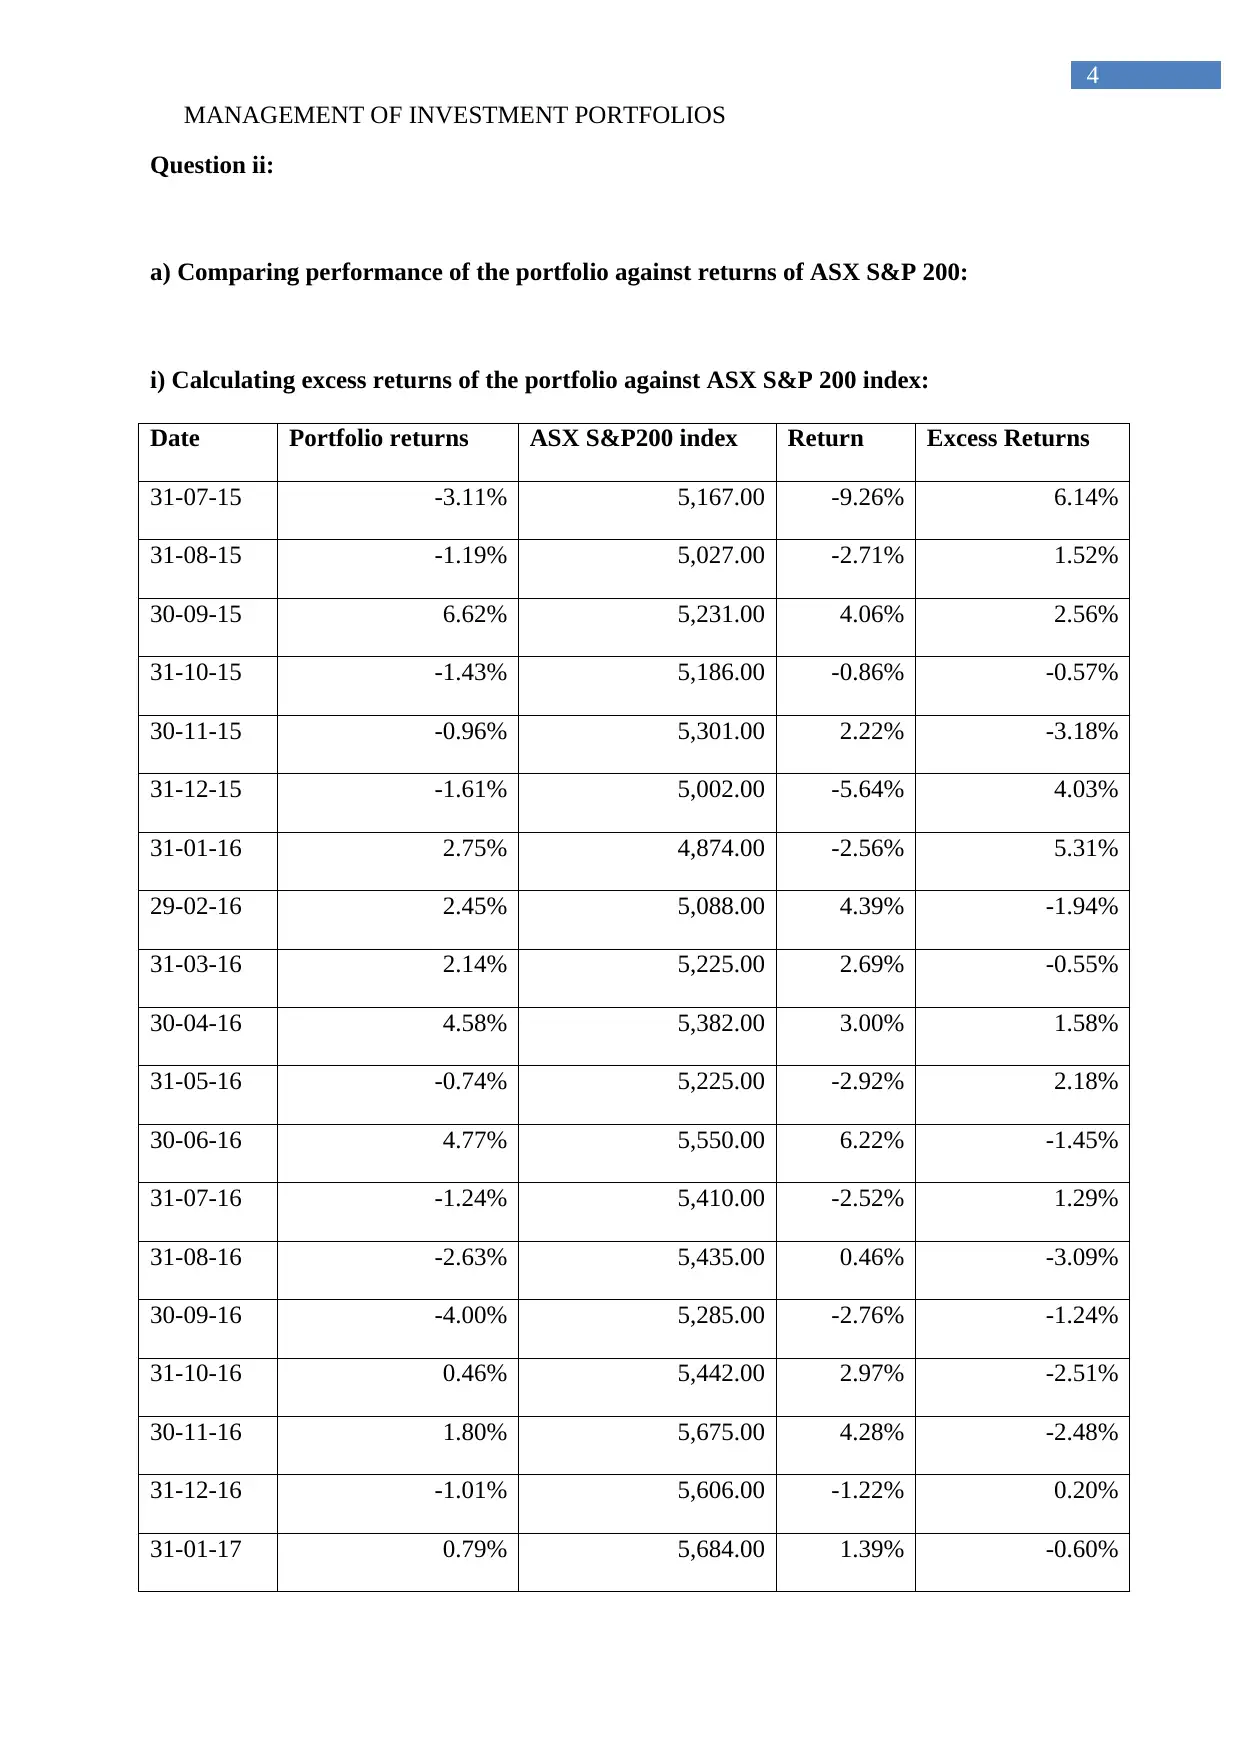
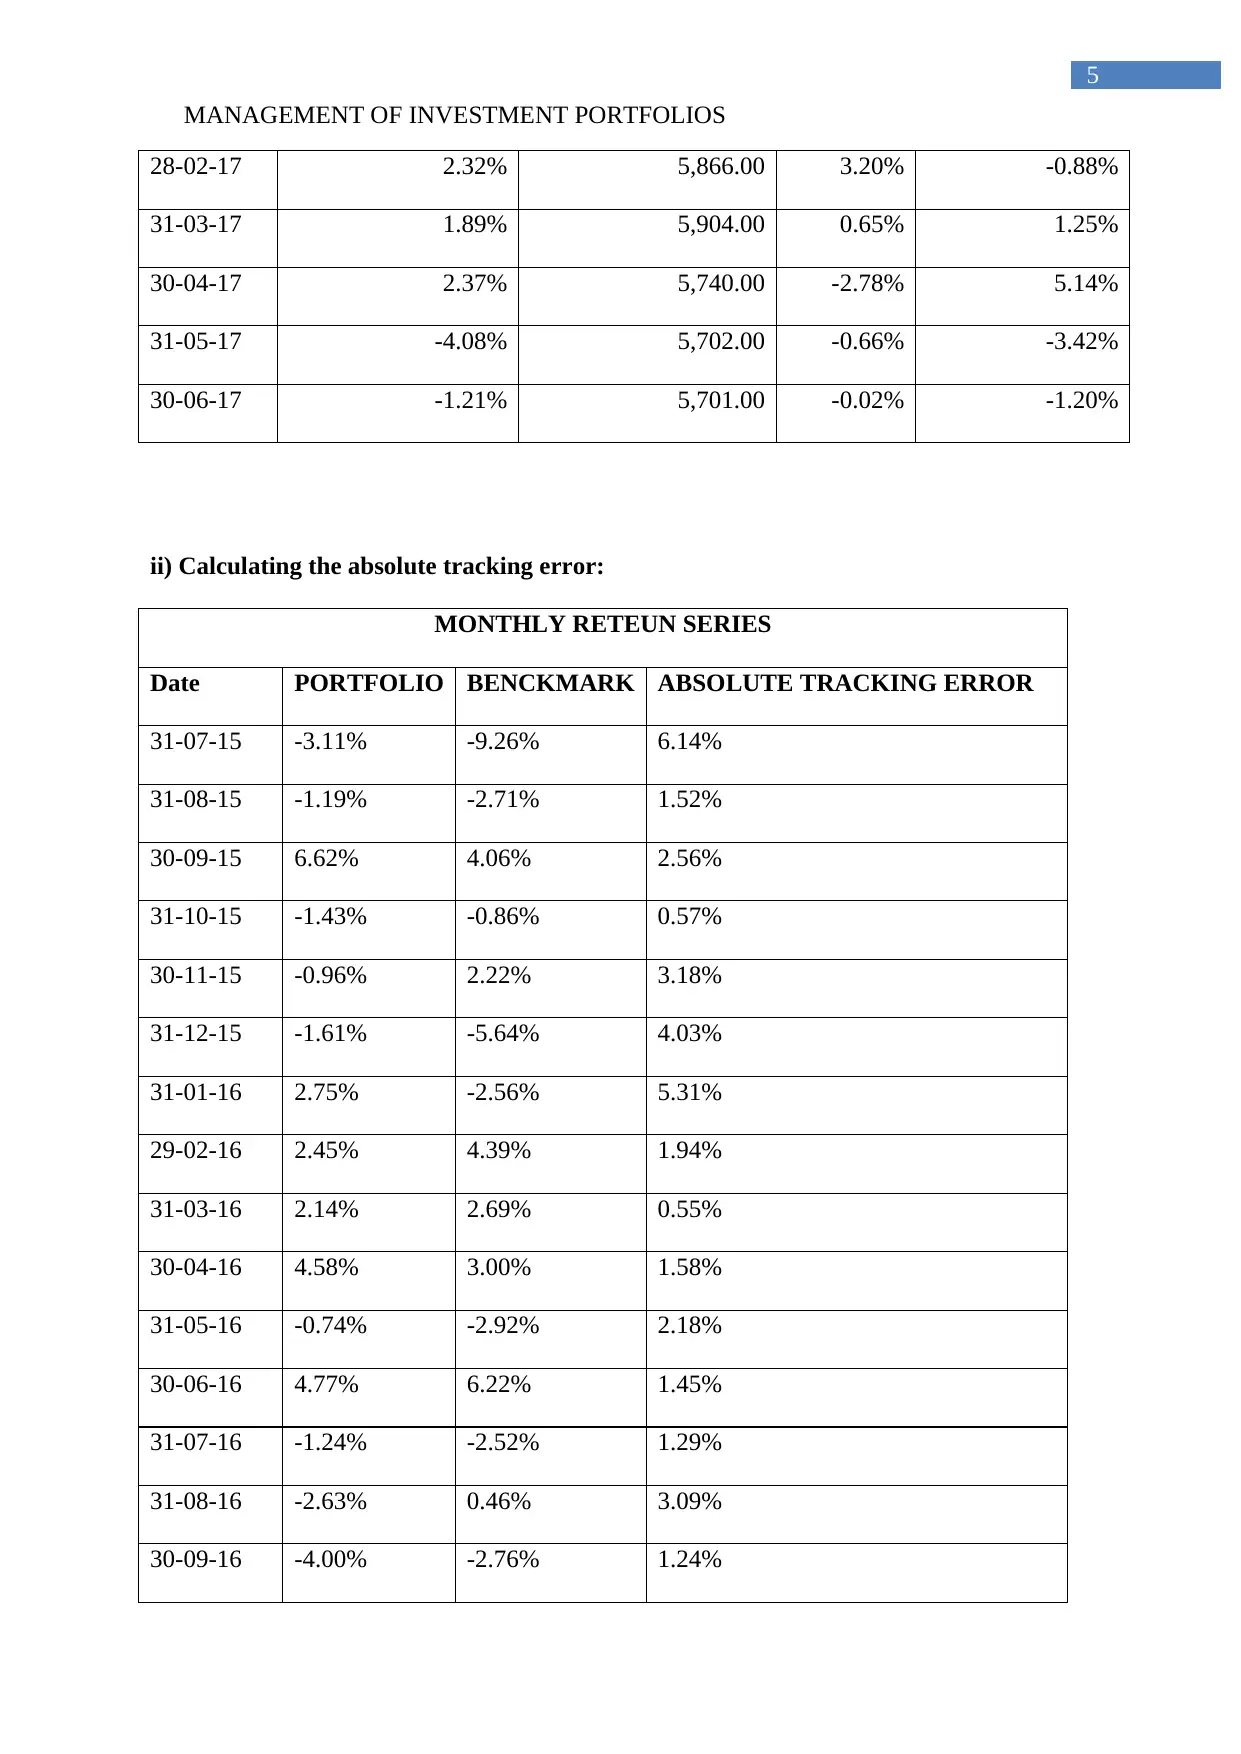
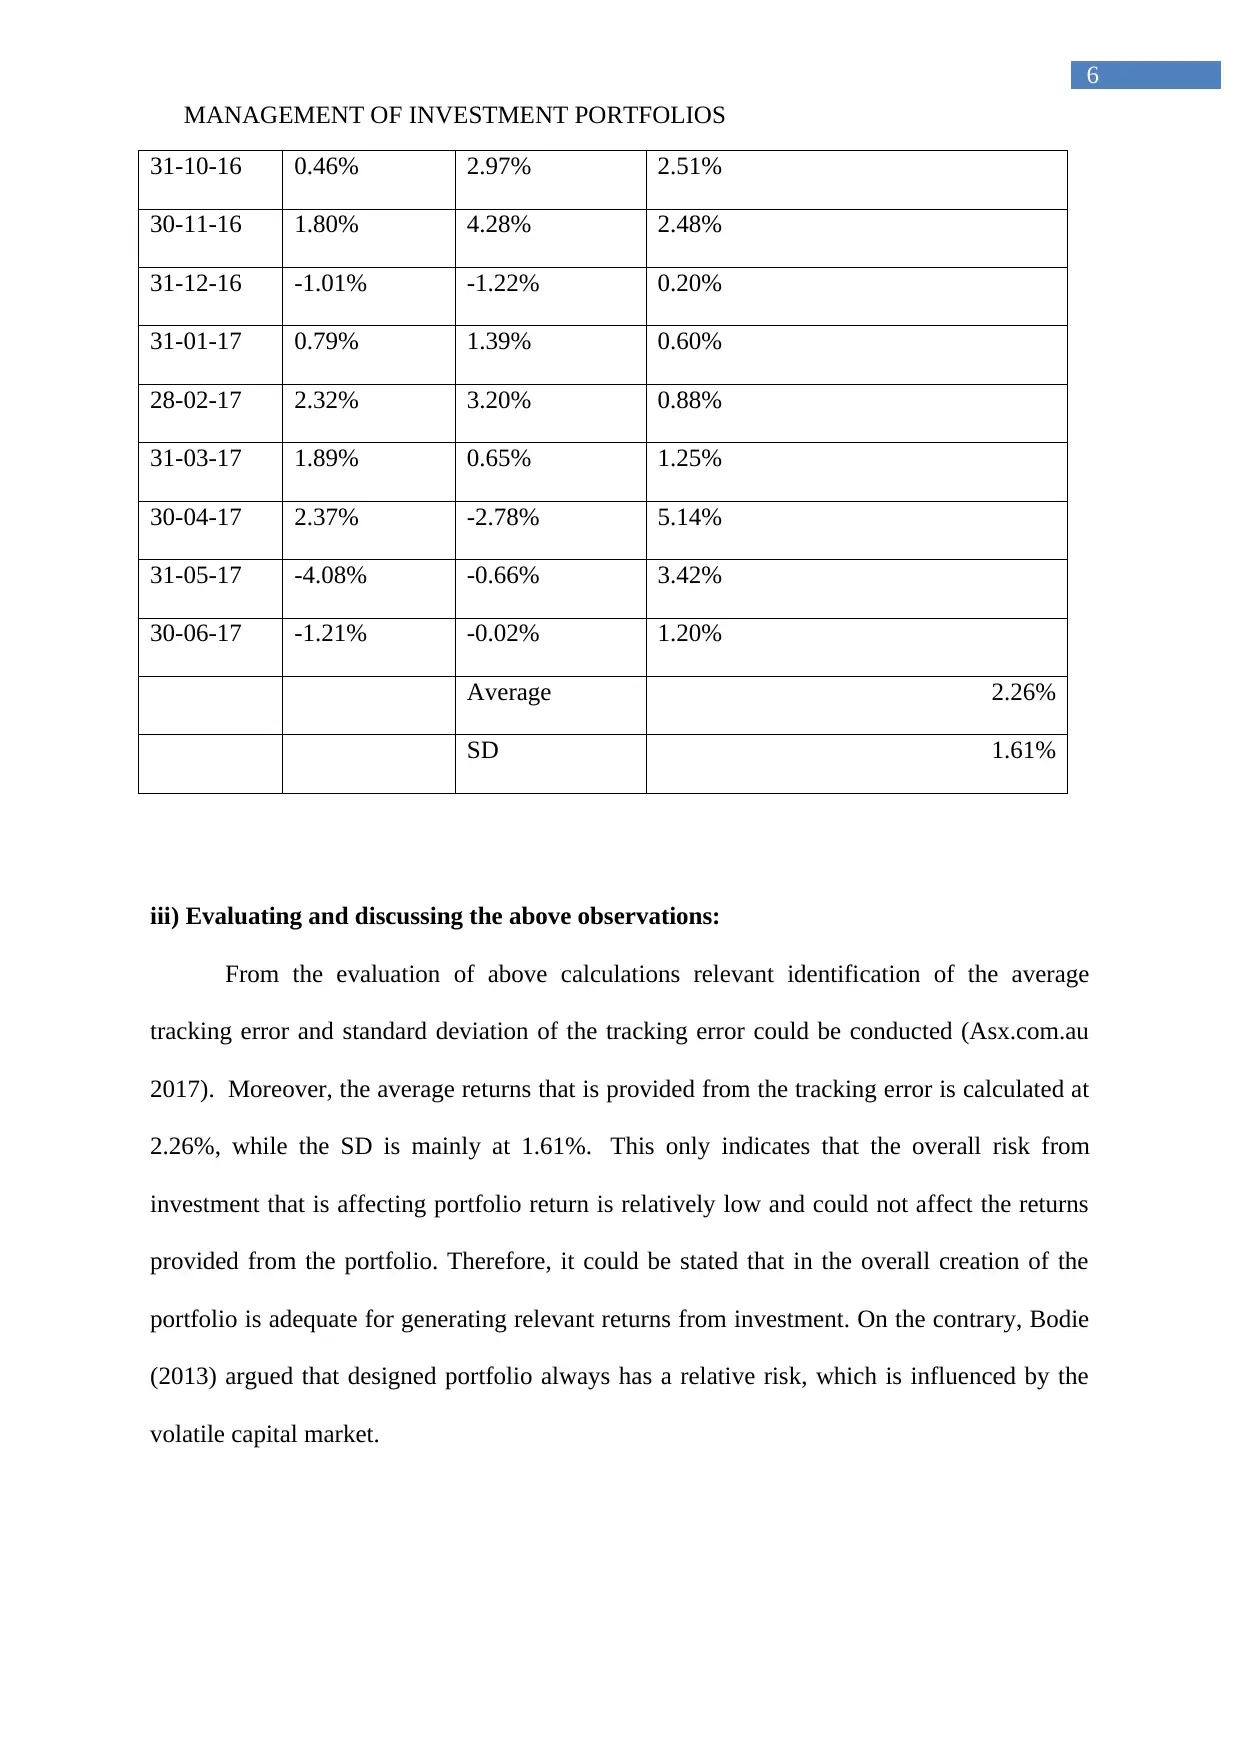
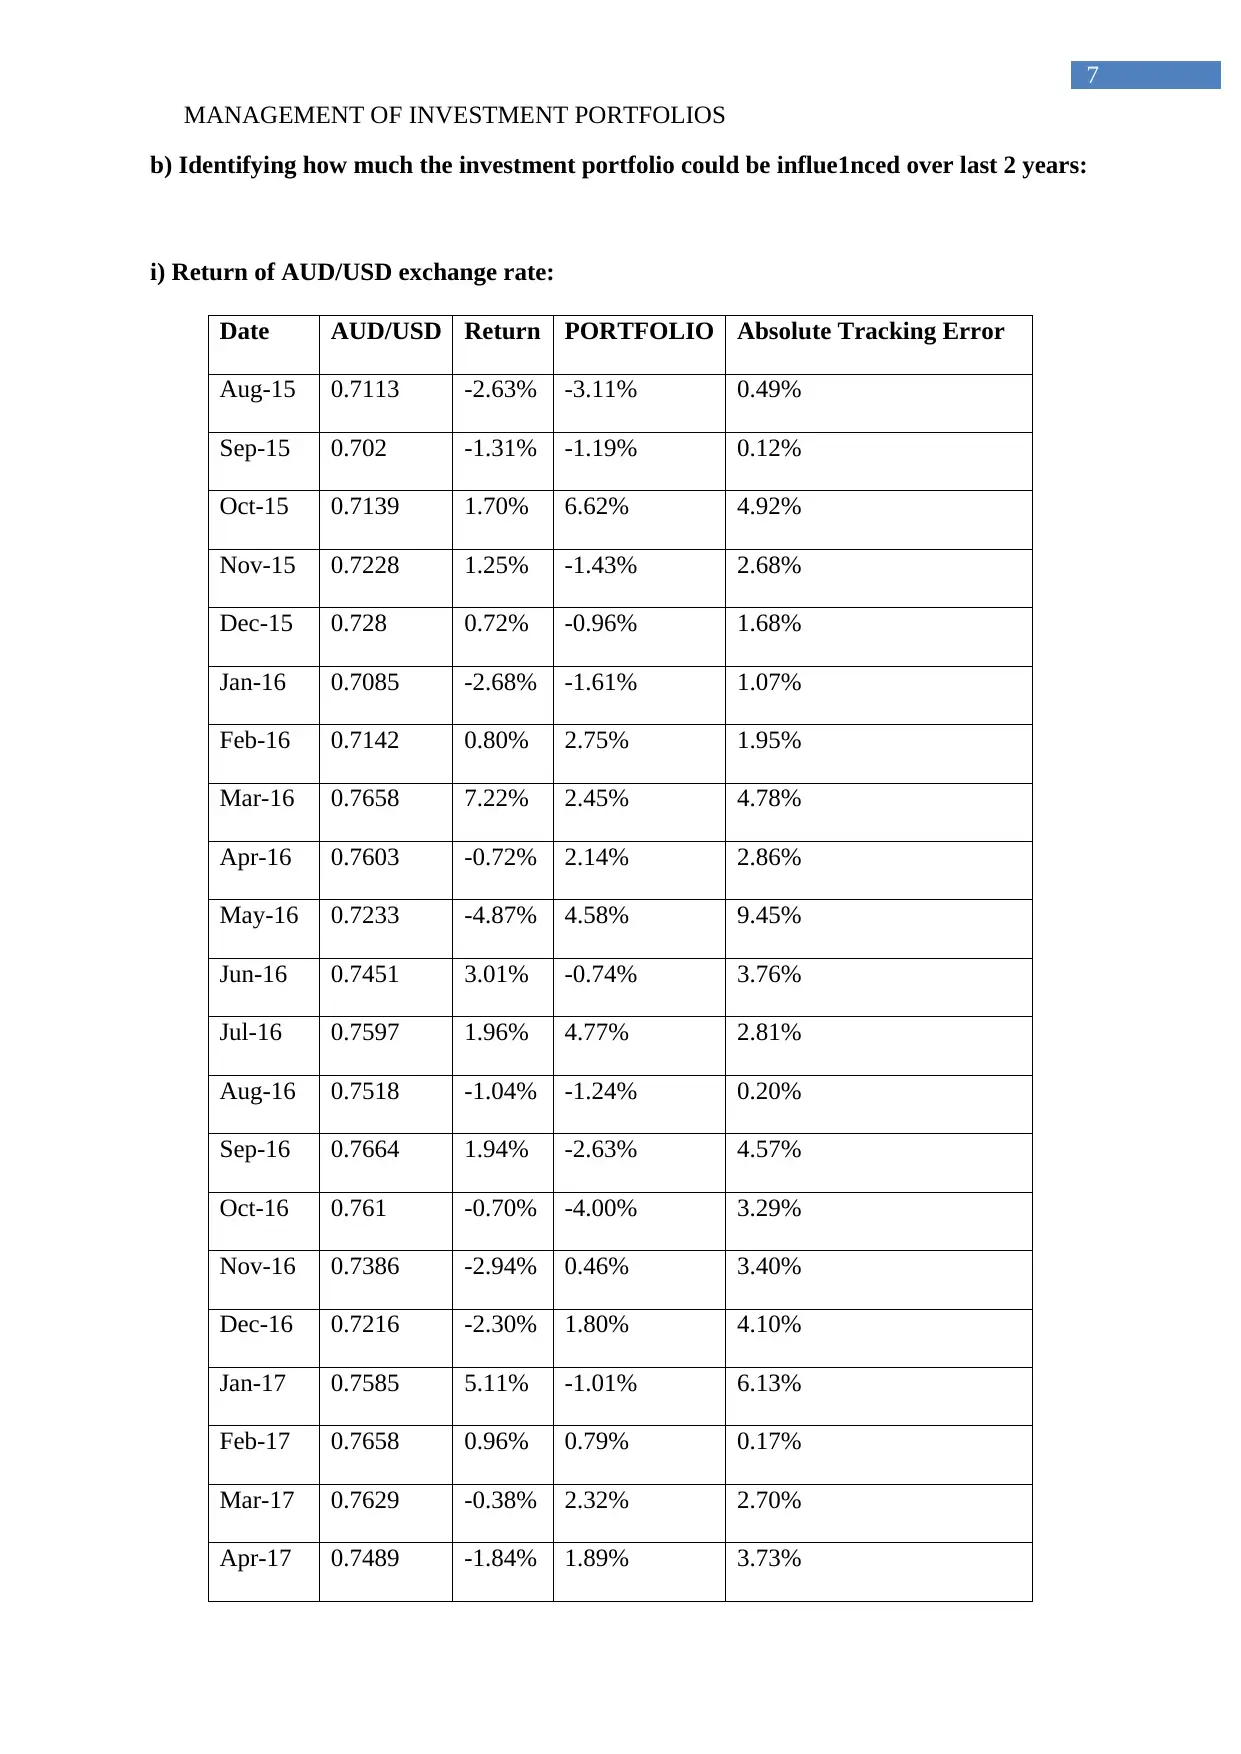
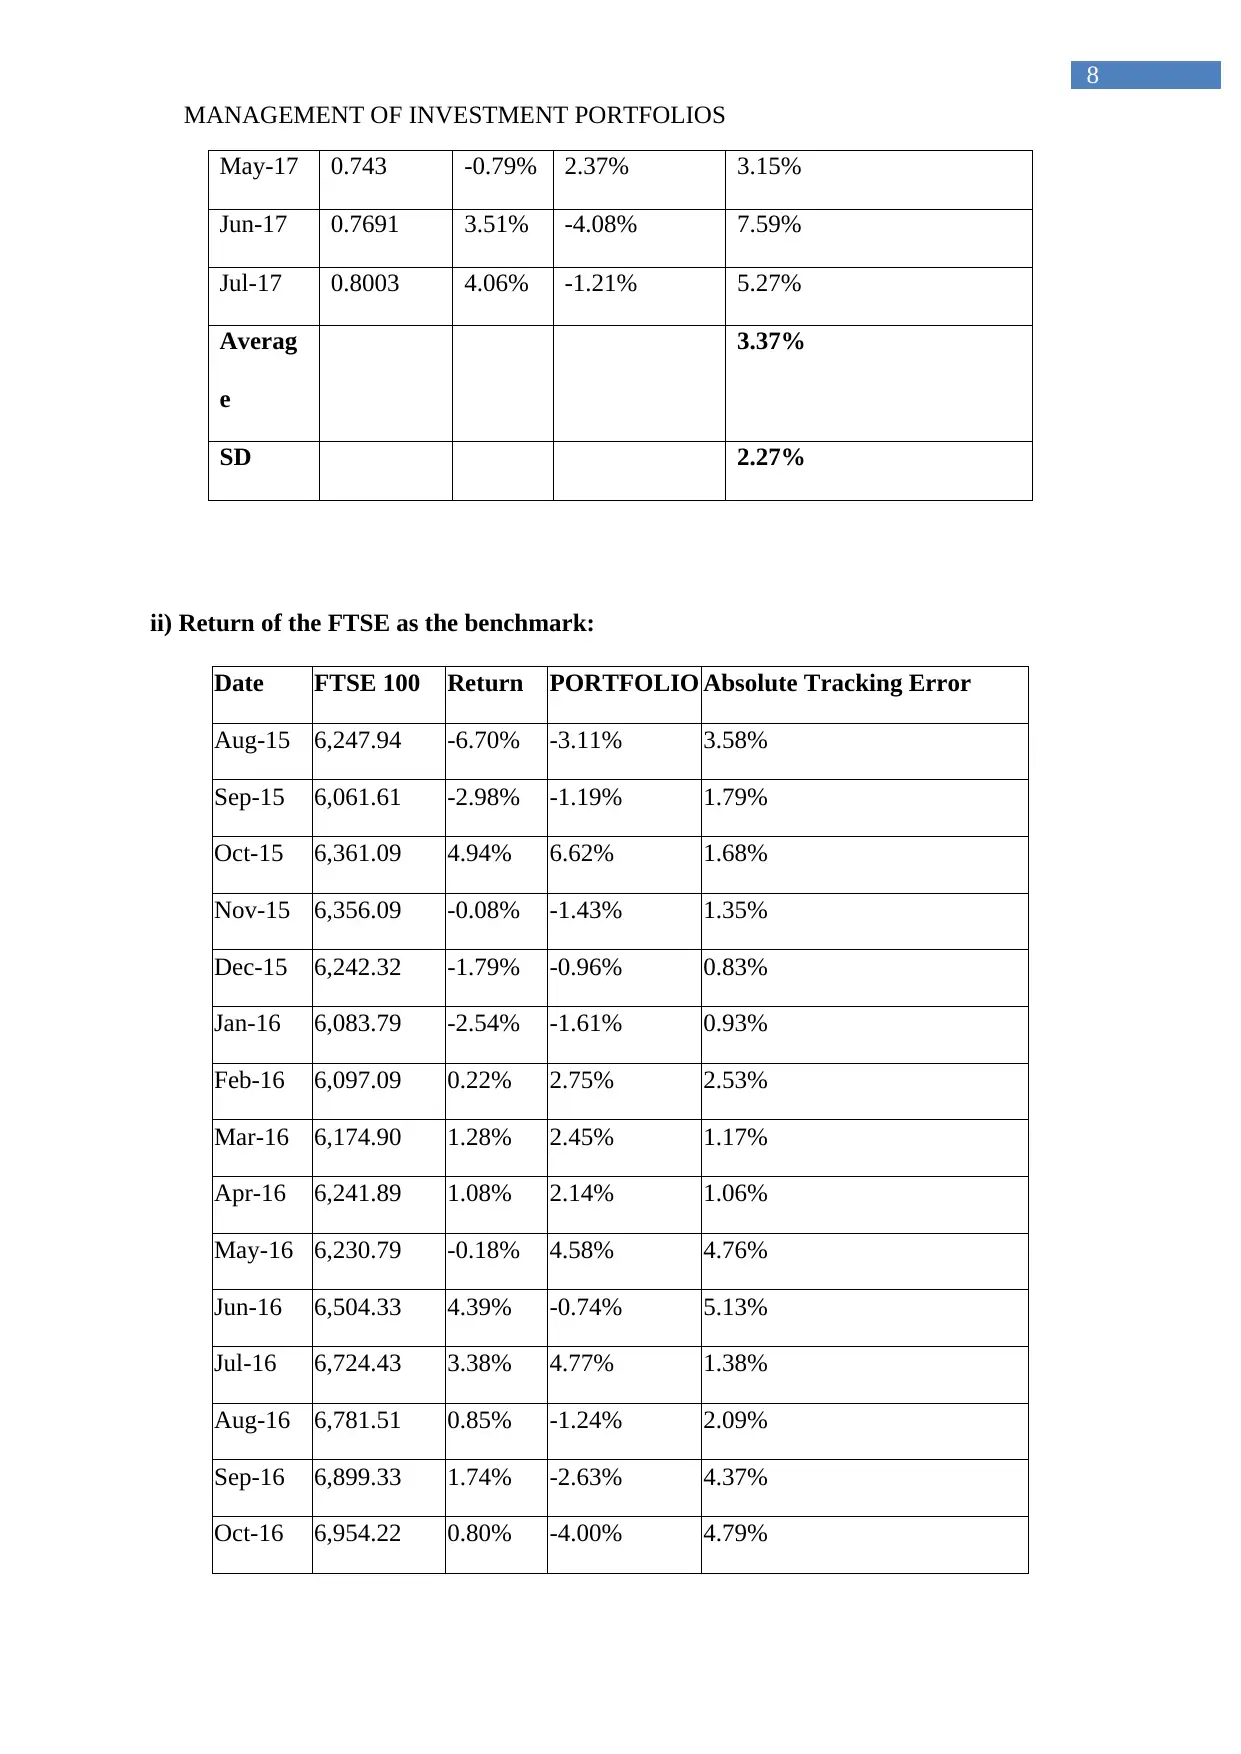
The task is to analyze the portfolio’s performance by comparing its monthly returns with those of a benchmark index and several currency pairs from January 2016 through July 2017. Key performance indicators such as annualized excess return, tracking error, information ratio, and Sharpe ratio will be calculated for both the portfolio and each currency pair. The analysis aims to identify how well the portfolio performed relative to the chosen benchmark and currencies, considering aspects like risk-adjusted returns and volatility. Additionally, the impact of currency fluctuations on investment performance is explored, with a specific focus on the AUD/USD exchange rate due to its significant influence during this period. This comprehensive review will provide insights into the effectiveness of the investment strategy employed and suggest potential areas for improvement.
tabler-icon-diamond-filled.svg

Contribute Materials

Your contribution can guide someone’s learning journey. Share your documents today.
Document Page
Running head: MANAGEMENT OF INVESTMENT PORTFOLIOS
Management of Investment Portfolios
Name of the Student:
Name of the University:
Authors Note:
tabler-icon-diamond-filled.svg

Secure Best Marks with AI Grader

Need help grading? Try our AI Grader for instant feedback on your assignments.
Document Page
1
MANAGEMENT OF INVESTMENT PORTFOLIOS
Table of Contents
Question i:..................................................................................................................................2
1. Pin pointing the 3 assets that is been used in infrastructure fund:.........................................2
2.i) Providing relevant decision and justifying for selection of Australia ETF and
International ETF:......................................................................................................................2
2.ii) Depicting the potential factors that might affect performance of funds over the tenure of
12 months:..................................................................................................................................3
Question ii:.................................................................................................................................4
a) Comparing performance of the portfolio against returns of ASX S&P 200:.........................4
i) Calculating excess returns of the portfolio against ASX S&P 200 index:.............................4
ii) Calculating the absolute tracking error:.................................................................................5
iii) Evaluating and discussing the above observations:..............................................................6
b) Identifying how much the investment portfolio could be influe1nced over last 2 years:......7
i) Return of AUD/USD exchange rate:......................................................................................7
ii) Return of the FTSE as the benchmark:..................................................................................8
Reference:................................................................................................................................10
Document Page
2
MANAGEMENT OF INVESTMENT PORTFOLIOS
Question i:
1. Pin pointing the 3 assets that is been used in infrastructure fund:
From the evaluation of Infrastructure fund yesterday near sex it could be identified
that you can directly involved investments in Utilities, Airport services and Highway &
Railtracks services. The three investment action that is used in the infrastructure fund is
mainly identified above, which directly allows the investors to generate higher returns from
investment. However, the infrastructure fund that is used in the portfolio is MACQUARIE
ATLAS ROADS GROUP, which directly deals with Highway & Railtracks services
(Asx.com.au 2017). Furthermore, the evaluation of the past Performance of the fund mainly
depict the relevant increment in returns that was provided in past 2 years from July 2015 to
July 2017.Adequate dividends also provided by the fund, which is directly increasing return
that could be provided from an investment.
2.i) Providing relevant decision and justifying for selection of Australia ETF and
International ETF:
The Australian and International ETFs have been chosen due to the returns that are
provided on the investment. In addition, a constant and higher returns has been provided from
investing and the Australian and International ETFs. The rising dividend and prices of the
overall ETFs directly encourages investors to invest in VANGUARD MSCI AUSTRALIAN
SMALL COMPANIES INDEX ETF and ISHARES GLOBAL TELECOM ETF (Asx.com.au
2017). Both the ETFs provide a constant rising dividend, while the overall prices have also
been rising since the starting of the ETF. Therefore, the overall assumptions and relevant
dividends that is provided by the ETFs mainly helped in choosing the ETF for the portfolio
(DeFusco et al. 2015).
Document Page
3
MANAGEMENT OF INVESTMENT PORTFOLIOS
2.ii) Depicting the potential factors that might affect performance of funds over the
tenure of 12 months:
The three main factors that could influence he returns provided by the portfolio in
near 12 month 10 years are risk in financial sector, changing Australian regulations and
change in IFRS rule. The above-mentioned factors directly influence the returns provided by
the portfolio, as it might directly influence the return and risk of the overall capital market.
Hence, the factors to directly influence returns any stop that is listed ASX and other financial
institutions (Szegö 2014). The First Act directly indicates the risk in financial sector, which
can be seen from the previous recession. This could eventually affect returns provided from
investments and increase volatility of the capital market. The second factor directly states the
change in Australian regulations, which is affecting operational feasibility of the
organisations in Australia. This might reduce efficiency of the organisation and effect return
generation capacity, which could directly influence the capital market, while influencing the
portfolio. The last factor is the changing IFRS rule, which is directly increasing transparency
of the operations conducted by the organisation. Despite increase the volatility of a stock, as
investors will react according to the information provided by the organisation. High-end
information provided by the organisation could directly support efficient market hypothesis,
by increasing the volatility in the market (McNeil, Frey and Embrechts 2015). This increased
volatility in the market could directly affect portfolio returns and depict negatively on the risk
factor.
tabler-icon-diamond-filled.svg

Secure Best Marks with AI Grader

Need help grading? Try our AI Grader for instant feedback on your assignments.
Document Page
4
MANAGEMENT OF INVESTMENT PORTFOLIOS
Question ii:
a) Comparing performance of the portfolio against returns of ASX S&P 200:
i) Calculating excess returns of the portfolio against ASX S&P 200 index:
Date Portfolio returns ASX S&P200 index Return Excess Returns
31-07-15 -3.11% 5,167.00 -9.26% 6.14%
31-08-15 -1.19% 5,027.00 -2.71% 1.52%
30-09-15 6.62% 5,231.00 4.06% 2.56%
31-10-15 -1.43% 5,186.00 -0.86% -0.57%
30-11-15 -0.96% 5,301.00 2.22% -3.18%
31-12-15 -1.61% 5,002.00 -5.64% 4.03%
31-01-16 2.75% 4,874.00 -2.56% 5.31%
29-02-16 2.45% 5,088.00 4.39% -1.94%
31-03-16 2.14% 5,225.00 2.69% -0.55%
30-04-16 4.58% 5,382.00 3.00% 1.58%
31-05-16 -0.74% 5,225.00 -2.92% 2.18%
30-06-16 4.77% 5,550.00 6.22% -1.45%
31-07-16 -1.24% 5,410.00 -2.52% 1.29%
31-08-16 -2.63% 5,435.00 0.46% -3.09%
30-09-16 -4.00% 5,285.00 -2.76% -1.24%
31-10-16 0.46% 5,442.00 2.97% -2.51%
30-11-16 1.80% 5,675.00 4.28% -2.48%
31-12-16 -1.01% 5,606.00 -1.22% 0.20%
31-01-17 0.79% 5,684.00 1.39% -0.60%
Document Page
5
MANAGEMENT OF INVESTMENT PORTFOLIOS
28-02-17 2.32% 5,866.00 3.20% -0.88%
31-03-17 1.89% 5,904.00 0.65% 1.25%
30-04-17 2.37% 5,740.00 -2.78% 5.14%
31-05-17 -4.08% 5,702.00 -0.66% -3.42%
30-06-17 -1.21% 5,701.00 -0.02% -1.20%
ii) Calculating the absolute tracking error:
MONTHLY RETEUN SERIES
Date PORTFOLIO BENCKMARK ABSOLUTE TRACKING ERROR
31-07-15 -3.11% -9.26% 6.14%
31-08-15 -1.19% -2.71% 1.52%
30-09-15 6.62% 4.06% 2.56%
31-10-15 -1.43% -0.86% 0.57%
30-11-15 -0.96% 2.22% 3.18%
31-12-15 -1.61% -5.64% 4.03%
31-01-16 2.75% -2.56% 5.31%
29-02-16 2.45% 4.39% 1.94%
31-03-16 2.14% 2.69% 0.55%
30-04-16 4.58% 3.00% 1.58%
31-05-16 -0.74% -2.92% 2.18%
30-06-16 4.77% 6.22% 1.45%
31-07-16 -1.24% -2.52% 1.29%
31-08-16 -2.63% 0.46% 3.09%
30-09-16 -4.00% -2.76% 1.24%
Document Page
6
MANAGEMENT OF INVESTMENT PORTFOLIOS
31-10-16 0.46% 2.97% 2.51%
30-11-16 1.80% 4.28% 2.48%
31-12-16 -1.01% -1.22% 0.20%
31-01-17 0.79% 1.39% 0.60%
28-02-17 2.32% 3.20% 0.88%
31-03-17 1.89% 0.65% 1.25%
30-04-17 2.37% -2.78% 5.14%
31-05-17 -4.08% -0.66% 3.42%
30-06-17 -1.21% -0.02% 1.20%
Average 2.26%
SD 1.61%
iii) Evaluating and discussing the above observations:
From the evaluation of above calculations relevant identification of the average
tracking error and standard deviation of the tracking error could be conducted (Asx.com.au
2017). Moreover, the average returns that is provided from the tracking error is calculated at
2.26%, while the SD is mainly at 1.61%. This only indicates that the overall risk from
investment that is affecting portfolio return is relatively low and could not affect the returns
provided from the portfolio. Therefore, it could be stated that in the overall creation of the
portfolio is adequate for generating relevant returns from investment. On the contrary, Bodie
(2013) argued that designed portfolio always has a relative risk, which is influenced by the
volatile capital market.
tabler-icon-diamond-filled.svg

Paraphrase This Document

Need a fresh take? Get an instant paraphrase of this document with our AI Paraphraser
Document Page
7
MANAGEMENT OF INVESTMENT PORTFOLIOS
b) Identifying how much the investment portfolio could be influe1nced over last 2 years:
i) Return of AUD/USD exchange rate:
Date AUD/USD Return PORTFOLIO Absolute Tracking Error
Aug-15 0.7113 -2.63% -3.11% 0.49%
Sep-15 0.702 -1.31% -1.19% 0.12%
Oct-15 0.7139 1.70% 6.62% 4.92%
Nov-15 0.7228 1.25% -1.43% 2.68%
Dec-15 0.728 0.72% -0.96% 1.68%
Jan-16 0.7085 -2.68% -1.61% 1.07%
Feb-16 0.7142 0.80% 2.75% 1.95%
Mar-16 0.7658 7.22% 2.45% 4.78%
Apr-16 0.7603 -0.72% 2.14% 2.86%
May-16 0.7233 -4.87% 4.58% 9.45%
Jun-16 0.7451 3.01% -0.74% 3.76%
Jul-16 0.7597 1.96% 4.77% 2.81%
Aug-16 0.7518 -1.04% -1.24% 0.20%
Sep-16 0.7664 1.94% -2.63% 4.57%
Oct-16 0.761 -0.70% -4.00% 3.29%
Nov-16 0.7386 -2.94% 0.46% 3.40%
Dec-16 0.7216 -2.30% 1.80% 4.10%
Jan-17 0.7585 5.11% -1.01% 6.13%
Feb-17 0.7658 0.96% 0.79% 0.17%
Mar-17 0.7629 -0.38% 2.32% 2.70%
Apr-17 0.7489 -1.84% 1.89% 3.73%
Document Page
8
MANAGEMENT OF INVESTMENT PORTFOLIOS
May-17 0.743 -0.79% 2.37% 3.15%
Jun-17 0.7691 3.51% -4.08% 7.59%
Jul-17 0.8003 4.06% -1.21% 5.27%
Averag
e
3.37%
SD 2.27%
ii) Return of the FTSE as the benchmark:
Date FTSE 100 Return PORTFOLIO Absolute Tracking Error
Aug-15 6,247.94 -6.70% -3.11% 3.58%
Sep-15 6,061.61 -2.98% -1.19% 1.79%
Oct-15 6,361.09 4.94% 6.62% 1.68%
Nov-15 6,356.09 -0.08% -1.43% 1.35%
Dec-15 6,242.32 -1.79% -0.96% 0.83%
Jan-16 6,083.79 -2.54% -1.61% 0.93%
Feb-16 6,097.09 0.22% 2.75% 2.53%
Mar-16 6,174.90 1.28% 2.45% 1.17%
Apr-16 6,241.89 1.08% 2.14% 1.06%
May-16 6,230.79 -0.18% 4.58% 4.76%
Jun-16 6,504.33 4.39% -0.74% 5.13%
Jul-16 6,724.43 3.38% 4.77% 1.38%
Aug-16 6,781.51 0.85% -1.24% 2.09%
Sep-16 6,899.33 1.74% -2.63% 4.37%
Oct-16 6,954.22 0.80% -4.00% 4.79%
chevron_up_icon
1 out of 9
circle_padding
hide_on_mobile
zoom_out_icon
logo.png

Your All-in-One AI-Powered Toolkit for Academic Success.

Available 24*7 on WhatsApp / Email

[object Object]