International Economics: Trade Analysis & Policy Brief on Italy/Sweden
VerifiedAdded on 2023/04/21
|6
|1130
|427
Report
AI Summary
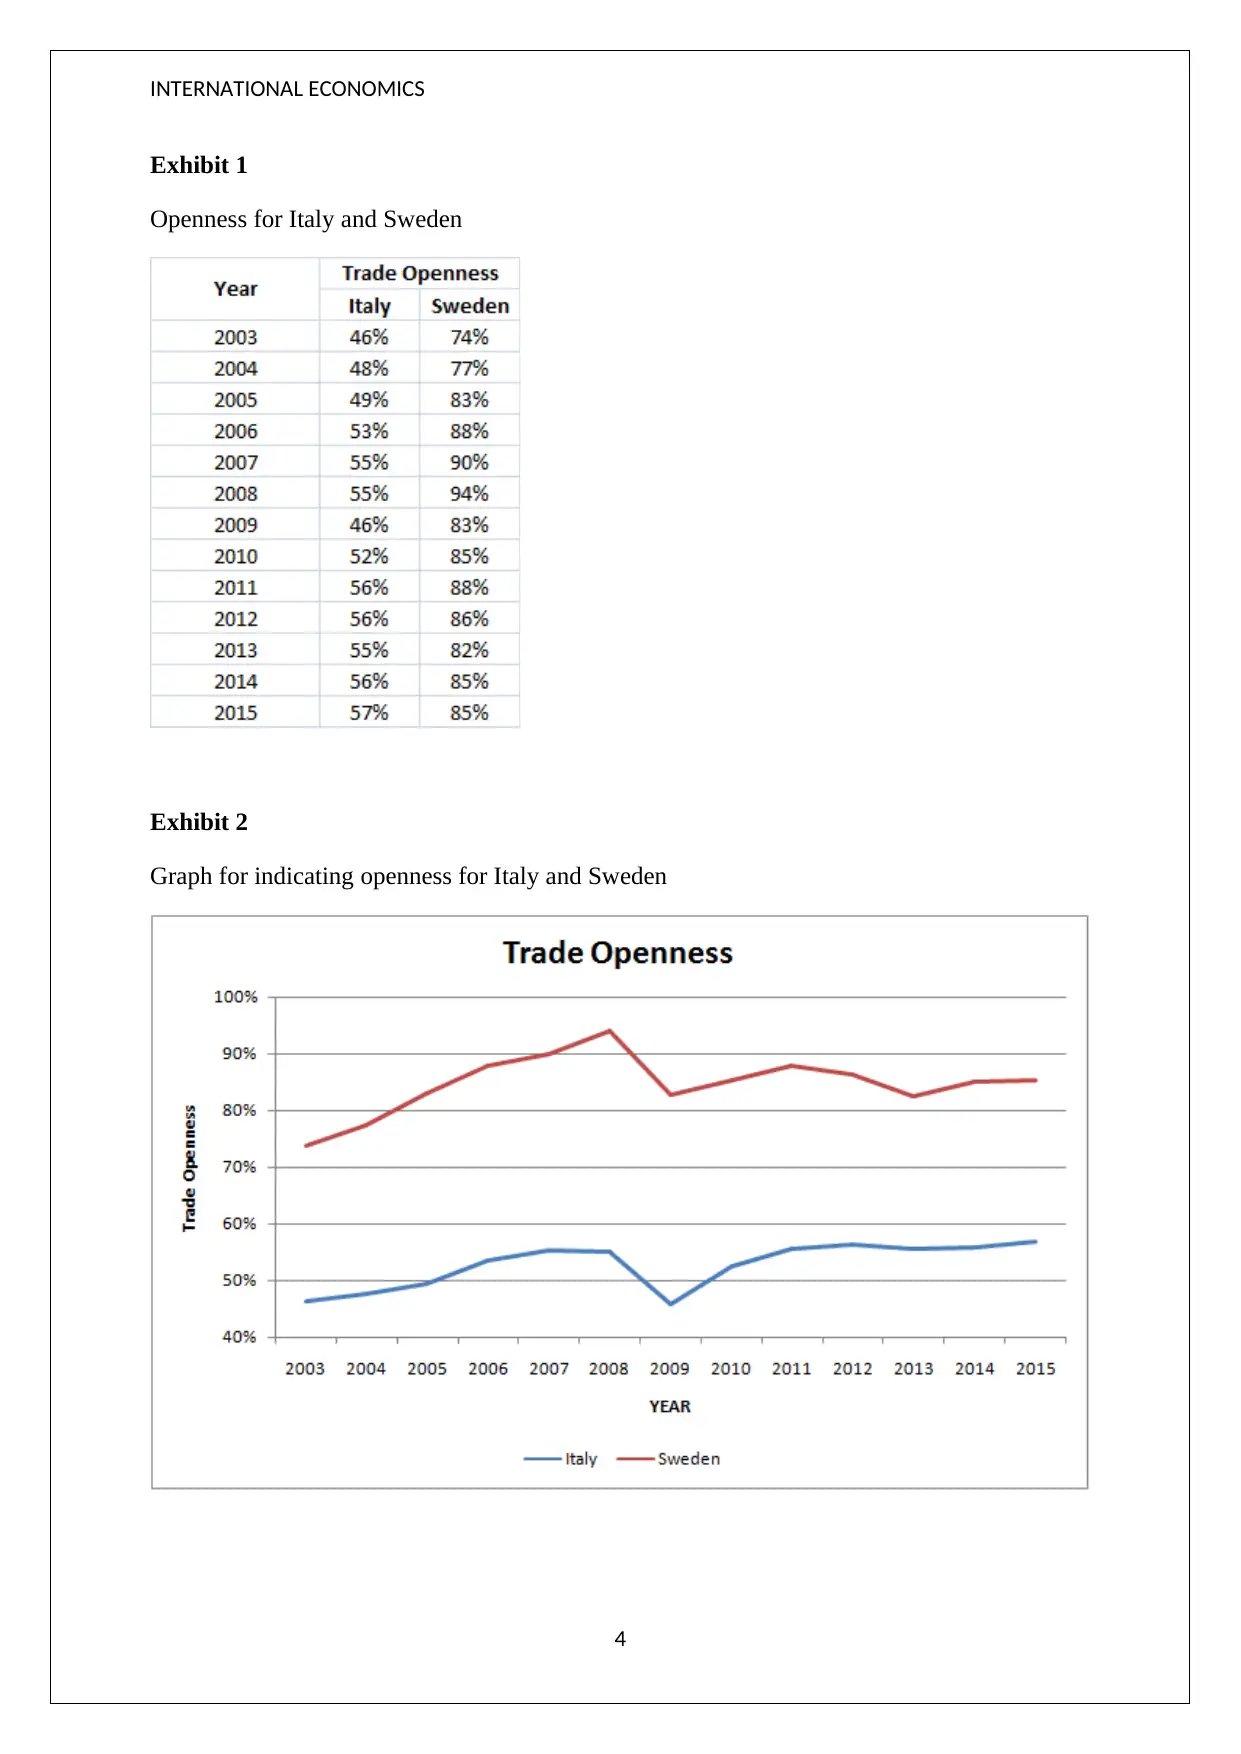
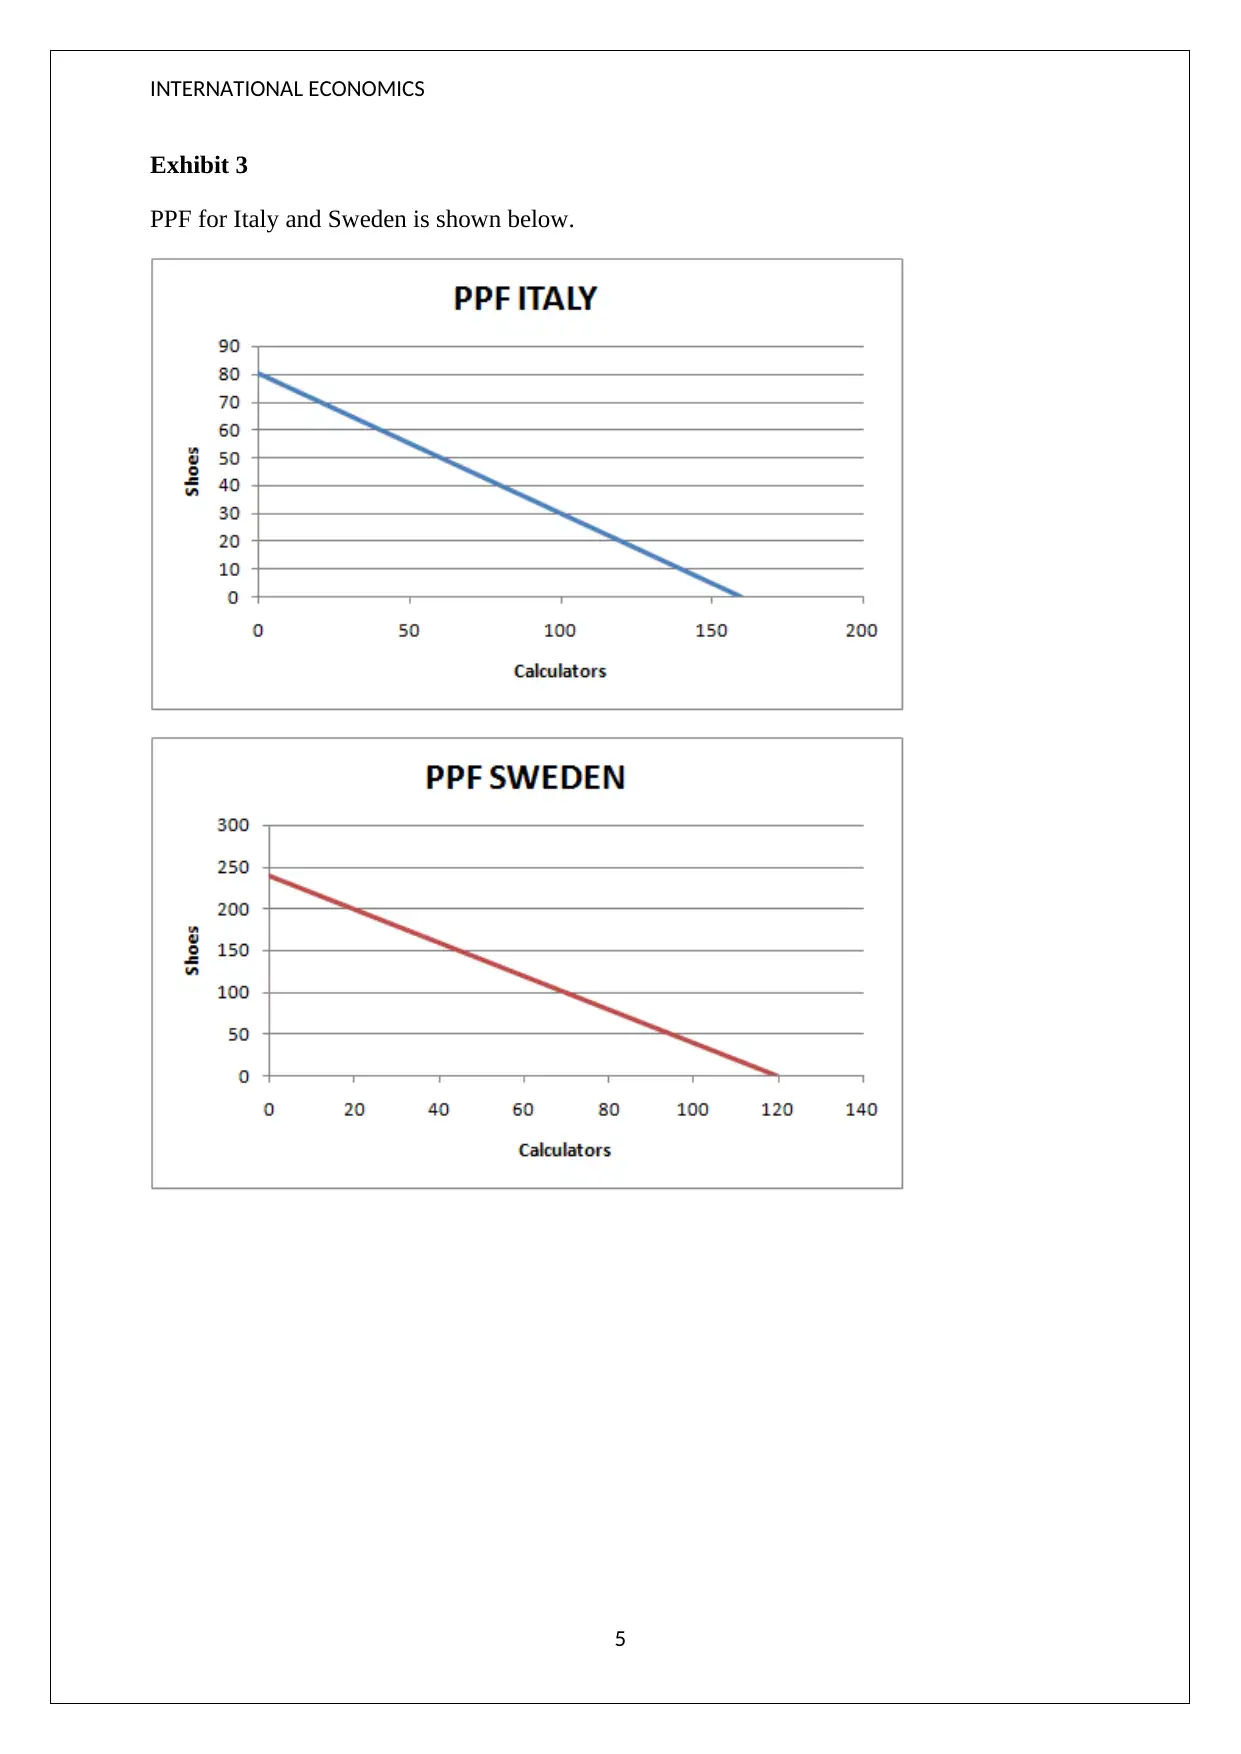
This report provides an analysis of international trade between Italy and Sweden, functioning as a policy brief. It examines the openness of both economies from 2003 to 2015, calculating correlation coefficients between openness and GDP per capita to determine the relationship between trade and economic development. The analysis includes a technical evaluation of absolute and comparative advantages in the production of shoes and calculators, using production possibility frontiers to illustrate potential trade benefits. The report concludes with recommendations for trade strategies based on comparative advantages, suggesting specific production and export volumes for both countries, highlighting the role of Desklib as a platform for accessing similar solved assignments and study resources.

INTERNATIONAL ECONOMICS
POLICY BRIEF
STUDENT ID:
[Pick the date]
POLICY BRIEF
STUDENT ID:
[Pick the date]
Paraphrase This Document
Need a fresh take? Get an instant paraphrase of this document with our AI Paraphraser

INTERNATIONAL ECONOMICS
OPENNESS ANALYSIS FOR SWEDEN AND ITALY: PART 1
Data Analysis
Step 1
Openness for Italy and Sweden from 2003 to 2015 has been reflected in Exhibit 1. The
formula for computation of the same is reflected below (Barro, 2017)
Instead of computing openness as indicated above, the incidence of trade barriers (both tariff
and non-tariffs) could also have been considered. Considering the percentage of imports on
which there is some kind of trade barrier, the two countries can be compared and a degree of
their respective openness can be estimated. Higher trade barriers would imply a lower
openness of the economy (Dombusch, Fischer and Startz, 2015).
Step 2
The respective plot for openness of the two nations has been represented in Exhibit 2. This
graph highlights that Sweden has a higher openness in comparison to Italy for the considered
time period. This implies lower barriers to trade in Sweden as compared to Italy. From 2003
till 2008, openness in Sweden witnessed a linear upward trend as openness increased by 20%
to reach 94%. This trend was disturbed by the global financial crisis during 2008-2009 when
trade witnessed a sharp downfall leading to fall in openness (Krugman, 2015). Even though,
Sweden has witnessed minor improvement in openness from the lows witnessed during the
global financial crisis but it has not been able to regain the pre-crisis glory as openness has
not crossed 90%.
Openness in Italy improved from 46% to 55% during 2003-2008 backed by the buoyant
global economic growth. This amounts to an increase of 9% which fades in comparison of
Sweden that witnessed a 20% improvement during the same period. During the global
financial crisis, the openness for Italy fell to 46% (Mankiw, 2016) However, post crisis
improvement in openness for Italy has been superior than Sweden considering that Italy has
crossed the peak level of 55% observed in pre-crisis era.
Step 3
The correlation coefficient has been calculated using CORREL() Excel function. This
coefficient has been derived as 0.77 for Italy based on the available data for the time period
2003-2015. The positive value of correlation coefficient highlights the existence of a positive
relationship between openness and GDP per capita. This is indicative of the fact that there is
an association between improvement in openness and improvement in GDP per capital.
2

INTERNATIONAL ECONOMICS
Further, the strength of this linear association is strong considering that value of the
correlation coefficient is close to the theoretical maximum of 1 (Hair et. al., 2015).
In context of Sweden, the correlation coefficient between openness and GDP per capita has
been derived as 0.52. The value has come out as positive which implies a positive relation
between the two variables. Unlike Italy, the magnitude in case of Sweden is comparatively
less but still the relationship is moderately strong. Hence, it is evident that there is positive
linear association between openness and economic development for both the nations.
However, the precise of this relationship varies for the two countries with Italy showing a
stronger trend (Flick, 2015).
Technical Analysis
Step 4
a) Taking into consideration the information presented, for shoes the absolute advantage is
with Sweden considering the fact that four shoes may be manufactured in a unit time in
Sweden as against one shoe in Italy. In case of calculators, absolute advantage is
possessed by neither of the two countries since in a unit time, each country manufactures 2
calculators per unit time. (Barro, 2017).
b) The comparative advantage is dependent on the underlying opportunity cost associated
with the production of a given item (Mankiw, 2016). With regards to shoes, Italy has an
opportunity cost of 2 calculators. On the other hand, Sweden has an opportunity cost of
(2/4) or 0.5 calculators. As a result, Sweden has the comparative advantage in shoes. With
regards to calculators, Italy has a lower opportunity cost of (1/2) shoes or 0.5 shoes in
comparison to (4/2) or 2 shoes for Sweden. Hence, comparative advantage for calculators
is with Italy.
c) The PPF for Italy and Sweden are indicated in Exhibit 3. The respective slope of PPF for
Italy and Sweden are -0.5 and -2 respectively.
d) Calculator relative price under autarky in Italy = (80/160) = 0.5
Calculator relative price under autarky in Sweden = (240/120) = 2
f) Based on the given data, under autarky, it is suggested that Sweden should make a total of
240 shoes owing to competitive advantage. The consumption should be 100 shoes while the
remaining 140 ought to be exported to Italy. With regards to Italy, the comparative advantage
lies in manufacturing of calculator and hence 160 calculators should be produced. Out of
these 160 calculators, 100 should be consumed while 60 ought to be exported to Sweden.
3
⊘ This is a preview!⊘
Do you want full access?
Subscribe today to unlock all pages.

Trusted by 1+ million students worldwide

INTERNATIONAL ECONOMICS
Exhibit 1
Openness for Italy and Sweden
Exhibit 2
Graph for indicating openness for Italy and Sweden
4
Exhibit 1
Openness for Italy and Sweden
Exhibit 2
Graph for indicating openness for Italy and Sweden
4
Paraphrase This Document
Need a fresh take? Get an instant paraphrase of this document with our AI Paraphraser

INTERNATIONAL ECONOMICS
Exhibit 3
PPF for Italy and Sweden is shown below.
5
Exhibit 3
PPF for Italy and Sweden is shown below.
5

INTERNATIONAL ECONOMICS
References
Barro, R. (2017). Macroeconomics: A Modern Approach (4thed.). London: Cengage
Learning, pp. 67-68
Dombusch, R., Fischer, S. and Startz, R. (2015).Macroeconomics (10thed.). New York:
McGraw Hill Publications, pp. 78-79
Flick, U. (2015) Introducing research methodology: A beginner's guide to doing a research
project. 4th ed. New York: Sage Publications, pp. 134-135
Hair, J. F., Wolfinbarger, M., Money, A. H., Samouel, P., and Page, M. J. (2015) Essentials
of business research methods. 2nd ed. New York: Routledge, pp. 81-82
Krugman, P. (2015).Macroeconomics (3rd ed.). London: Worth Publishers, pp. 102-103
Mankiw, G. (2016). Principles of Macroeconomics (6th ed.). London: Cengage Learning, pp.
114-116
6
⊘ This is a preview!⊘
Do you want full access?
Subscribe today to unlock all pages.

Trusted by 1+ million students worldwide
1 out of 6