Economic Data Analysis and Trade Openness in Argentina and El Salvador

Verified

Added on  2022/09/01

|7
|1829
|20
Report
AI Summary
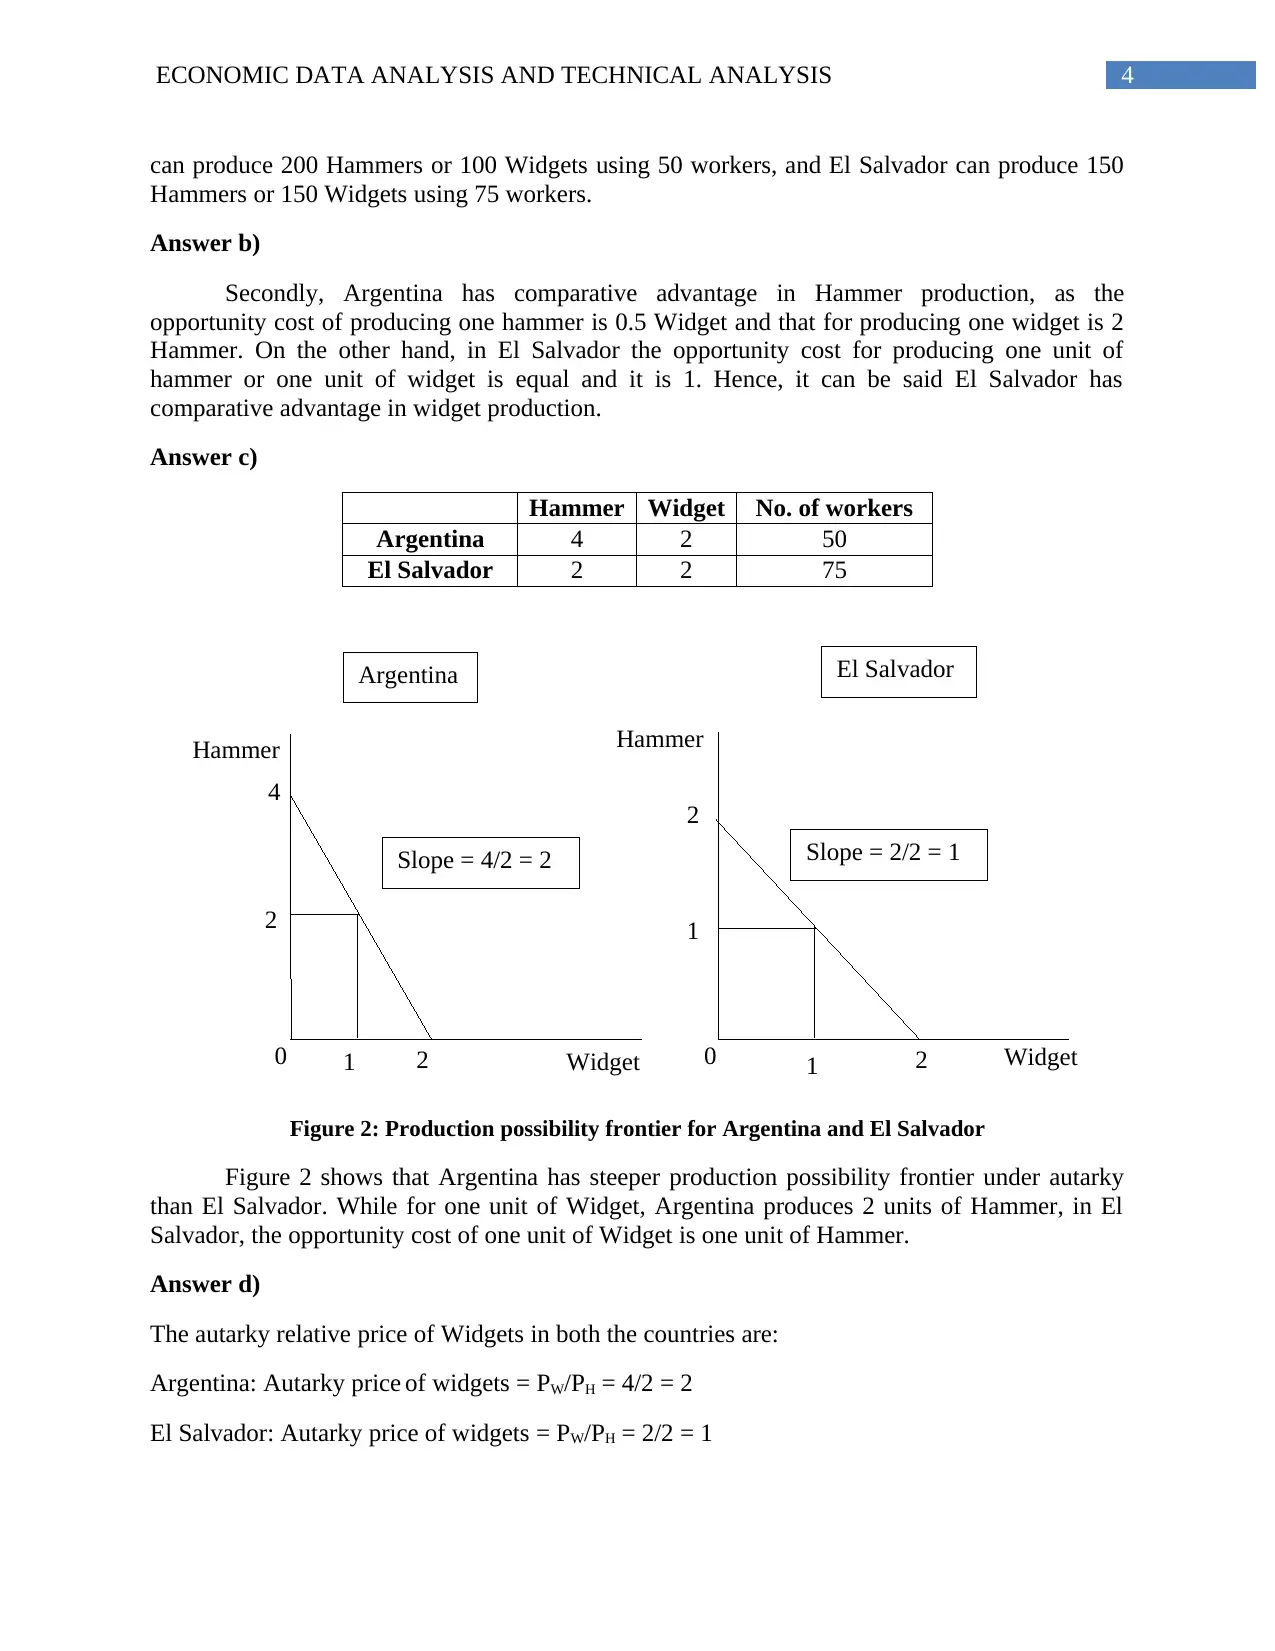
This report analyzes the trade openness of Argentina and El Salvador from 1998 to 2014, examining their trade-to-GDP ratios and economic development. The analysis utilizes data from the World Bank to calculate trade openness percentages and create visualizations. The report explores the correlation between trade openness and GDP per capita, revealing a positive correlation for El Salvador and a negative correlation for Argentina. A hypothetical scenario using a Ricardian model is evaluated to assess the implications of autarky, including the determination of absolute and comparative advantages, production possibility frontiers, and autarky relative prices for both countries. The report concludes with an evaluation of production and consumption under autarky.
Document Page
Running head: ECONOMIC DATA ANALYSIS AND TECHNICAL ANALYSIS
Economic Data Analysis and Technical Analysis
Name of the Student:
Name of the University:
Author note:
tabler-icon-diamond-filled.svg

Paraphrase This Document

Need a fresh take? Get an instant paraphrase of this document with our AI Paraphraser
Document Page
1ECONOMIC DATA ANALYSIS AND TECHNICAL ANALYSIS
A Simple Analysis of Trade Openness for Argentina and El Salvador
Argentina is the second largest economy after Brazil in the South American continent. It
is considered as an upper-middle income economy. On the other hand, El Salvador is a small
country located in the Central America. According to world, it is the smallest but the most
densely populated nation in the Central America region (Montgomery 2018). Within the period
of 1998 to 2014, both the countries have shown growth in their GDP (current US$), and while
GDP per capita for El Salvador has increased overtime, that of Argentina has gone through some
fluctuation, although it has shown an upward rising trend. In this report, a simple data analysis
has been conducted to get an overview of the trade openness of these countries, through the trade
openness calculation and charts showing the openness for both. The relationship between the
trade openness and the economic development has also been explored in the paper. Lastly, the
consequences that would follow if these countries were not open to international trade has been
discussed through the evaluation of a hypothetical scenario based on a simple Ricardian model.
Trade openness is also known as trade-to-GDP ratio. This indicates the relative
significance of the international trade in the economy and the degree of globalization and trade
liberalization can be interpreted from the trade openness percentage (Fujii 2019). It is calculated
by the following formula:
Exports+ Imports of goodsservices
GDP
The data about the exports, imports and GDP, all in current US$, for Argentina and El Salvador
from 1998 to 2014 were collected from the World Bank and the trade openness for the countries
were calculated using the above formula. It is presented in the table below:
Argentina Trade
openness (%)
El Salvador Trade
openness (%)
1998 23% 61%
1999 21% 61%
2000 23% 69%
2001 22% 66%
2002 42% 66%
2003 41% 68%
2004 41% 70%
2005 41% 70%
2006 40% 73%
2007 41% 78%
2008 40% 81%
2009 34% 66%
2010 35% 74%
2011 35% 79%
2012 31% 78%
2013 29% 80%
Document Page
2ECONOMIC DATA ANALYSIS AND TECHNICAL ANALYSIS
2014 28% 78%
Table 1: Trade openness for Argentina and El Salvador, 1998-2014
(Source: World Bank 2020)
Trade openness implies how much an economy is liberal towards international trade and how
much it is participating. Hence, trade openness is completely based on the trade flows, that is,
imports and exports of a nation and its ratio with the GDP (Fujii 2019). Therefore, to calculate
the trade openness, there is no other alternative method than to use trade flows of the countries.
Figure 1: Trade openness for Argentina and El Salvador, 1998-2014
(Source: World Bank 2020)
From the above figure, it is observed that the level of trade openness was much higher in El
Salvador than in Argentina during the entire period under consideration. The trade-to-GDP ratio
was always more than 60% in El Salvador while that for Argentina varied between 21% and
42%. The Argentine economy faced a great depression between 1998 and 2002 and the currency
depreciated. Level of imports fell to almost half and to recover from this, the trade openness was
increased by the Argentine government. On the other hand, the level of GDP in El Salvador was
quite low compared to Argentina and as the size of the economy is small. The trade
encouragement for the economic benefit has pushed the openness for El Salvador higher and it
reached 81% in 2008 during the global financial crisis, which implied a very high level of export
and import for the country. In the next few years till 2014, while the participation level in the
international trade increased for El Salvador, that for Argentina has gone down slightly. Another
Document Page
3ECONOMIC DATA ANALYSIS AND TECHNICAL ANALYSIS
reason for higher trade openness ratio in El Salvador can be identified as the lower level of GDP
and higher dependence on trade, while Argentina’s GDP has been higher compared to El
Salvador, which makes the ratio value for trade openness lower.
GDP per capita is considered as an indicator of economic development. The higher is the
GDP per capita, higher the disposable income of the residents of a country. This leads to higher
demand, and higher expenditure in the economy resulting in economic development (Fetahi-
Vehapi, Sadiku and Petkovski 2015). Trade openness has positive impact on economic growth of
a nation by increasing trade volume as well as increasing domestic production of those products
in which the country has comparative advantage (Keho 2017). From the data on GDP per capita,
it has been observed that from 1998 to 2014, the GDP per capita has increased steadily in El
Salvador, however, in Argentina, it fell significantly during the 2002 depression, but 2003
onwards, it has increased quite substantially.
To evaluate the relationship between trade openness and GDP per capita, correlation has
been performed for both the countries and the correlation coefficients are given below:
Argentina El Salvador
Correlation coefficient -0.421 0.862
Table 2: Correlation between trade openness and GDP per capita
It can be seen that the trade openness and GDP per capita, that is, economic development is
positively correlated in case of El Salvador. The coefficient value is 0.862, which is much closer
of +1 and it indicates that the relationship between these two indicators is quite strong. These
factors are working together to achieve a higher GDP for El Salvador.
On the other hand, the correlation coefficient for Argentina shows a negative value
indicating a negative correlation between trade openness and GDP per capita, that is, economic
development. The coefficient value is -0.421, indicating a moderately weak negative relationship
between the variables. According to HuchetBourdon, Le Mouël and Vijil (2018), trade might
affect economic growth of a country negatively if it specialized in low quality products. It has
also been described that the domestic market size often has an influence on the trade openness
and in many cases, large domestic markets in some developing economies have resulted in a
negative relationship between trade openness and GDP per capita (Arif, Kazmi and Khan 2017).
Thus, from the negative correlation coefficient for Argentina, it can be inferred that due to large
size of the economy and larger population, trade openness and economic development have
negative relationship.
Analysis of a situation under autarky
Answer a)
In the situation under autarky, Argentina has absolute advantage in Hammer production
and El Salvador has absolute advantage in Widget production, due to the reasons that Argentina
tabler-icon-diamond-filled.svg

Paraphrase This Document

Need a fresh take? Get an instant paraphrase of this document with our AI Paraphraser
Document Page
4ECONOMIC DATA ANALYSIS AND TECHNICAL ANALYSIS
Hammer Hammer
Argentina El Salvador
Widget Widget2
2
2 00
4
1
1
1
2
Slope = 4/2 = 2 Slope = 2/2 = 1
can produce 200 Hammers or 100 Widgets using 50 workers, and El Salvador can produce 150
Hammers or 150 Widgets using 75 workers.
Answer b)
Secondly, Argentina has comparative advantage in Hammer production, as the
opportunity cost of producing one hammer is 0.5 Widget and that for producing one widget is 2
Hammer. On the other hand, in El Salvador the opportunity cost for producing one unit of
hammer or one unit of widget is equal and it is 1. Hence, it can be said El Salvador has
comparative advantage in widget production.
Answer c)
Hammer Widget No. of workers
Argentina 4 2 50
El Salvador 2 2 75
Figure 2: Production possibility frontier for Argentina and El Salvador
Figure 2 shows that Argentina has steeper production possibility frontier under autarky
than El Salvador. While for one unit of Widget, Argentina produces 2 units of Hammer, in El
Salvador, the opportunity cost of one unit of Widget is one unit of Hammer.
Answer d)
The autarky relative price of Widgets in both the countries are:
Argentina: Autarky price of widgets = PW/PH = 4/2 = 2
El Salvador: Autarky price of widgets = PW/PH = 2/2 = 1
Document Page
5ECONOMIC DATA ANALYSIS AND TECHNICAL ANALYSIS
Answer e)
` Under autarky, as the consumers in both the countries spend half income on Hammer and
rest of the half on Widgets, hence the optimal consumption and production would be the quantity
determined from the autarky relative price. Therefore, in Argentina, there should be 2 units of
Hammer and 1 unit of Widget and in El Salvador, there should 1 unit of Hammer and 1 unit of
Widget.
Document Page
6ECONOMIC DATA ANALYSIS AND TECHNICAL ANALYSIS
References
Arif, I., Kazmi, S.W. and Khan, L., 2017. Relationship between trade openness and energy
consumption in oil importing Asian countries. Journal of Finance & Economics Research, 2(1),
pp.37-53.
Fetahi-Vehapi, M., Sadiku, L. and Petkovski, M., 2015. Empirical analysis of the effects of trade
openness on economic growth: An evidence for South East European Countries. Procedia
Economics and Finance, 19(2015), pp.17-26.
Fujii, E., 2019. What does trade openness measure?. Oxford Bulletin of Economics and
Statistics, 81(4), pp.868-888.
HuchetBourdon, M., Le Mouël, C. and Vijil, M., 2018. The relationship between trade openness
and economic growth: Some new insights on the openness measurement issue. The World
Economy, 41(1), pp.59-76.
Keho, Y., 2017. The impact of trade openness on economic growth: The case of Cote
d’Ivoire. Cogent Economics & Finance, 5(1), p.1332820.
Montgomery, T.S., 2018. Revolution in El Salvador: From civil strife to civil peace. Routledge.
World Bank, 2020. World Bank Data. [online] Available at: <https://data.worldbank.org/>
[Accessed 27 March 2020].
chevron_up_icon
1 out of 7
circle_padding
hide_on_mobile
zoom_out_icon
[object Object]