Analyzing Impact of Trade Policies & AD Curve Shifts in Australia

Verified

Added on  2021/06/18

|7
|1393
|105
Homework Assignment
AI Summary
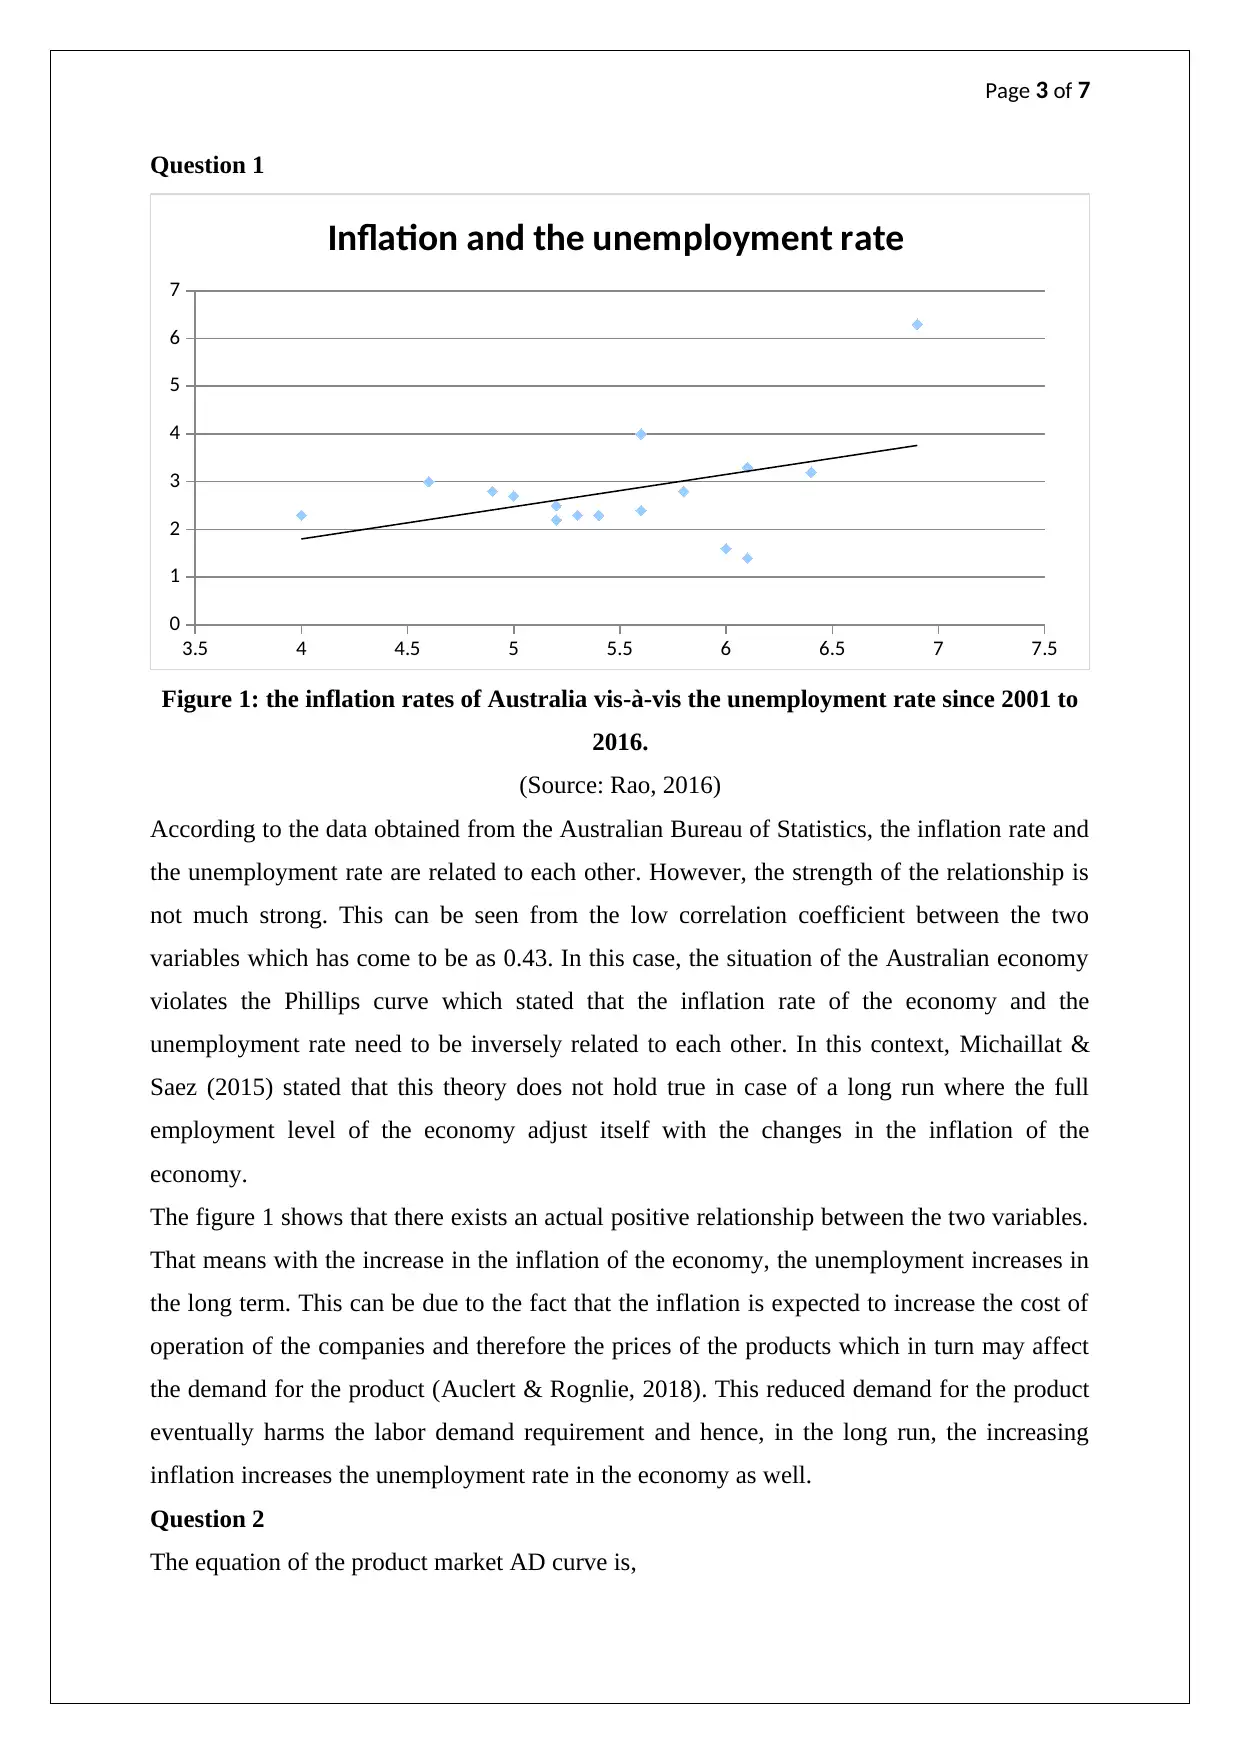
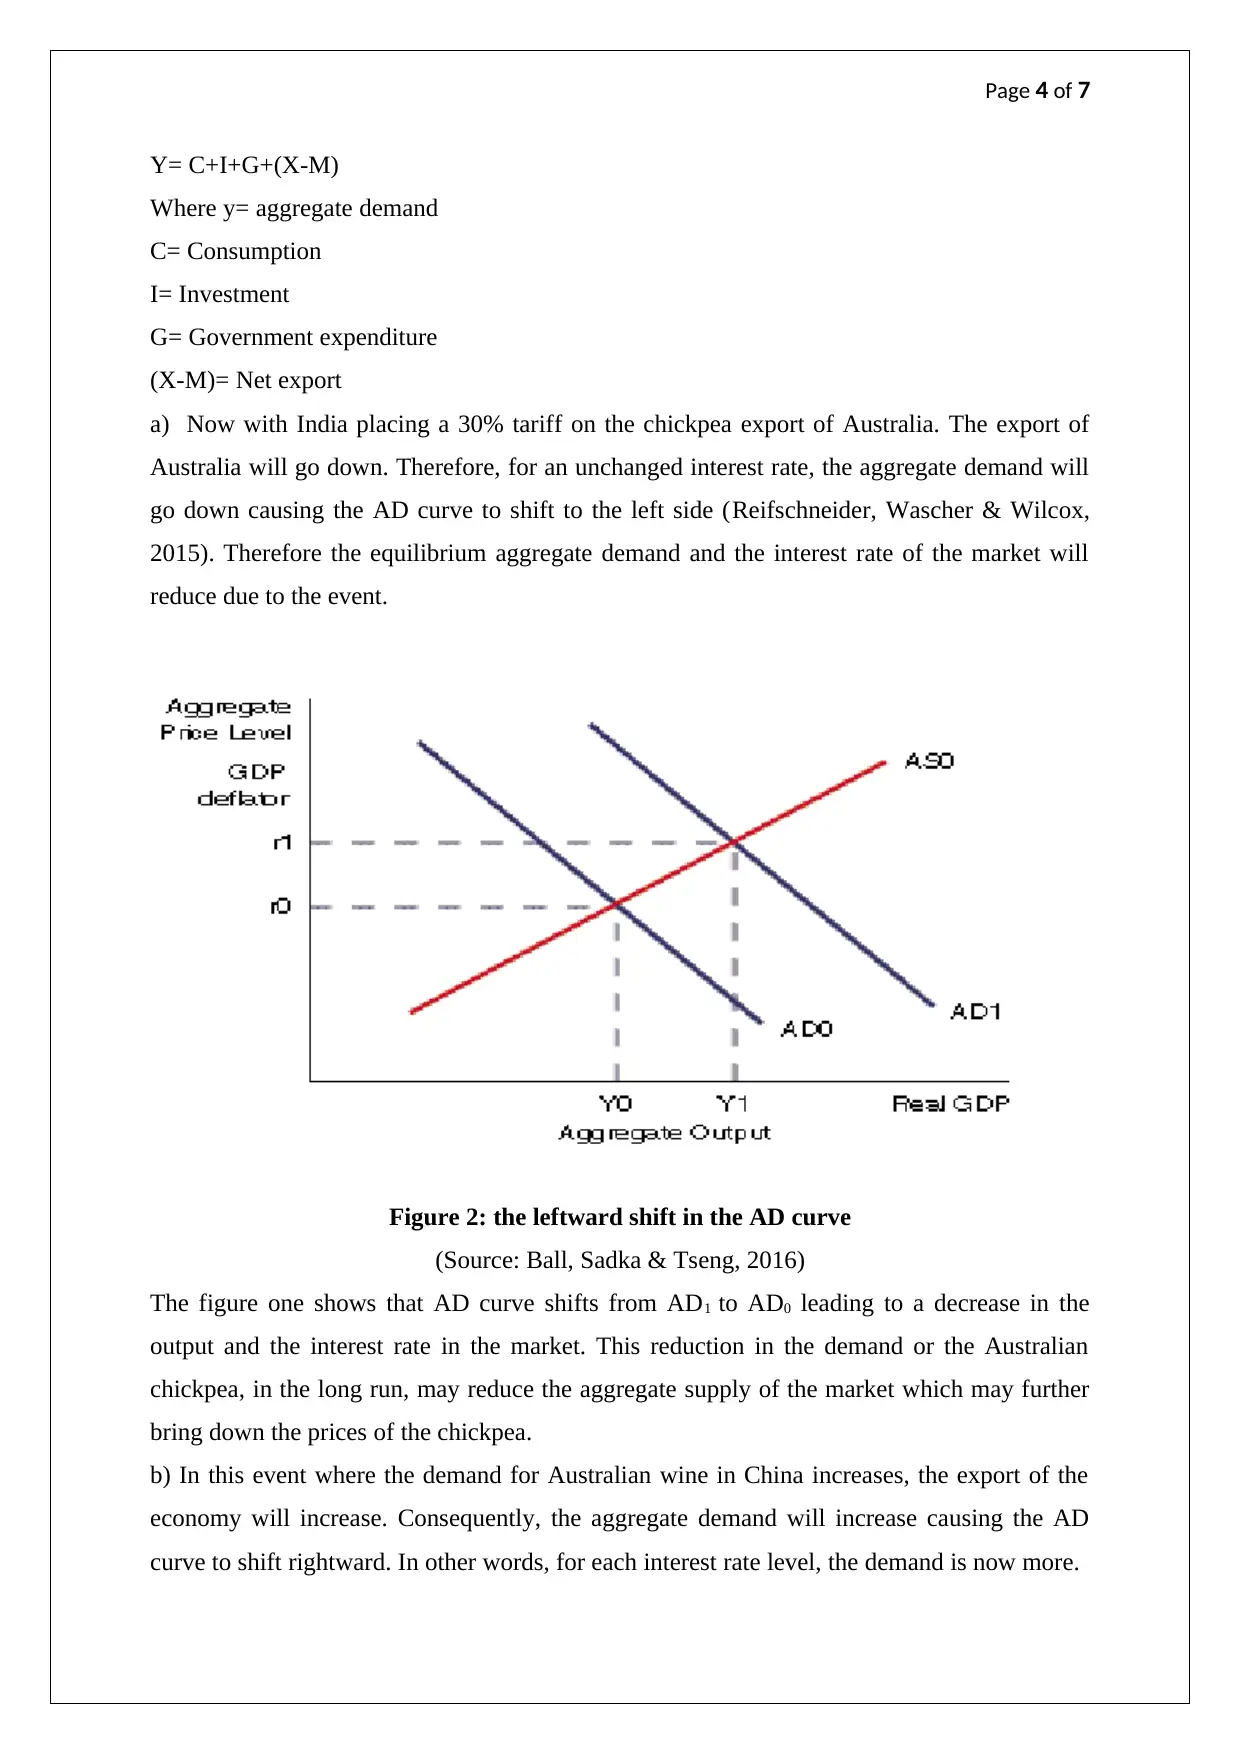
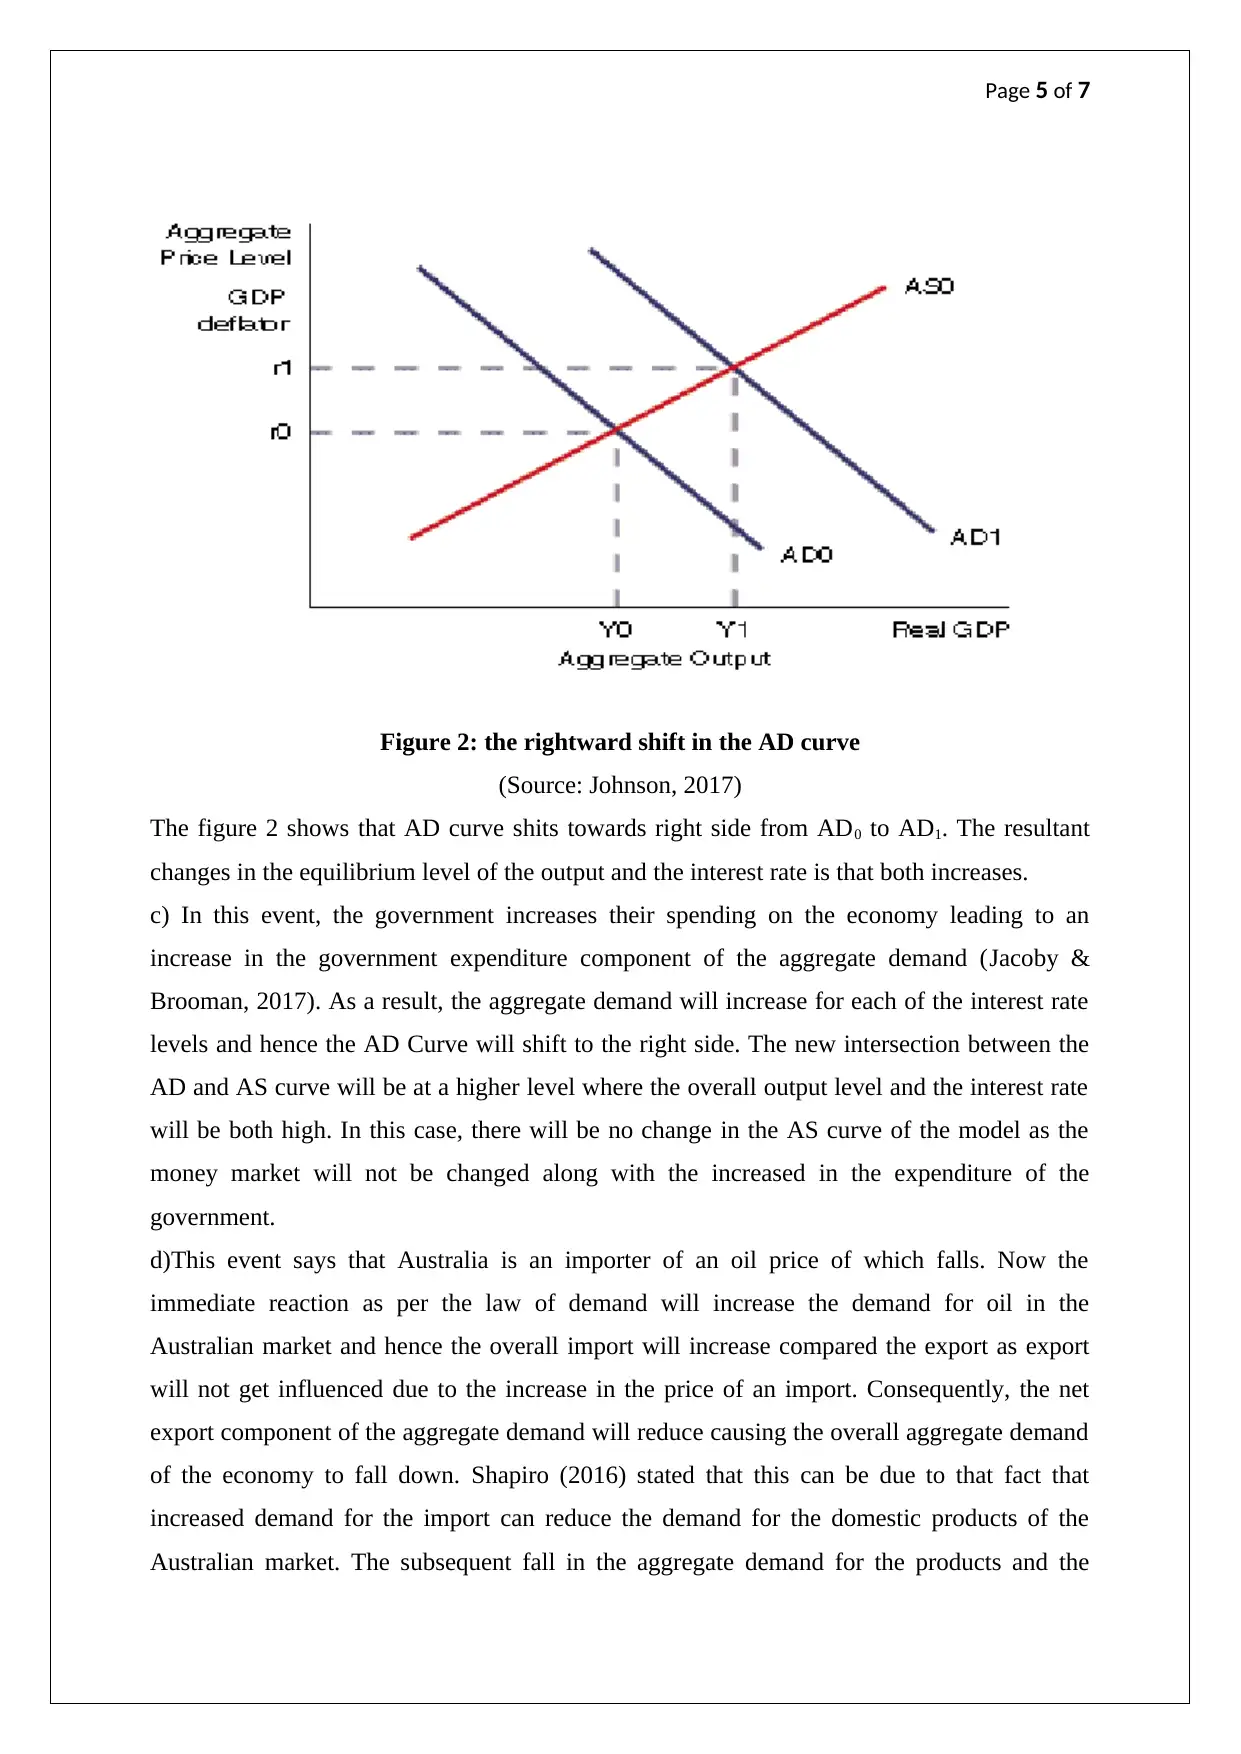
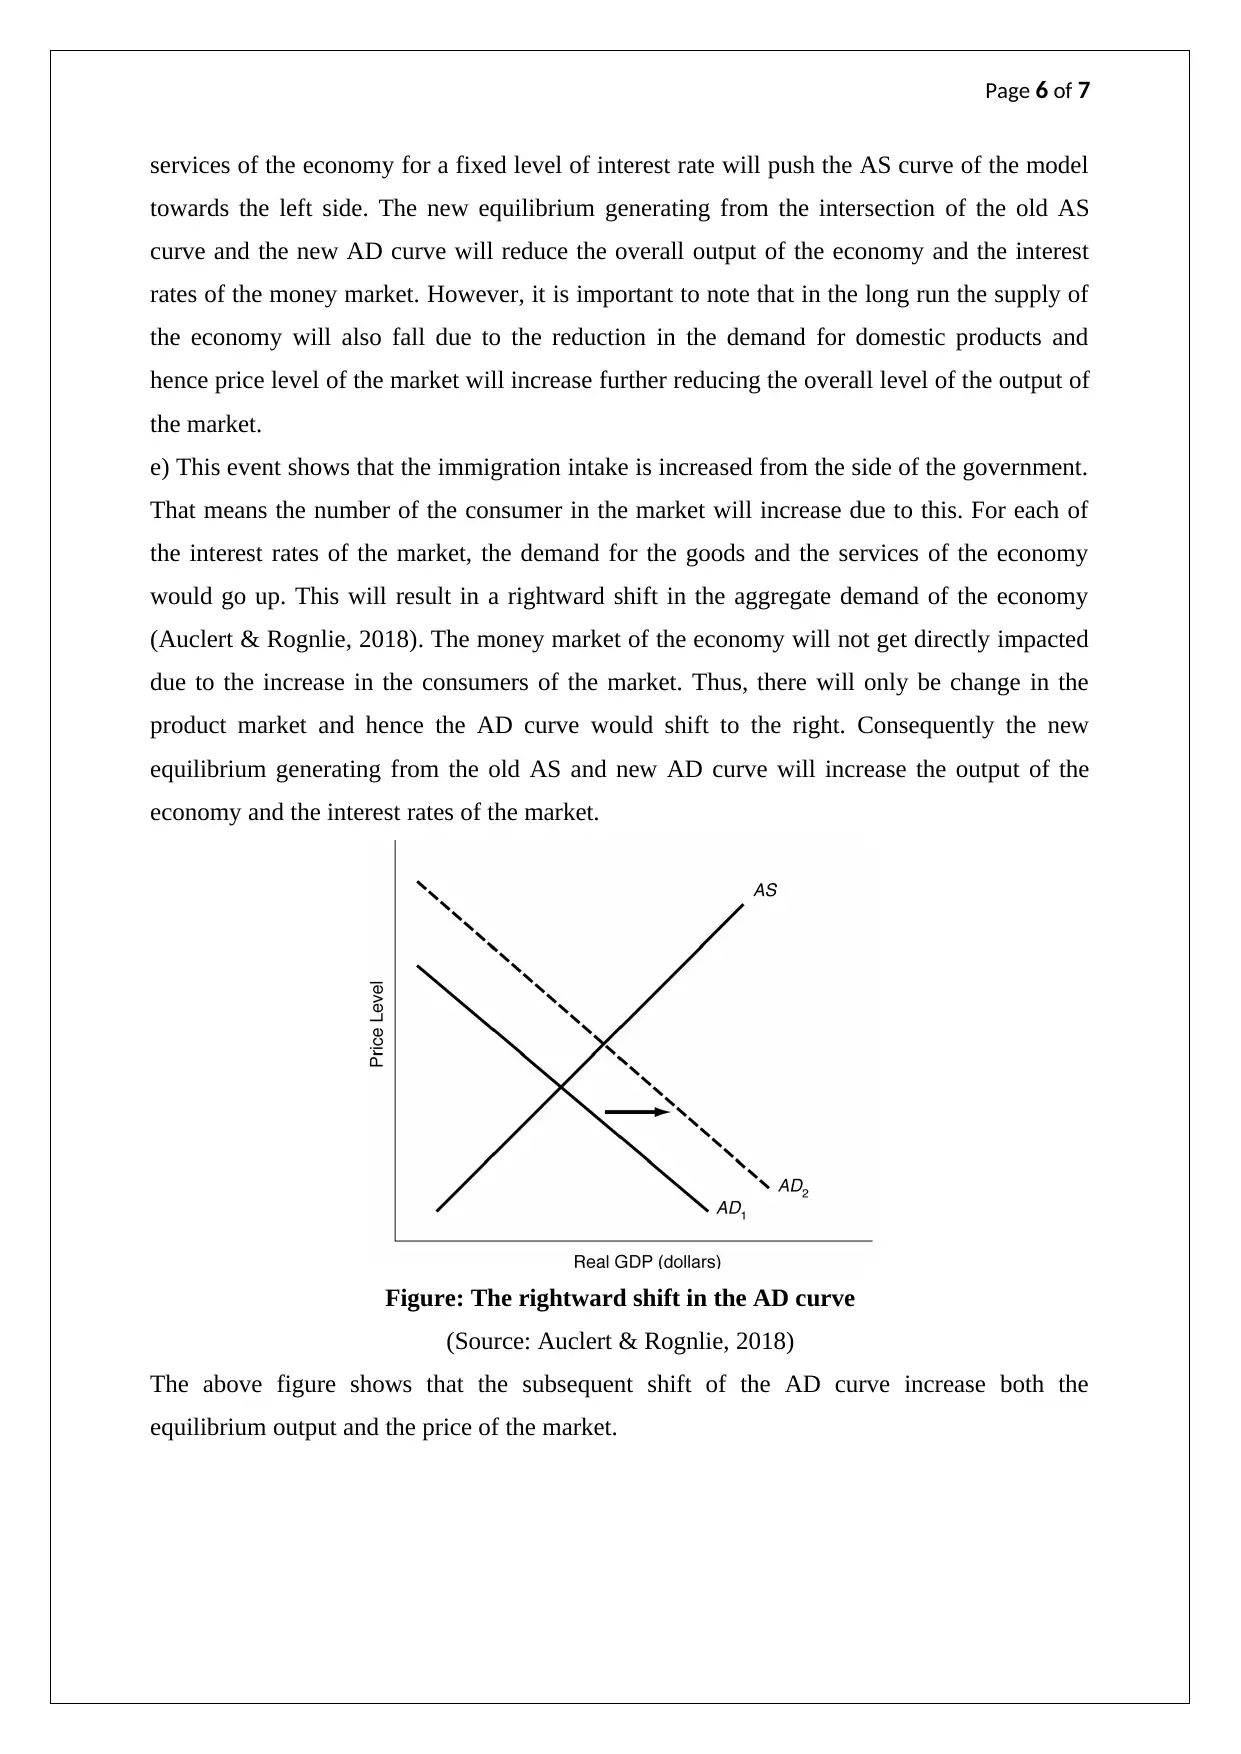
This assignment analyzes the relationship between inflation and unemployment in Australia, examining the validity of the Phillips curve. It explores the impact of various trade policies and economic events on Australia's aggregate demand (AD) curve. The analysis covers scenarios such as India's tariff on Australian chickpea exports, increased demand for Australian wine in China, increased government spending, falling oil prices, and increased immigration intake. Each scenario is evaluated for its effect on the AD curve, equilibrium output, and interest rates, providing a comprehensive understanding of macroeconomic dynamics in the Australian context. Desklib provides access to this solved assignment and other study resources for students.
Document Page
Page 1 of 7
ECONOMIC ASSIGNMENT
tabler-icon-diamond-filled.svg

Paraphrase This Document

Need a fresh take? Get an instant paraphrase of this document with our AI Paraphraser
Document Page
Page 2 of 7
Table of contents
Question 1..................................................................................................................................3
Question 2..................................................................................................................................4
Reference....................................................................................................................................8
Document Page
Page 3 of 7
Question 1
3.5 4 4.5 5 5.5 6 6.5 7 7.5
0
1
2
3
4
5
6
7
Inflation and the unemployment rate
Figure 1: the inflation rates of Australia vis-à-vis the unemployment rate since 2001 to
2016.
(Source: Rao, 2016)
According to the data obtained from the Australian Bureau of Statistics, the inflation rate and
the unemployment rate are related to each other. However, the strength of the relationship is
not much strong. This can be seen from the low correlation coefficient between the two
variables which has come to be as 0.43. In this case, the situation of the Australian economy
violates the Phillips curve which stated that the inflation rate of the economy and the
unemployment rate need to be inversely related to each other. In this context, Michaillat &
Saez (2015) stated that this theory does not hold true in case of a long run where the full
employment level of the economy adjust itself with the changes in the inflation of the
economy.
The figure 1 shows that there exists an actual positive relationship between the two variables.
That means with the increase in the inflation of the economy, the unemployment increases in
the long term. This can be due to the fact that the inflation is expected to increase the cost of
operation of the companies and therefore the prices of the products which in turn may affect
the demand for the product (Auclert & Rognlie, 2018). This reduced demand for the product
eventually harms the labor demand requirement and hence, in the long run, the increasing
inflation increases the unemployment rate in the economy as well.
Question 2
The equation of the product market AD curve is,
Document Page
Page 4 of 7
Y= C+I+G+(X-M)
Where y= aggregate demand
C= Consumption
I= Investment
G= Government expenditure
(X-M)= Net export
a) Now with India placing a 30% tariff on the chickpea export of Australia. The export of
Australia will go down. Therefore, for an unchanged interest rate, the aggregate demand will
go down causing the AD curve to shift to the left side (Reifschneider, Wascher & Wilcox,
2015). Therefore the equilibrium aggregate demand and the interest rate of the market will
reduce due to the event.
Figure 2: the leftward shift in the AD curve
(Source: Ball, Sadka & Tseng, 2016)
The figure one shows that AD curve shifts from AD1 to AD0 leading to a decrease in the
output and the interest rate in the market. This reduction in the demand or the Australian
chickpea, in the long run, may reduce the aggregate supply of the market which may further
bring down the prices of the chickpea.
b) In this event where the demand for Australian wine in China increases, the export of the
economy will increase. Consequently, the aggregate demand will increase causing the AD
curve to shift rightward. In other words, for each interest rate level, the demand is now more.
tabler-icon-diamond-filled.svg

Paraphrase This Document

Need a fresh take? Get an instant paraphrase of this document with our AI Paraphraser
Document Page
Page 5 of 7
Figure 2: the rightward shift in the AD curve
(Source: Johnson, 2017)
The figure 2 shows that AD curve shits towards right side from AD0 to AD1. The resultant
changes in the equilibrium level of the output and the interest rate is that both increases.
c) In this event, the government increases their spending on the economy leading to an
increase in the government expenditure component of the aggregate demand (Jacoby &
Brooman, 2017). As a result, the aggregate demand will increase for each of the interest rate
levels and hence the AD Curve will shift to the right side. The new intersection between the
AD and AS curve will be at a higher level where the overall output level and the interest rate
will be both high. In this case, there will be no change in the AS curve of the model as the
money market will not be changed along with the increased in the expenditure of the
government.
d)This event says that Australia is an importer of an oil price of which falls. Now the
immediate reaction as per the law of demand will increase the demand for oil in the
Australian market and hence the overall import will increase compared the export as export
will not get influenced due to the increase in the price of an import. Consequently, the net
export component of the aggregate demand will reduce causing the overall aggregate demand
of the economy to fall down. Shapiro (2016) stated that this can be due to that fact that
increased demand for the import can reduce the demand for the domestic products of the
Australian market. The subsequent fall in the aggregate demand for the products and the
Document Page
Page 6 of 7
services of the economy for a fixed level of interest rate will push the AS curve of the model
towards the left side. The new equilibrium generating from the intersection of the old AS
curve and the new AD curve will reduce the overall output of the economy and the interest
rates of the money market. However, it is important to note that in the long run the supply of
the economy will also fall due to the reduction in the demand for domestic products and
hence price level of the market will increase further reducing the overall level of the output of
the market.
e) This event shows that the immigration intake is increased from the side of the government.
That means the number of the consumer in the market will increase due to this. For each of
the interest rates of the market, the demand for the goods and the services of the economy
would go up. This will result in a rightward shift in the aggregate demand of the economy
(Auclert & Rognlie, 2018). The money market of the economy will not get directly impacted
due to the increase in the consumers of the market. Thus, there will only be change in the
product market and hence the AD curve would shift to the right. Consequently the new
equilibrium generating from the old AS and new AD curve will increase the output of the
economy and the interest rates of the market.
Figure: The rightward shift in the AD curve
(Source: Auclert & Rognlie, 2018)
The above figure shows that the subsequent shift of the AD curve increase both the
equilibrium output and the price of the market.
Document Page
Page 7 of 7
Reference
Auclert, A., & Rognlie, M. (2018). Inequality and aggregate demand (No. w24280). National
Bureau of Economic Research.
Ball, R., Sadka, G., & Tseng, A. (2016). Aggregate Supply and Demand Shocks and Asset
Prices.
Jacoby, H. D., & Brooman, F. S. (2017). Prices, Wages, and Aggregate Supply.
In Foundations of Macroeconomics (pp. 232-251). Routledge.
Johnson, H. G. (2017). Macroeconomics and monetary theory. Routledge.
Michaillat, P., & Saez, E. (2015). Aggregate demand, idle time, and unemployment. The
Quarterly Journal of Economics, 130(2), 507-569.
Rao, B. B. (Ed.). (2016). Aggregate demand and supply: A critique of orthodox
macroeconomic modelling. Springer.
Reifschneider, D., Wascher, W., & Wilcox, D. (2015). Aggregate supply in the United States:
recent developments and implications for the conduct of monetary policy. IMF
Economic Review, 63(1), 71-109.
Shapiro, M. D. (2016). Supply shocks in macroeconomics (pp. 1-7). Palgrave Macmillan UK.
chevron_up_icon
1 out of 7
circle_padding
hide_on_mobile
zoom_out_icon
[object Object]