Longitudinal Study of Traffic Accidents Due to Driving Behaviour
VerifiedAdded on 2023/06/11
|10
|2359
|78
Report
AI Summary
This report presents a longitudinal study conducted over three years, involving 38,681 university students across four states (NSW, Victoria, Queensland, and ACT), to investigate the relationship between driving behavior and road traffic accidents (RTAs). The study used self-reported data and the Donovan scale to assess driver aggression, thrill-seeking, and risk acceptance. Key findings indicate that increased age correlates with decreased accident propensity, while international students showed a higher risk. Driver aggression had the most significant impact on RTAs, and students driving more than 10 km/week were involved in fewer accidents. The study highlights the importance of addressing driving behavior to reduce RTAs among young drivers, acknowledging the limitation of self-reported data. Desklib provides access to similar studies and resources for students.
Medical Journal of Australia Manuscript submission template
Type of article
See Types of articles published by the MJA
[Research Report]
Title: [A Self-Reported Longitudinal Study of traffic accidents amongst university
students caused due to driving behaviour]
Abstract
Articles requiring a descriptive 15-word introductory line are: Editorials, and Perspectives.
Articles requiring short (50-word) unstructured abstracts are: Notable cases (abstract should state the
general area of relevance, describe the specific nature of the case, and point out the
relevance/implications for clinical practice or health policy).
Articles requiring 4–6 bullet-point) summaries are: Clinical focus article including narrative review.
Articles requiring structured abstracts are:
Research reports (use the headings: Objectives, Design, Setting, Participants, Main outcome
measures, Results, Conclusions and Trial registration [if applicable]) and
Systematic reviews (use the headings: Objective, Study design, Data sources, Study selection, Data
extraction, Data synthesis, Conclusions).
Abstract word count [113]
[
A cohort study was conducted to evaluate the influence of socio-demographic profile of
university students on RTAs. The study involved a 3-year longitudinal study. The study was
done in the four states of NSW, Victoria, Queensland and ACT. Most of the students involved
in the study were18 years of age at the time of enrolment. The study found that the driving
behaviour of the student was responsible for RTA. In addition, international students had a
higher inclination to take risks. With increase in the age of the students the frequency of
RTAs decreases. Driver Aggression is the most important reason for RTA. Risk Acceptance
of the students provides the least influence on RTA.
]
See over
Paraphrase This Document
Need a fresh take? Get an instant paraphrase of this document with our AI Paraphraser
Text
Research reports should be written in IMRAD format (Introduction, Methods, Results and
Discussion).
Case reports should comprise a Clinical record followed by a Discussion.
Text word count [986]
[
Introduction
The study highlights the increase in the major injuries from year 2001-2010 with an increase
of 0.9% based on road traffic crashes. The reason is primarily due to young drivers that are
involved in the serious road accidents (1). 1.1% of the injured people not only have threat to
life but due to risky driving are in constant fear. The factors that lead to these accidents are
alcohol, fatigued driving and rash driving (2,3). Also, many take risks and can be a chief
provider to morbidity and mortality. Many drivers wish to add excitement and thrill to driving
which is one of the causes of reckless behaviour and is common in the university students. As
per researchers, the thrill is the main cause of sensation but there is still no stance where road
crash is related to risky driving (4).
The aggressive behaviour is because of the different vehicles driven by the driver the
exposure to injury (5). However, the car driver believed that this due to the proneness to the
behaviour and the challenging behaviours of taking risks. On the whole, some kind of
enforcement like parental enforcement is maintained due to time and age bracket of the
individuals that seek excitement and thrill (6).
The self reported exercise has been done amongst the university students. The study has been
addressed on a three year basis on the traffic accidents that had occurred in the time span.
This is evaluated on the act of thrill and excitement of driving involving traffic accidents on
road.
Methods
University Students (N = 38681) were enrolled for a longitudinal study of 3-years to
investigate the causes of road accidents. Students below the age of 18 years were excluded
from the study. Self-reported incidence of road traffic accidents was used as the method of
reporting. The study was spread across the four states of NSW, Victoria, NSW and ACT. The
behaviour of the students during driving was evaluated. The incidence of increase in road
accidents due to aggression was weighed against thrill seeking and risk acceptance. The
behaviour of the students was measured using the Donovan scale.
Variables and instruments
Self-reporting of road traffic accidents was used to assess the incidence of accidents. The
behaviour of the students was measured using the Donovan scale. The driver aggression was
evaluated using Donovan Scale of behaviour. The Scale scored aggression from 0 to 15 (Low
to high). The Thrill Seeking behaviour was evaluated using Donovan Scale of behaviour. The
See over
Scale scored aggression from 0 to 7 (Low to high). Risk acceptance of the driver used a scale
of 0 to 16 (low to high).
Ethics Approval
The study protocols were approved by the ACU Ethical Research Committee.
Demographic Profile
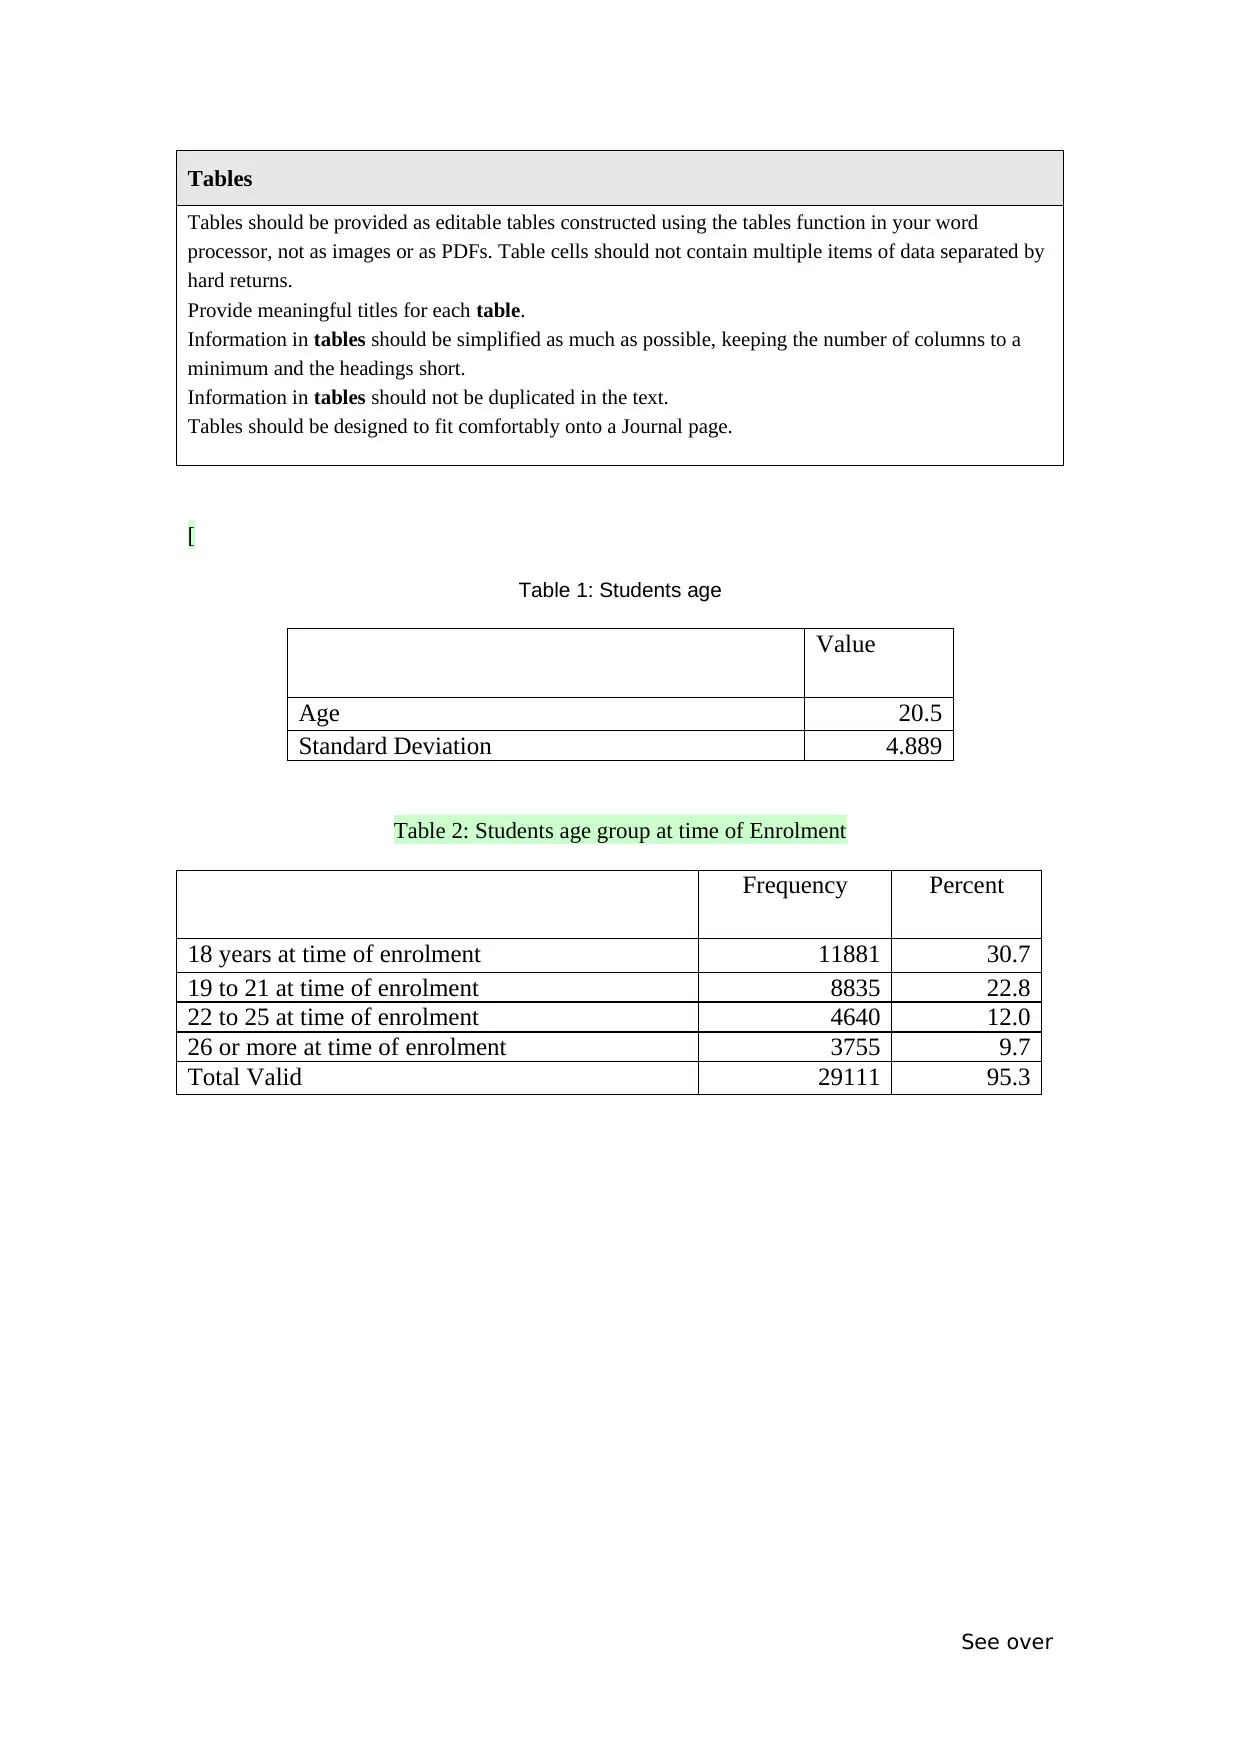
The total number of students enrolled for the study was 38681. The mean age of the students
was 20.50 years with a standard deviation of 4.889 (Table 1). 30.7% of the students were
aged 18 during enrolment (Table 2). 73% of the students were females and the rest were
males. The maximum percentage, 41.0 and 35.1% were from NSW and Victoria respectively.
89.5% of the student’s single degree courses. 89.9% of the students were full time students.
70.4% students lived in metros. 53.9% of the students stayed at home during the course of
study (Table 3).
Findings
The driving behaviour of the students (aggression, thrill seeking and risk acceptance) were
analysed for differences in gender, metro, study mode and RTA. The study that there no
significant differences between males and females in aggression (sig = 0.934), thrill seeking
(sig = 0.711) and risk acceptance (0.116). Similarly, there was no significant differences in
metropolitan background status for driving behaviour of students (sig > 0.05). However, it is
found that there are significant differences in study mode and risk acceptance of students (sig
= 0.023). Moreover, it is found that there is statistically significant differences in RTA and
driving behaviour between the students (sig < 0.000) (Table 4).
Further studies showed that there are statistically no significant differences in depression and
Gender of the students at 0.05 level of significance (sig = 0.597) (Table 5). Similarly, the
study found no significant differences in metropolitan background of the students and
depression (sig = 0.736). The level of depression of the students did not vary with the study
mode of the students (sig = 0.080) (Table 5).
The demographic profile of the students, driving distance in a week and driving behaviour
were used to predict the incidence of Road traffic accidents. The study found that age
category (sig = 0.000) and fee status (sig = 0.000) have a statistically significant impact on
RTA of a student. With the increase in age there is a decrease in propensity for accidents (b =
-0.171). However, the study found that international students have a higher propensity
towards RTA than domestic students (B = 0.231). The living arrangement of the students did
not have a statistically significant impact on RTA (sig > 0.000) (Table 6).
The study found that students who drove more than 10 km/ week were involved in lesser
number of RTA (Table 7).
In addition, RTA was found to significantly influenced by aggression, thrill seeking and risk
acceptance attitude of the students (Table 8). The aggression of the students was found to
have the highest impact on RTS (B = 0.612). On the other hand, Thrill seeking attitude of the
students was found to have the least impact on RTA (B = 0.516).
Discussion
See over
of 0 to 16 (low to high).
Ethics Approval
The study protocols were approved by the ACU Ethical Research Committee.
Demographic Profile
The total number of students enrolled for the study was 38681. The mean age of the students
was 20.50 years with a standard deviation of 4.889 (Table 1). 30.7% of the students were
aged 18 during enrolment (Table 2). 73% of the students were females and the rest were
males. The maximum percentage, 41.0 and 35.1% were from NSW and Victoria respectively.
89.5% of the student’s single degree courses. 89.9% of the students were full time students.
70.4% students lived in metros. 53.9% of the students stayed at home during the course of
study (Table 3).
Findings
The driving behaviour of the students (aggression, thrill seeking and risk acceptance) were
analysed for differences in gender, metro, study mode and RTA. The study that there no
significant differences between males and females in aggression (sig = 0.934), thrill seeking
(sig = 0.711) and risk acceptance (0.116). Similarly, there was no significant differences in
metropolitan background status for driving behaviour of students (sig > 0.05). However, it is
found that there are significant differences in study mode and risk acceptance of students (sig
= 0.023). Moreover, it is found that there is statistically significant differences in RTA and
driving behaviour between the students (sig < 0.000) (Table 4).
Further studies showed that there are statistically no significant differences in depression and
Gender of the students at 0.05 level of significance (sig = 0.597) (Table 5). Similarly, the
study found no significant differences in metropolitan background of the students and
depression (sig = 0.736). The level of depression of the students did not vary with the study
mode of the students (sig = 0.080) (Table 5).
The demographic profile of the students, driving distance in a week and driving behaviour
were used to predict the incidence of Road traffic accidents. The study found that age
category (sig = 0.000) and fee status (sig = 0.000) have a statistically significant impact on
RTA of a student. With the increase in age there is a decrease in propensity for accidents (b =
-0.171). However, the study found that international students have a higher propensity
towards RTA than domestic students (B = 0.231). The living arrangement of the students did
not have a statistically significant impact on RTA (sig > 0.000) (Table 6).
The study found that students who drove more than 10 km/ week were involved in lesser
number of RTA (Table 7).
In addition, RTA was found to significantly influenced by aggression, thrill seeking and risk
acceptance attitude of the students (Table 8). The aggression of the students was found to
have the highest impact on RTS (B = 0.612). On the other hand, Thrill seeking attitude of the
students was found to have the least impact on RTA (B = 0.516).
Discussion
See over
⊘ This is a preview!⊘
Do you want full access?
Subscribe today to unlock all pages.
Trusted by 1+ million students worldwide
The study found that with increase in age there is decrease in propensity of RTA. This is
corroborated by study done Svetina (7).
The study found that RTAs are dependent on driving behaviour of the students. This is
corroborated by (8). The influence of driver aggression, risk acceptance and thrill seeking
attitude has been found to strongly influence road traffic accidents.
The limitation of the study is the Self-reported nature of the study.
]
See over
Paraphrase This Document
Need a fresh take? Get an instant paraphrase of this document with our AI Paraphraser
References
References should be in Vancouver style and should not appear as endnotes.
References to material on the Internet should include the organisation, the page title, the article title and
the author (if there is one) as well as the URL and the month the page was visited (see examples here).
[
(1) Bogstrand ST, Larsson M, Holtan A, Staff T, Vindenes V, Gjerde H.
Associations between driving under the influence of alcohol or drugs,
speeding and seatbelt use among fatally injured car drivers in Norway.
Accident Analysis & Prevention. 2015 May 1;78:14-9.
(2) Weiss HB, Kaplan S, Prato CG. Analysis of factors associated with injury
severity in crashes involving young New Zealand drivers. Accident Analysis
& Prevention. 2014 Apr 1;65:142-55.
(3) Bates LJ, Davey J, Watson B, King MJ, Armstrong K. Factors contributing to
crashes among young drivers. Sultan Qaboos university medical journal. 2014
Aug;14(3):e297.
(4) Sagberg F, Selpi, Bianchi Piccinini GF, Engström J. A review of research on
driving styles and road safety. Human factors. 2015 Nov;57(7):1248-75.
(5) Redshaw S. In the company of cars: Driving as a social and cultural practice.
CRC Press; 2017 Sep 29.
(6) Caird JK, Johnston KA, Willness CR, Asbridge M, Steel P. A meta-analysis of
the effects of texting on driving. Accident Analysis & Prevention. 2014 Oct
1;71:311-8.
(7) Svetina M. The reaction times of drivers aged 20 to 80 during a divided
attention driving. Traffic injury prevention. 2016 Nov 16;17(8):810-4.
(8) Zhang T, Chan AH. The association between driving anger and driving
outcomes: A meta-analysis of evidence from the past twenty years. Accident
Analysis & Prevention. 2016 May 1;90:50-62.
]
See over
Tables
Tables should be provided as editable tables constructed using the tables function in your word
processor, not as images or as PDFs. Table cells should not contain multiple items of data separated by
hard returns.
Provide meaningful titles for each table.
Information in tables should be simplified as much as possible, keeping the number of columns to a
minimum and the headings short.
Information in tables should not be duplicated in the text.
Tables should be designed to fit comfortably onto a Journal page.
[
Table 1: Students age
Value
Age 20.5
Standard Deviation 4.889
Table 2: Students age group at time of Enrolment
Frequency Percent
18 years at time of enrolment 11881 30.7
19 to 21 at time of enrolment 8835 22.8
22 to 25 at time of enrolment 4640 12.0
26 or more at time of enrolment 3755 9.7
Total Valid 29111 95.3
See over
⊘ This is a preview!⊘
Do you want full access?
Subscribe today to unlock all pages.
Trusted by 1+ million students worldwide
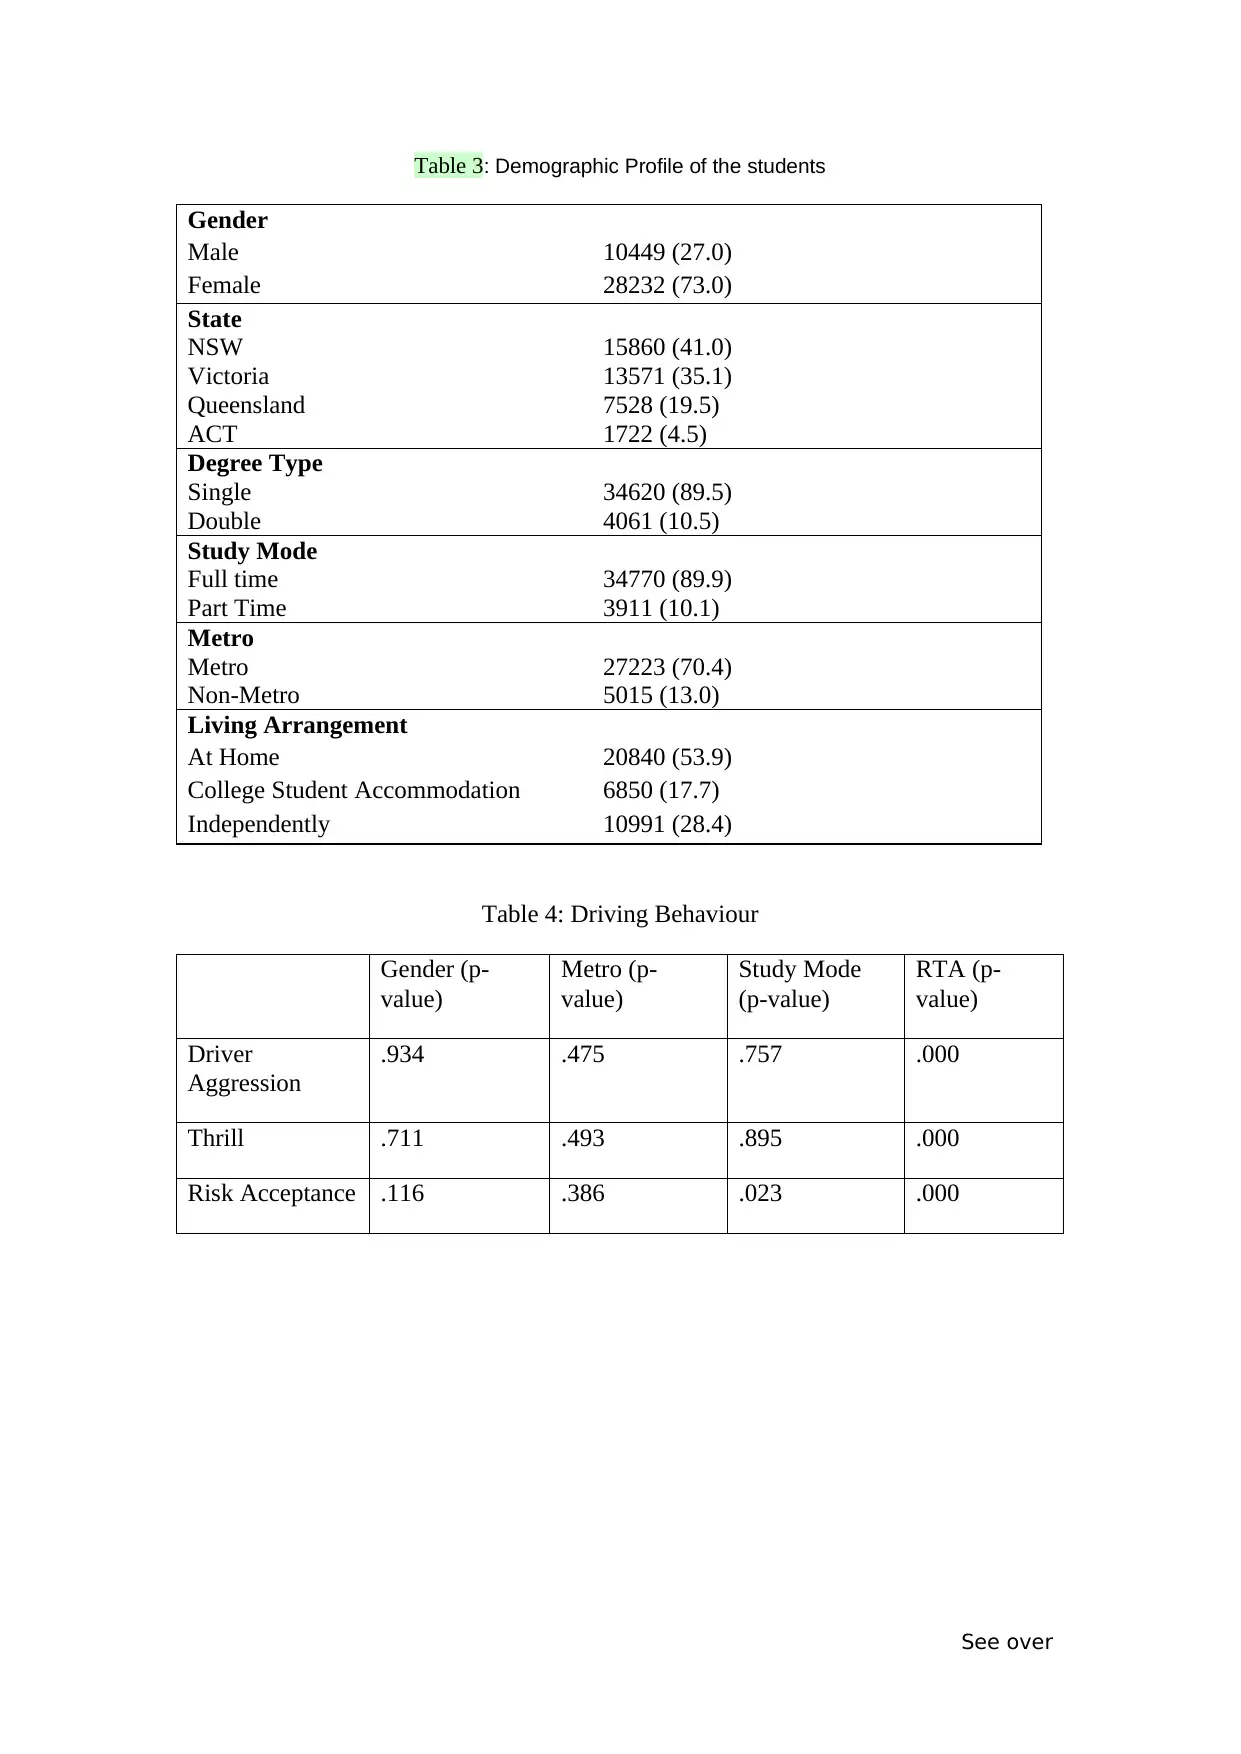
Table 3: Demographic Profile of the students
Gender
Male 10449 (27.0)
Female 28232 (73.0)
State
NSW
Victoria
Queensland
ACT
15860 (41.0)
13571 (35.1)
7528 (19.5)
1722 (4.5)
Degree Type
Single
Double
34620 (89.5)
4061 (10.5)
Study Mode
Full time
Part Time
34770 (89.9)
3911 (10.1)
Metro
Metro
Non-Metro
27223 (70.4)
5015 (13.0)
Living Arrangement
At Home 20840 (53.9)
College Student Accommodation 6850 (17.7)
Independently 10991 (28.4)
Table 4: Driving Behaviour
Gender (p-
value)
Metro (p-
value)
Study Mode
(p-value)
RTA (p-
value)
Driver
Aggression
.934 .475 .757 .000
Thrill .711 .493 .895 .000
Risk Acceptance .116 .386 .023 .000
See over
Paraphrase This Document
Need a fresh take? Get an instant paraphrase of this document with our AI Paraphraser
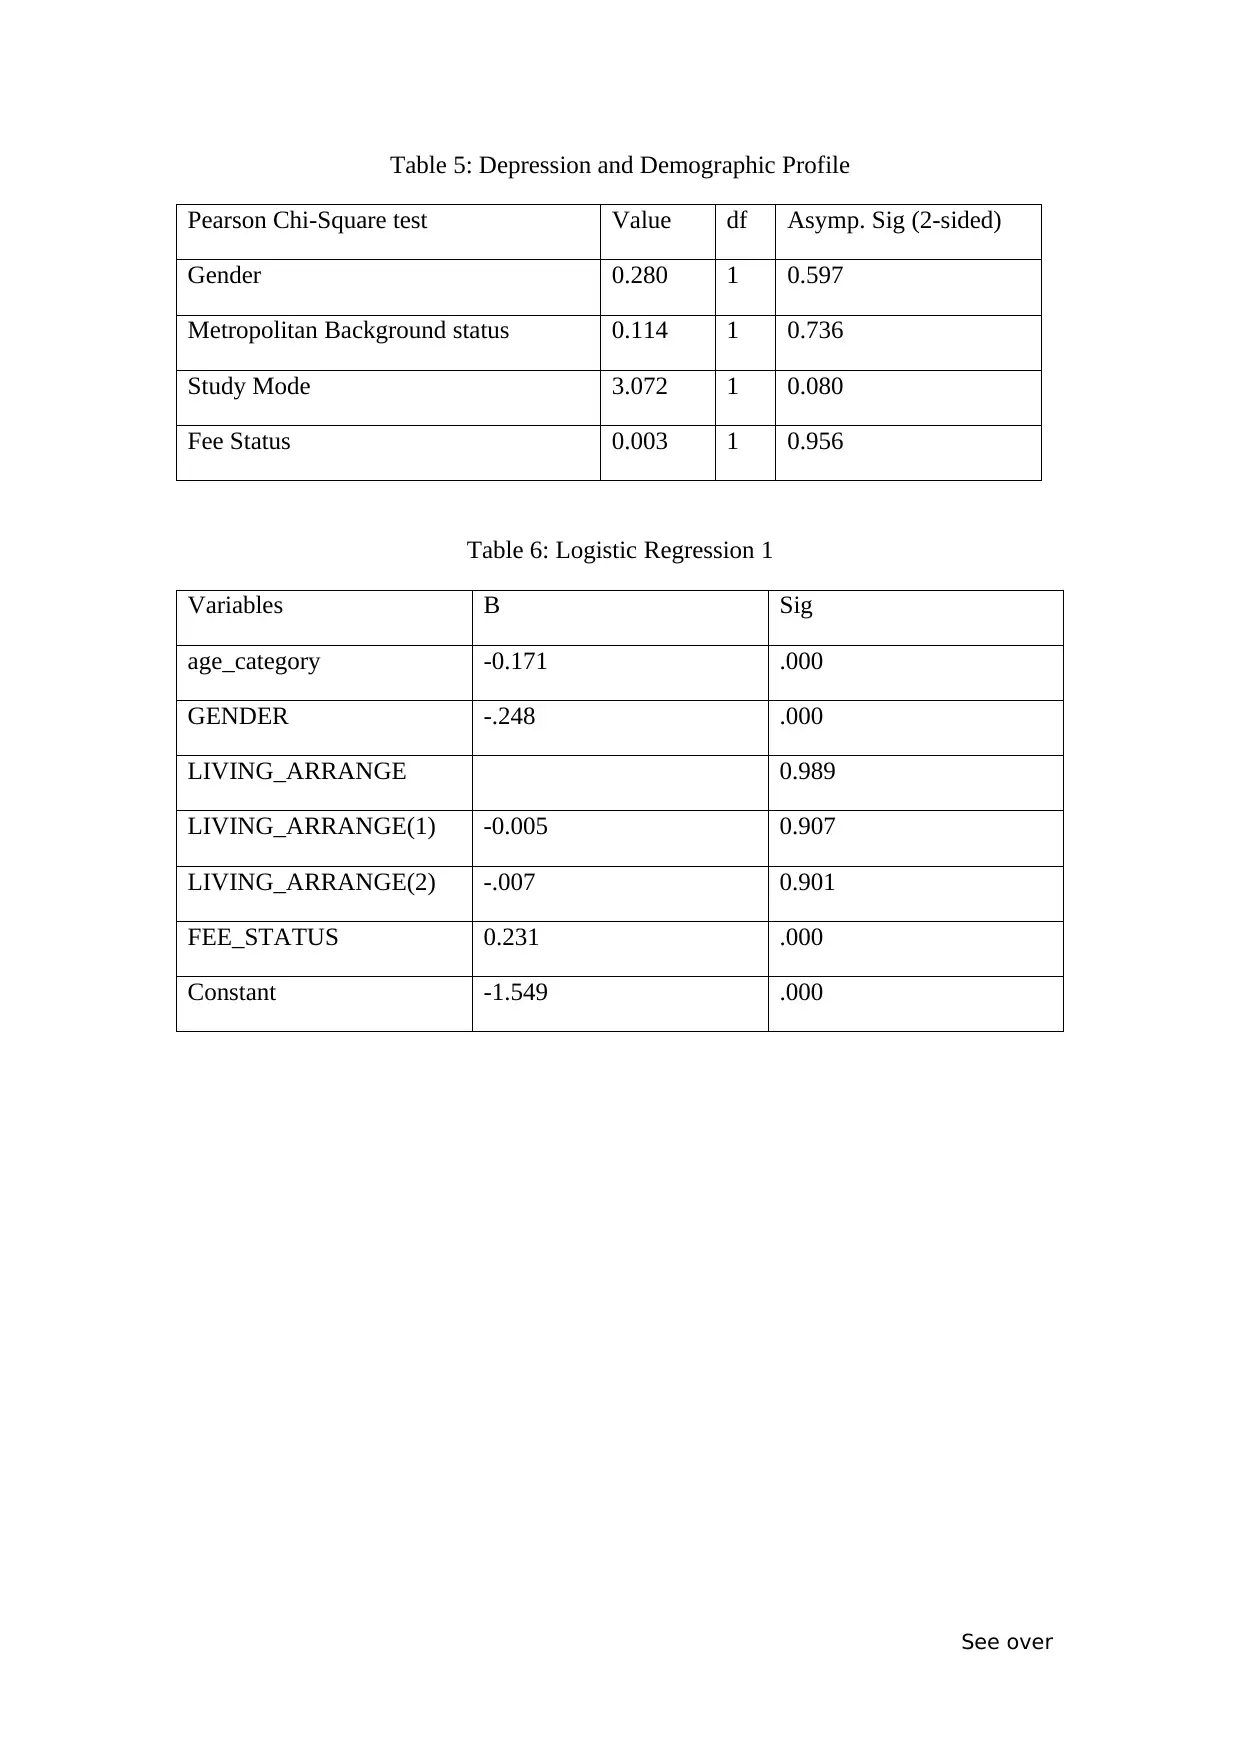
Table 5: Depression and Demographic Profile
Pearson Chi-Square test Value df Asymp. Sig (2-sided)
Gender 0.280 1 0.597
Metropolitan Background status 0.114 1 0.736
Study Mode 3.072 1 0.080
Fee Status 0.003 1 0.956
Table 6: Logistic Regression 1
Variables B Sig
age_category -0.171 .000
GENDER -.248 .000
LIVING_ARRANGE 0.989
LIVING_ARRANGE(1) -0.005 0.907
LIVING_ARRANGE(2) -.007 0.901
FEE_STATUS 0.231 .000
Constant -1.549 .000
See over
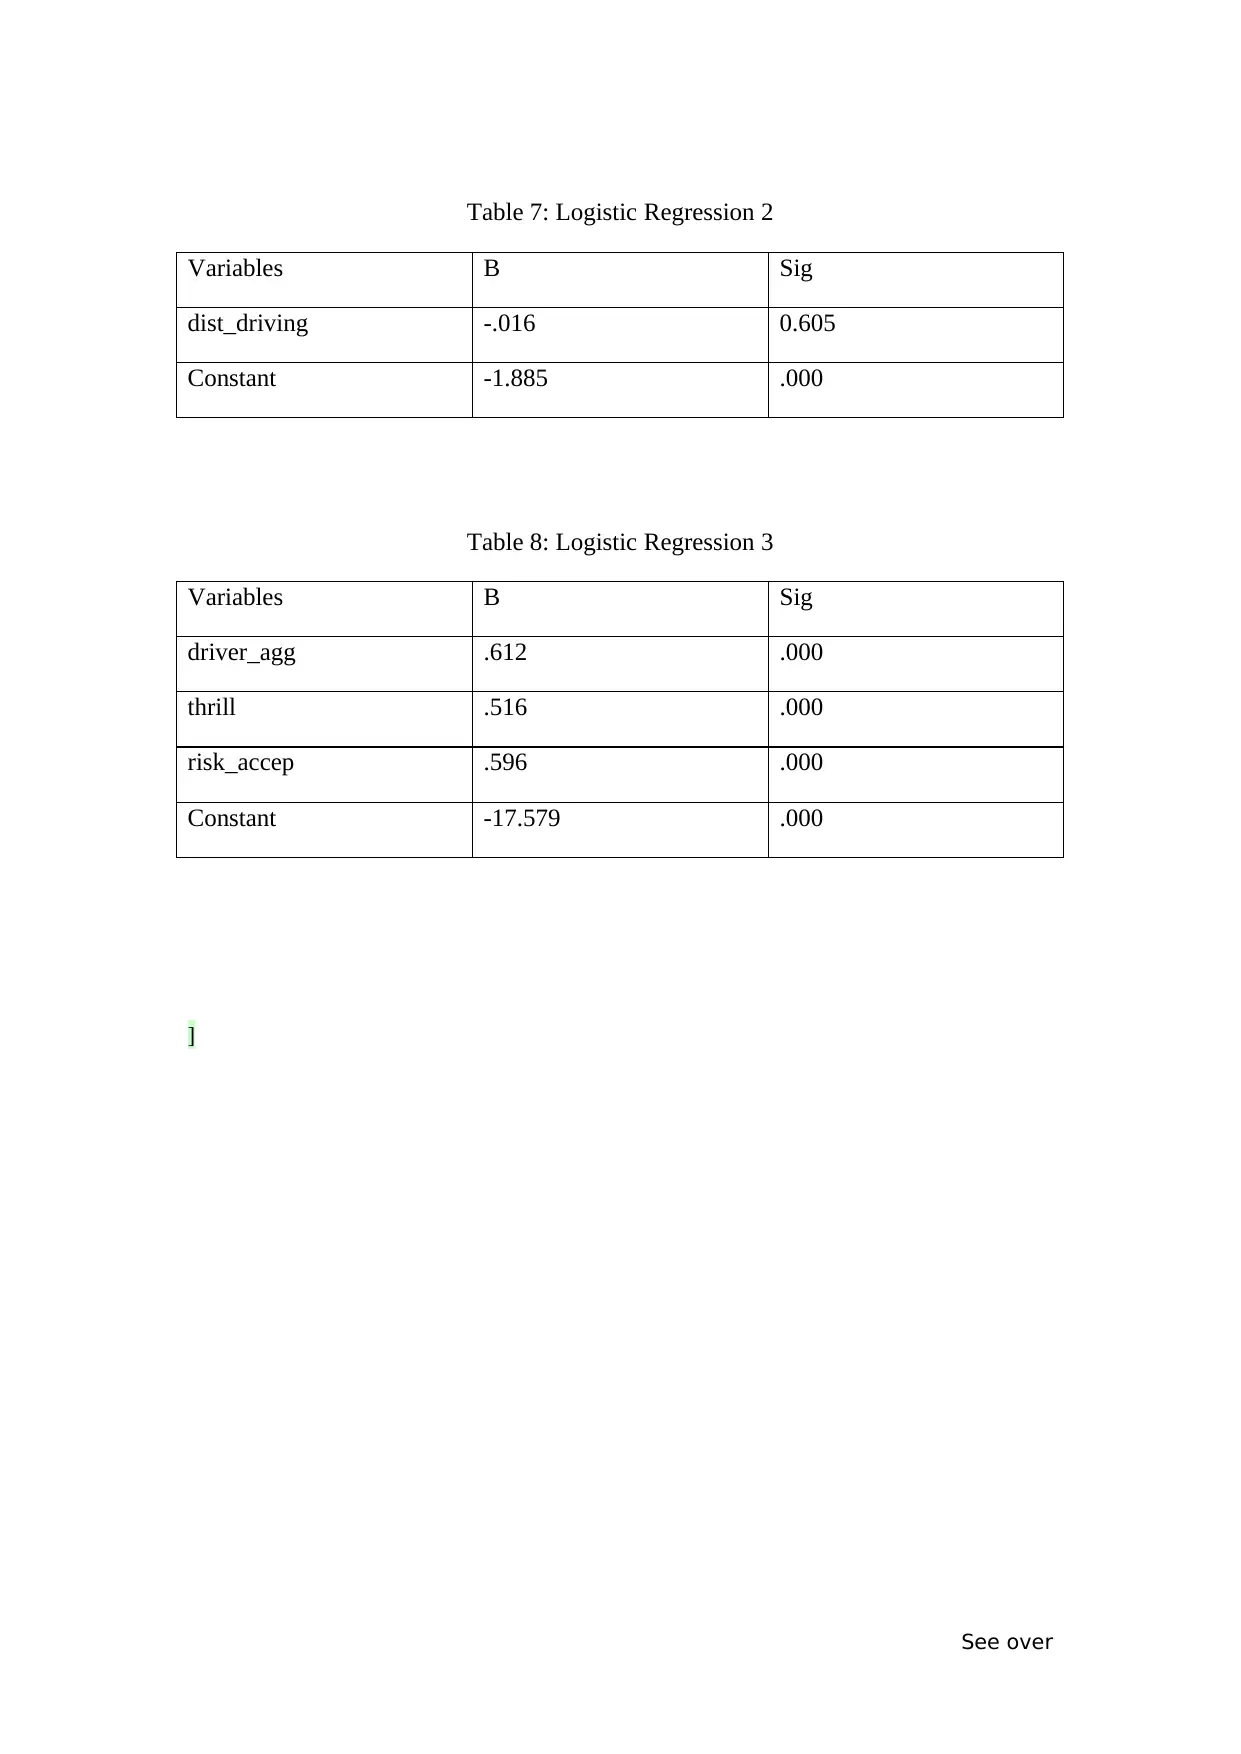
Table 7: Logistic Regression 2
Variables B Sig
dist_driving -.016 0.605
Constant -1.885 .000
Table 8: Logistic Regression 3
Variables B Sig
driver_agg .612 .000
thrill .516 .000
risk_accep .596 .000
Constant -17.579 .000
]
See over
Variables B Sig
dist_driving -.016 0.605
Constant -1.885 .000
Table 8: Logistic Regression 3
Variables B Sig
driver_agg .612 .000
thrill .516 .000
risk_accep .596 .000
Constant -17.579 .000
]
See over
⊘ This is a preview!⊘
Do you want full access?
Subscribe today to unlock all pages.
Trusted by 1+ million students worldwide

Photographs, graphs and illustrations
Photographs, graphs and illustrations may be inserted into this document for the purposes of
submitting your article. If we decide to proceed with your article, you will need to provide separate
high-quality versions of your photos and illustrations in appropriate file formats (see Instructions to
authors) before your article can be accepted for publication.
[add tables here]
1 out of 10
Related Documents


Your All-in-One AI-Powered Toolkit for Academic Success.
+13062052269
info@desklib.com
Available 24*7 on WhatsApp / Email
![[object Object]](/_next/static/media/star-bottom.7253800d.svg)
Unlock your academic potential
Copyright © 2020–2026 A2Z Services. All Rights Reserved. Developed and managed by ZUCOL.