Numeracy and Data Analysis Report: Train Station Usage Forecasting
VerifiedAdded on 2021/02/20
|11
|1315
|248
Report
AI Summary
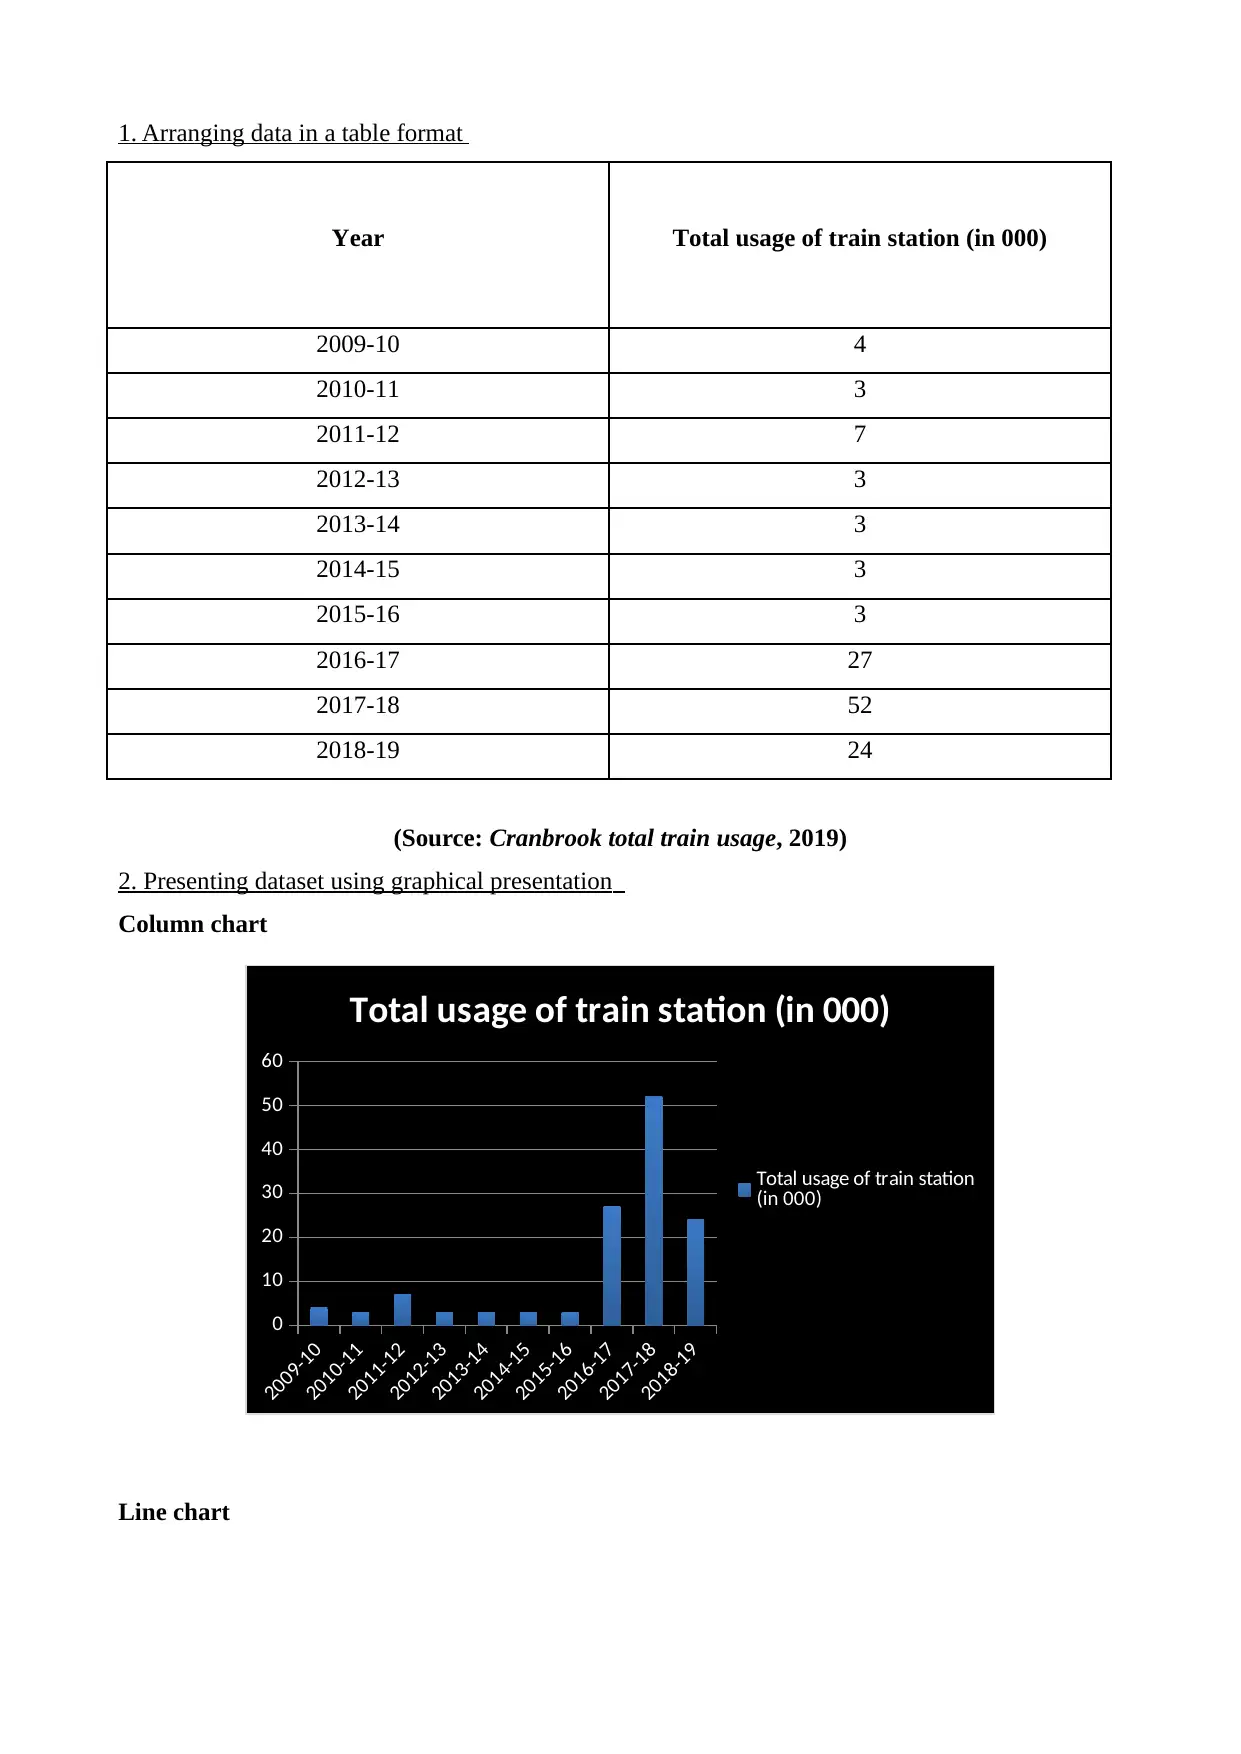
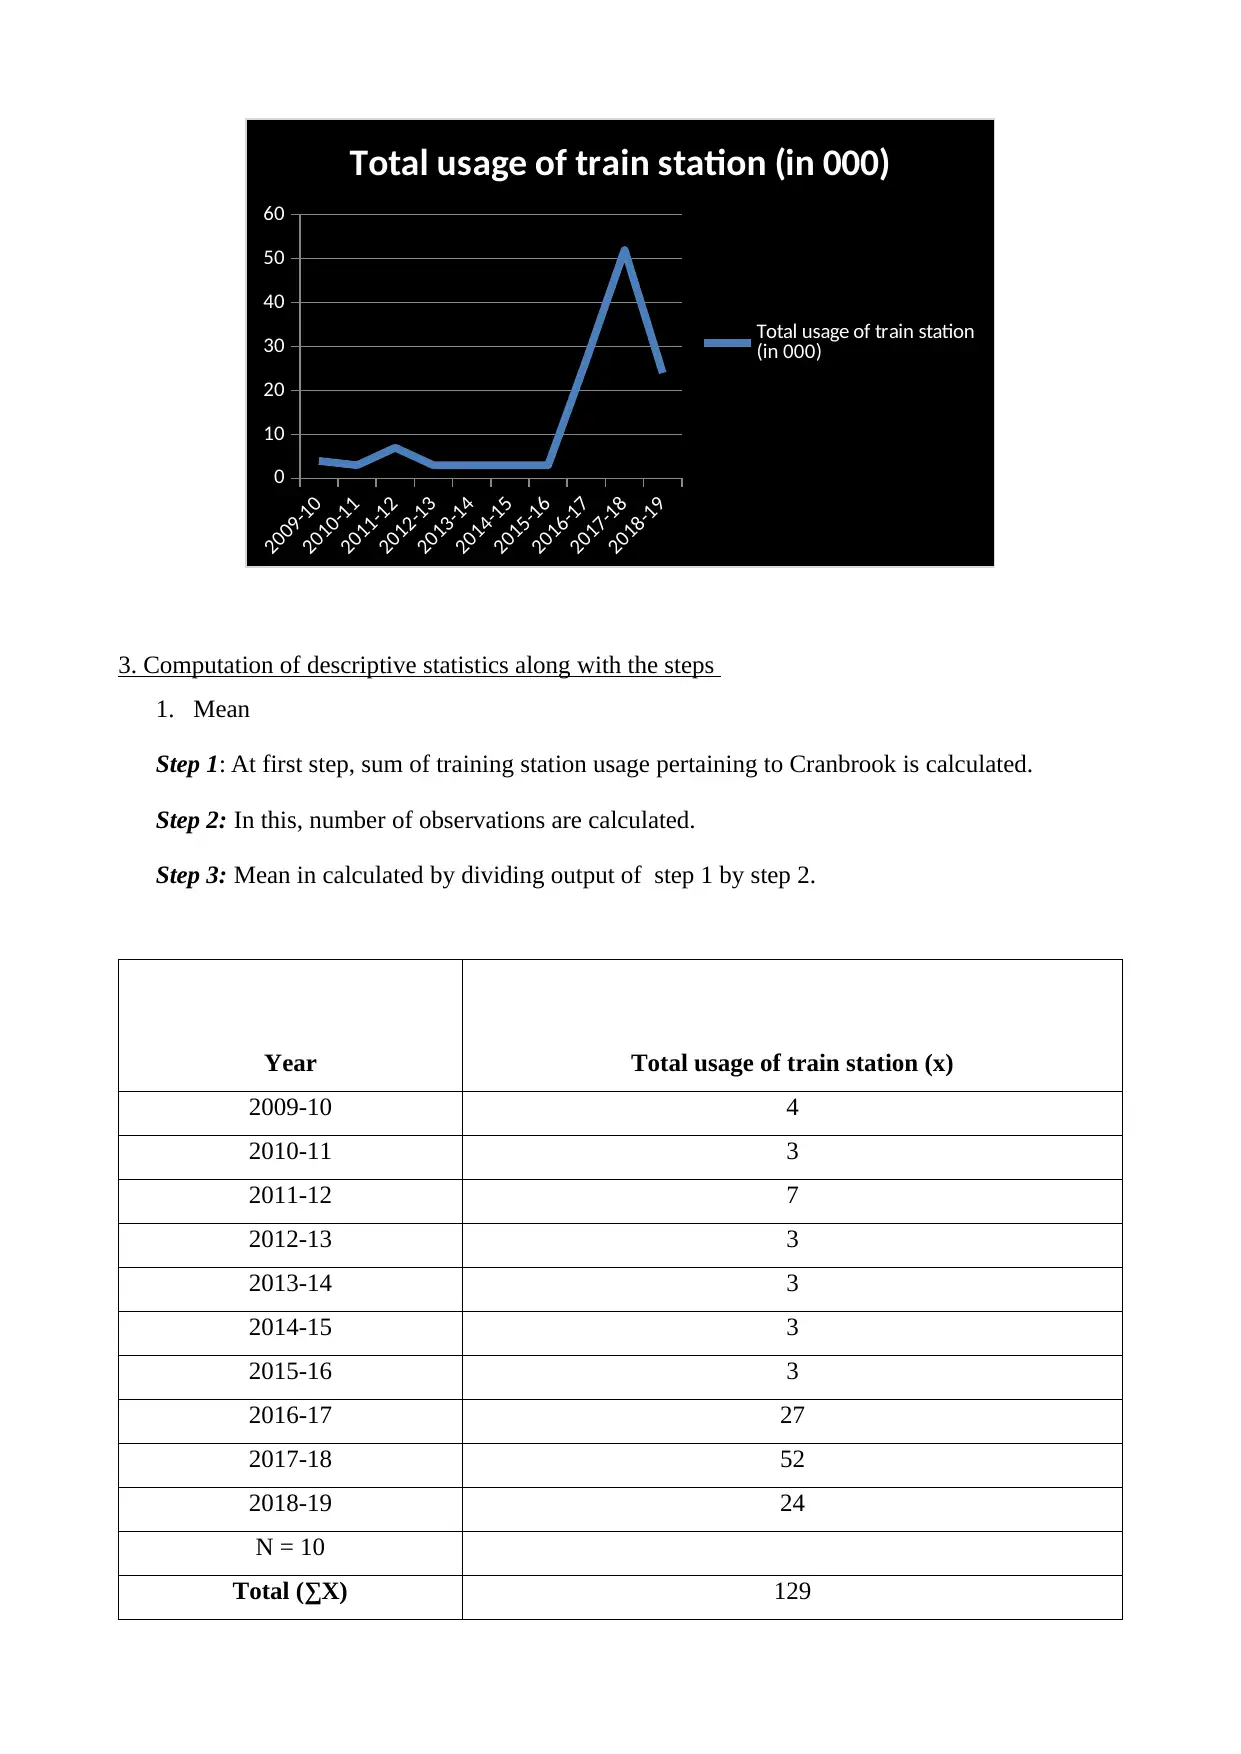
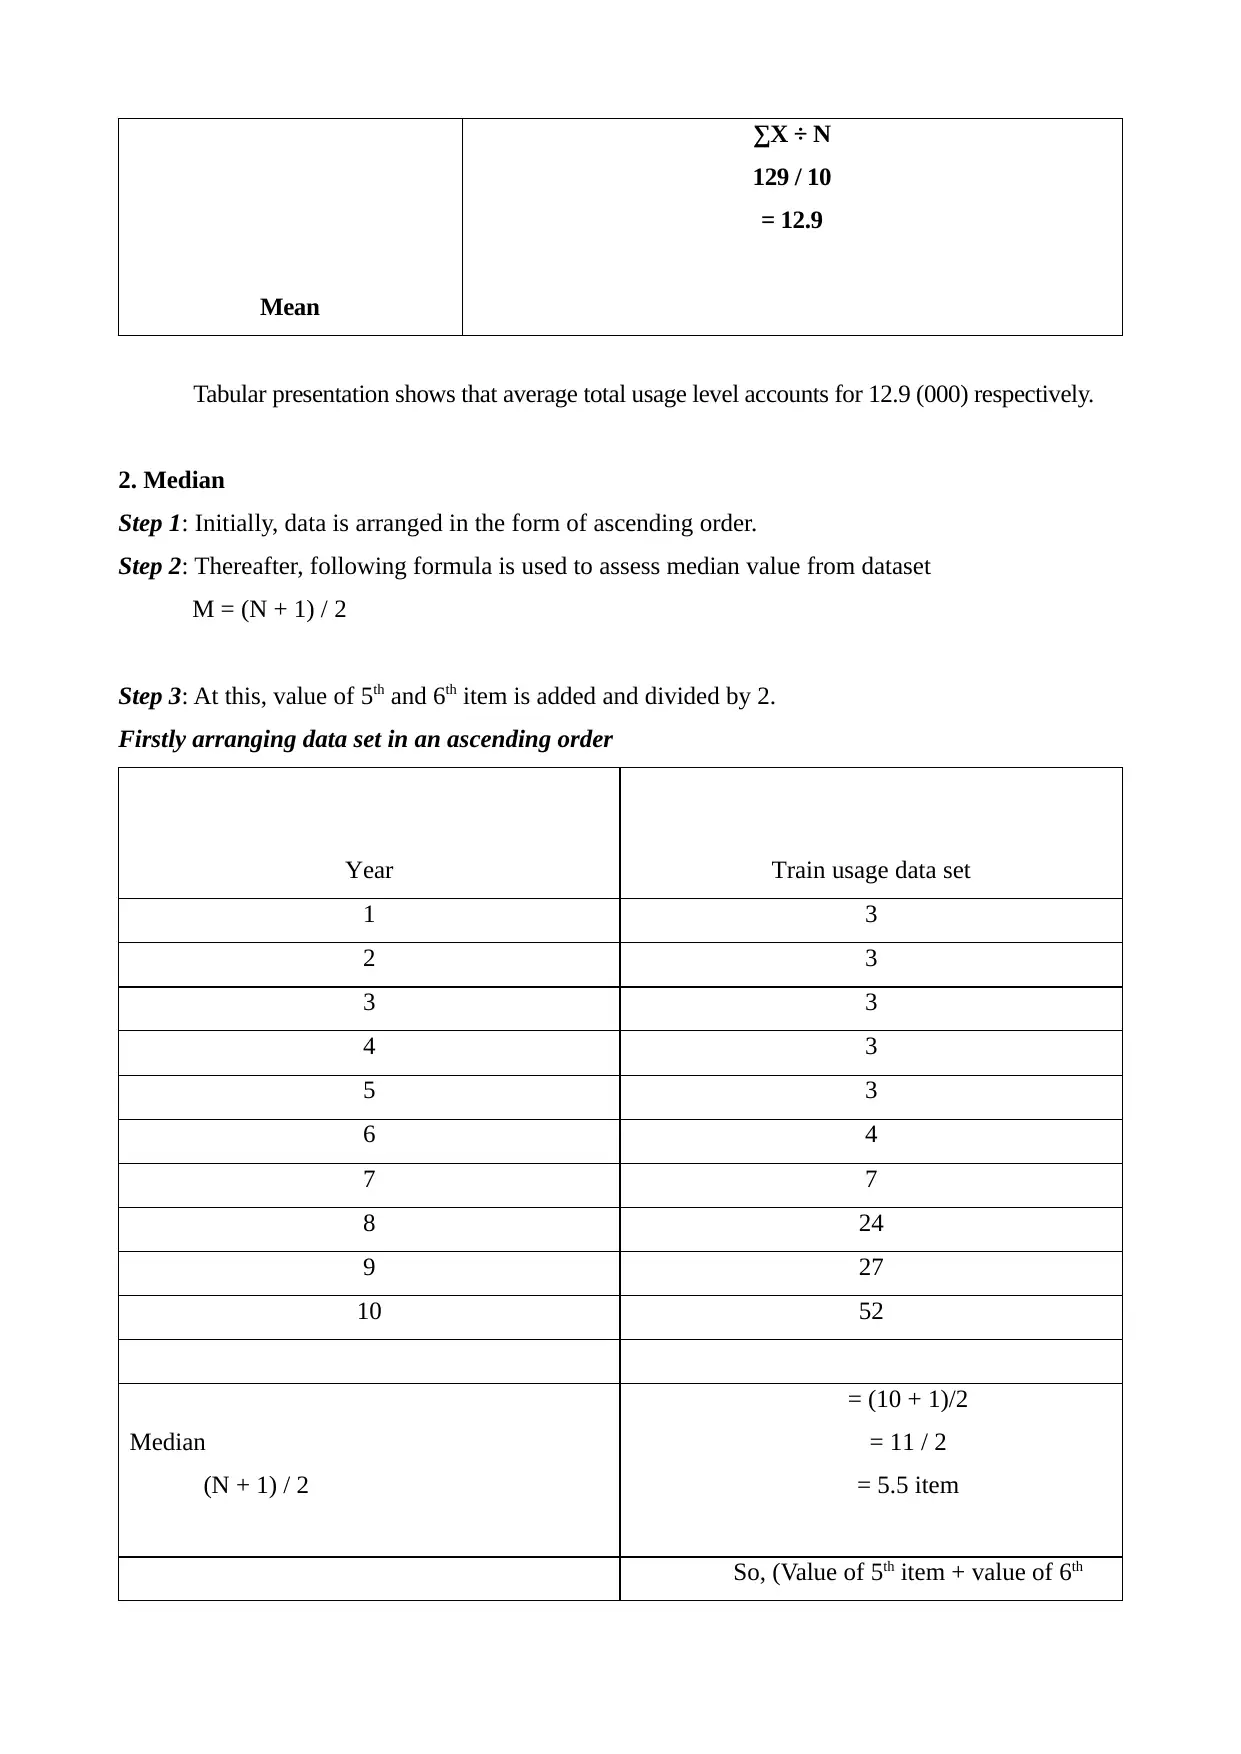
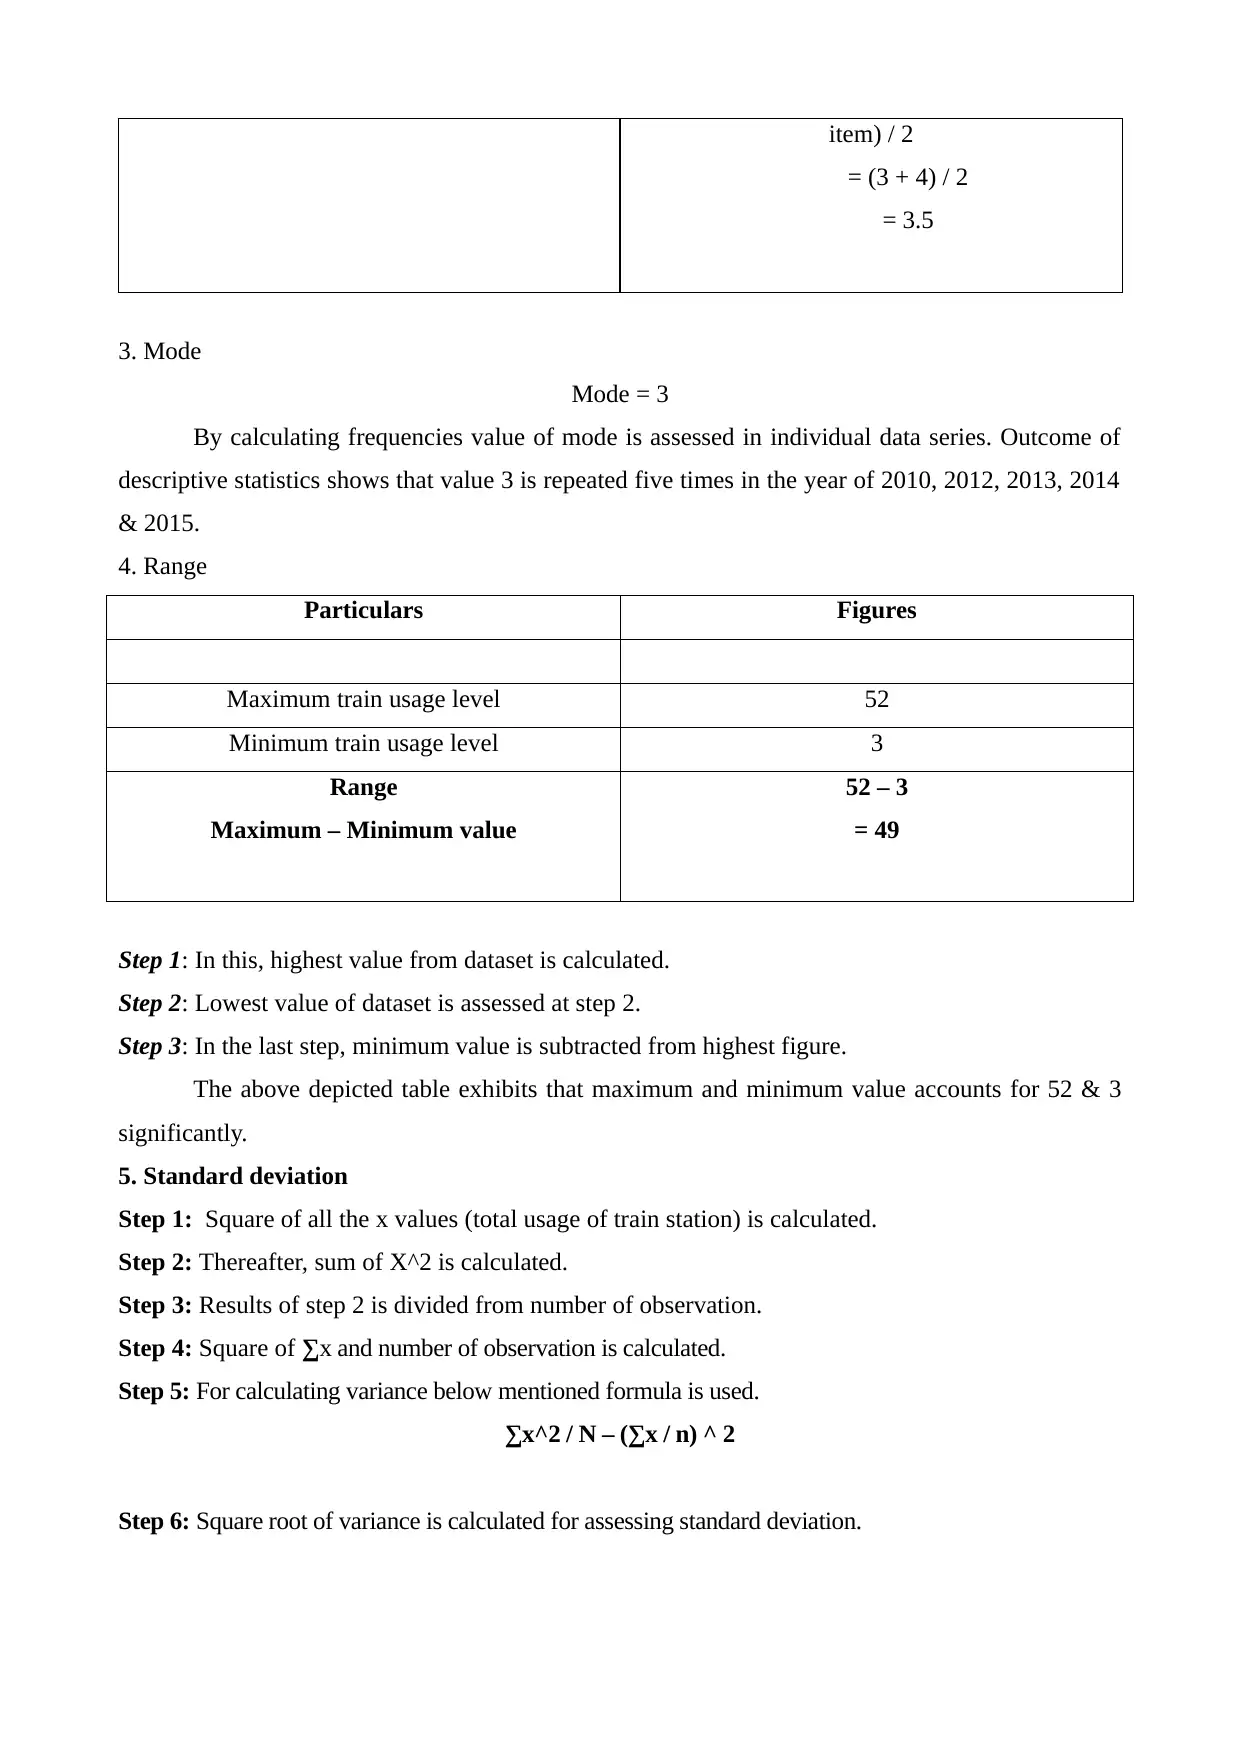
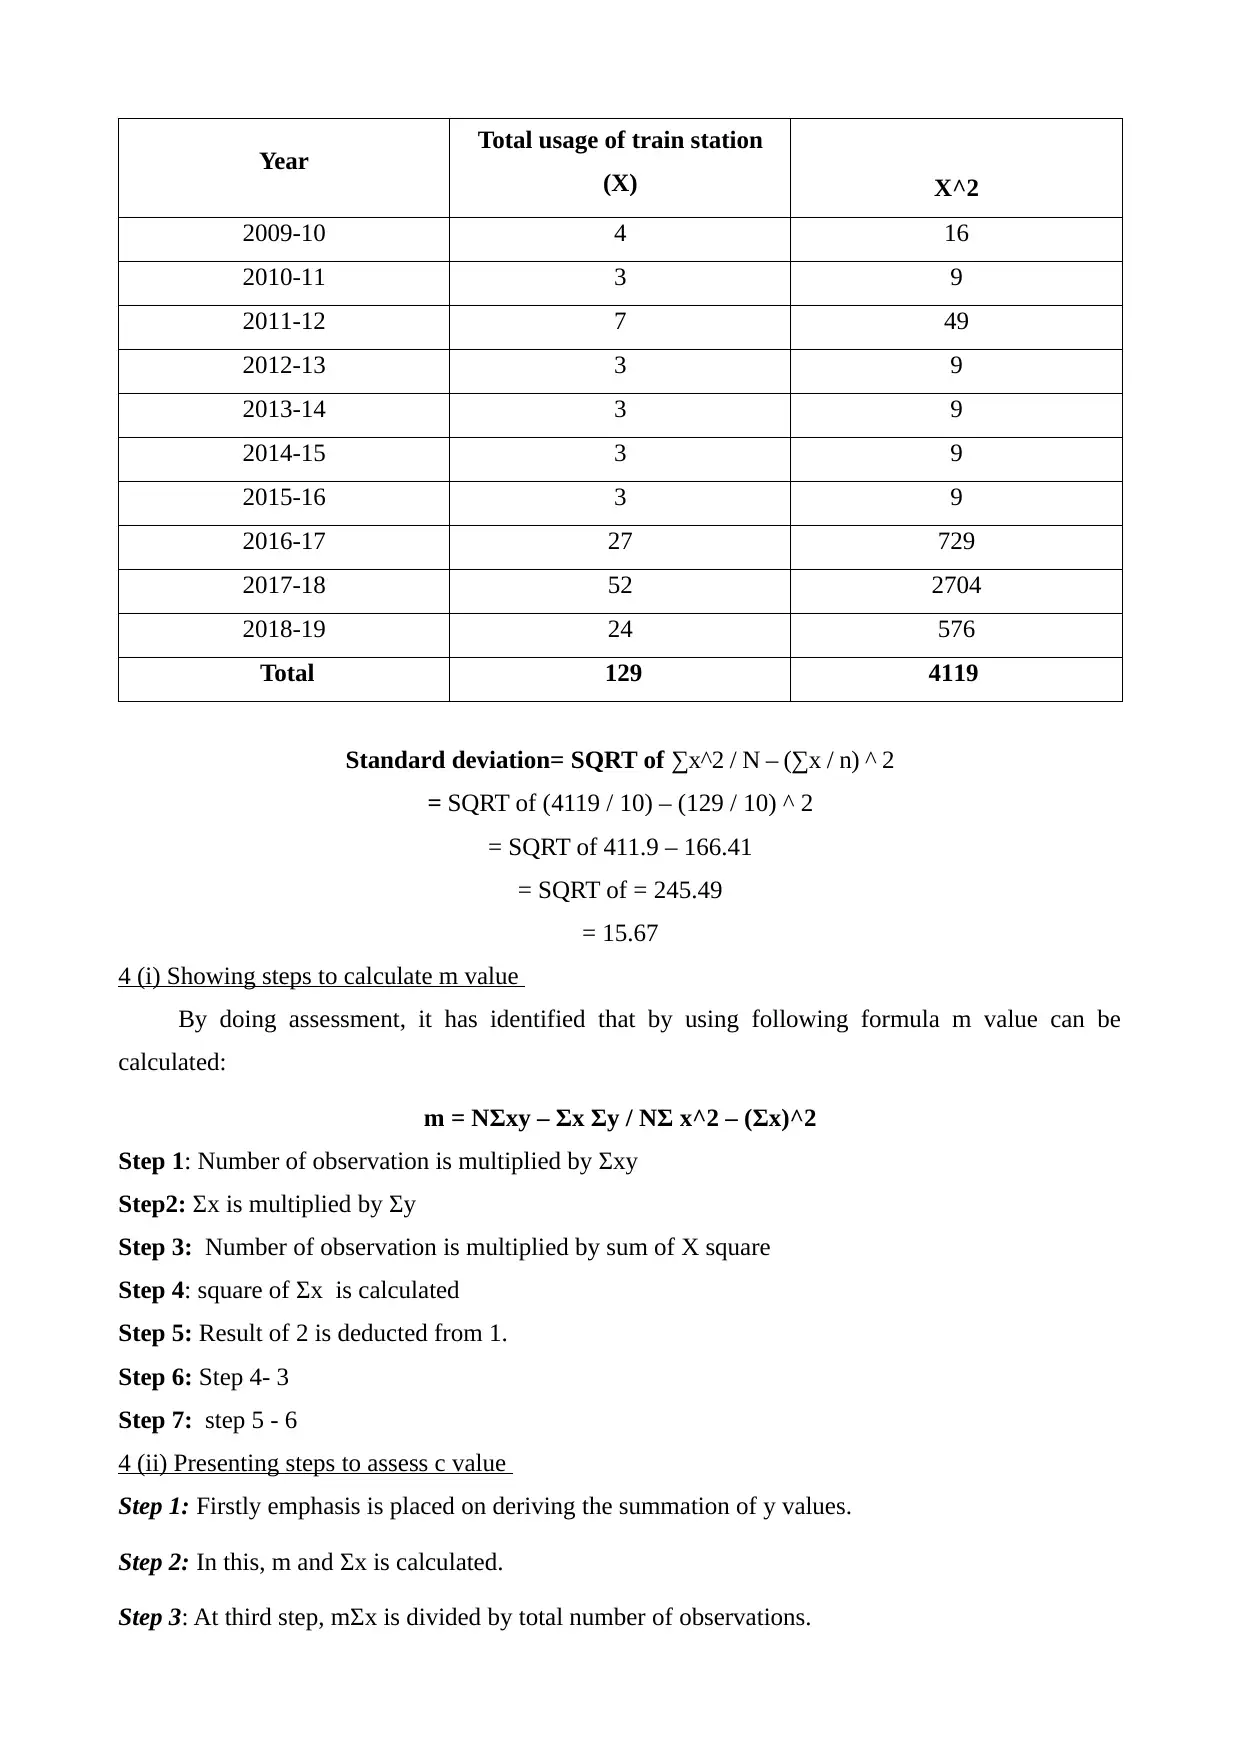
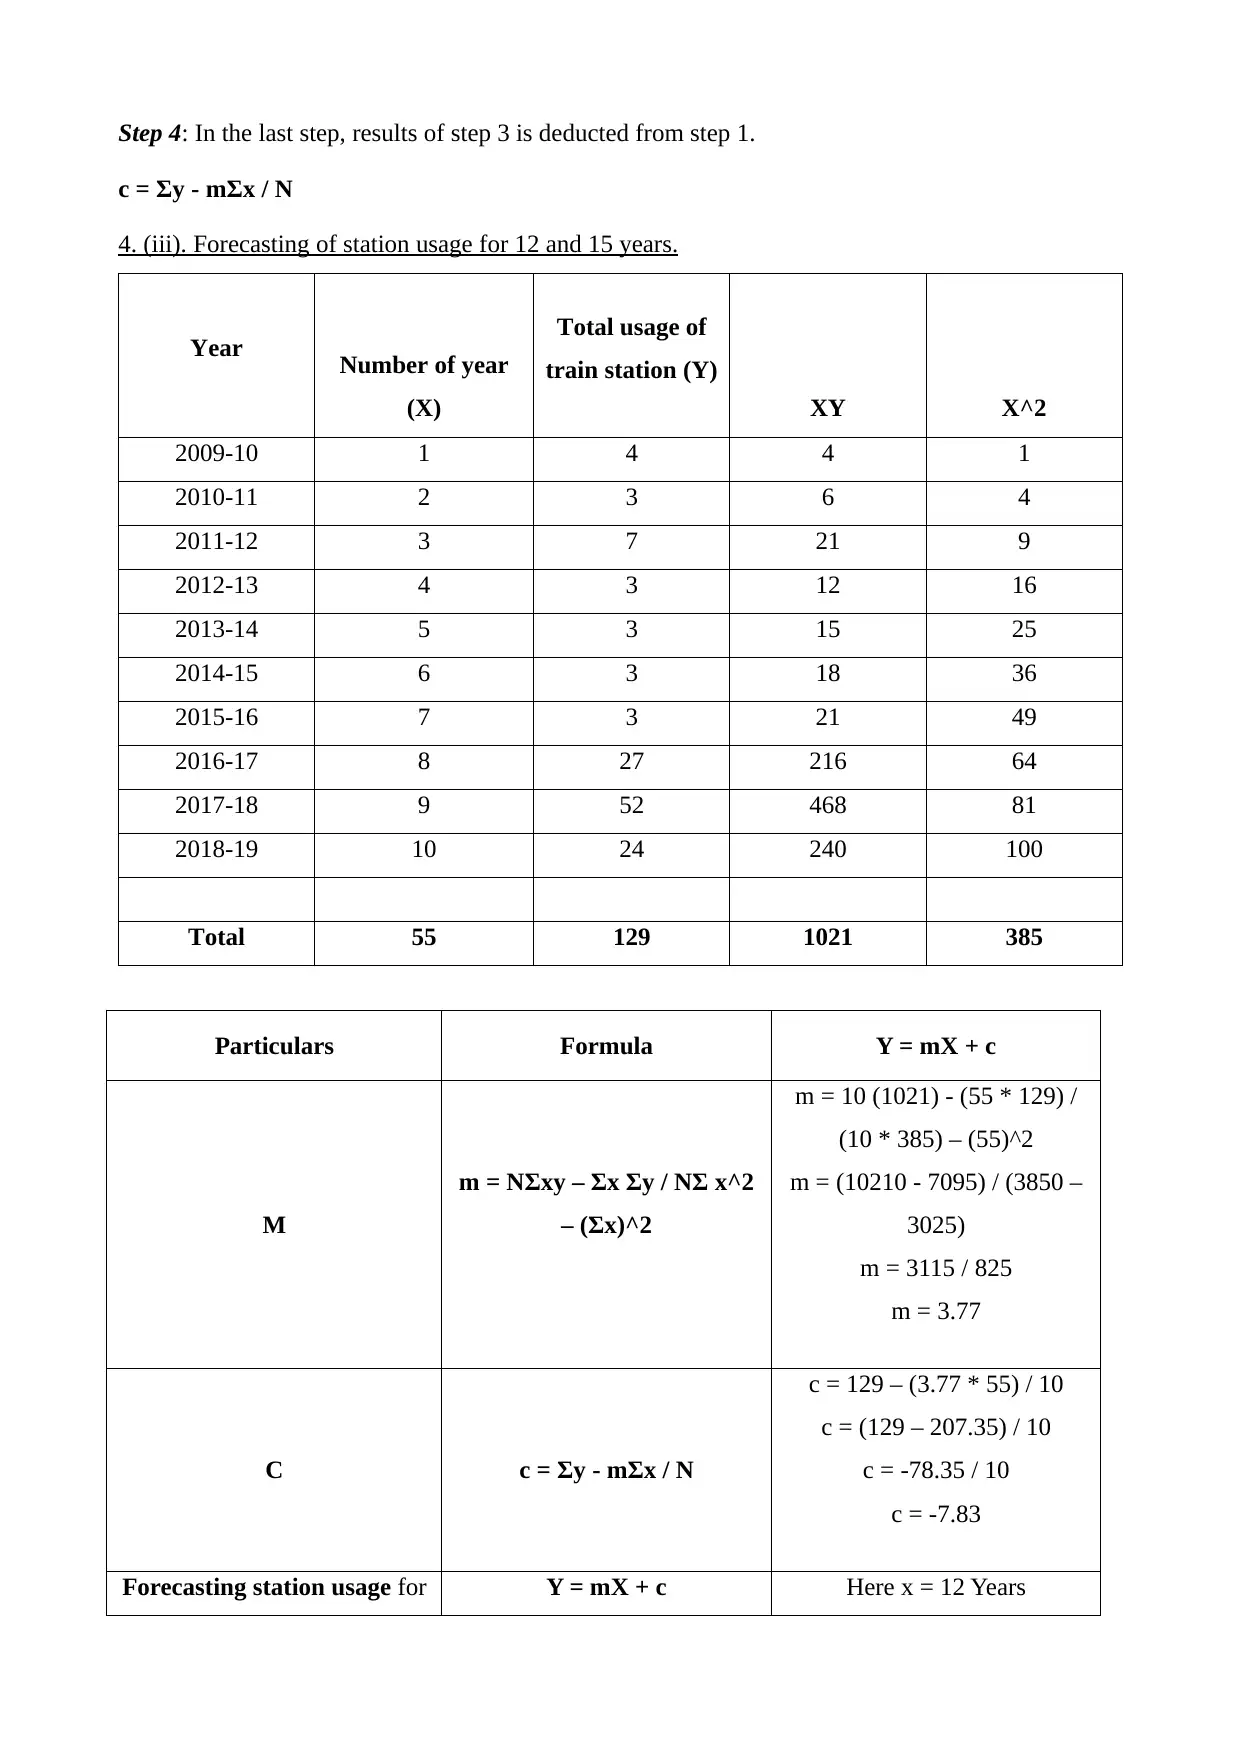
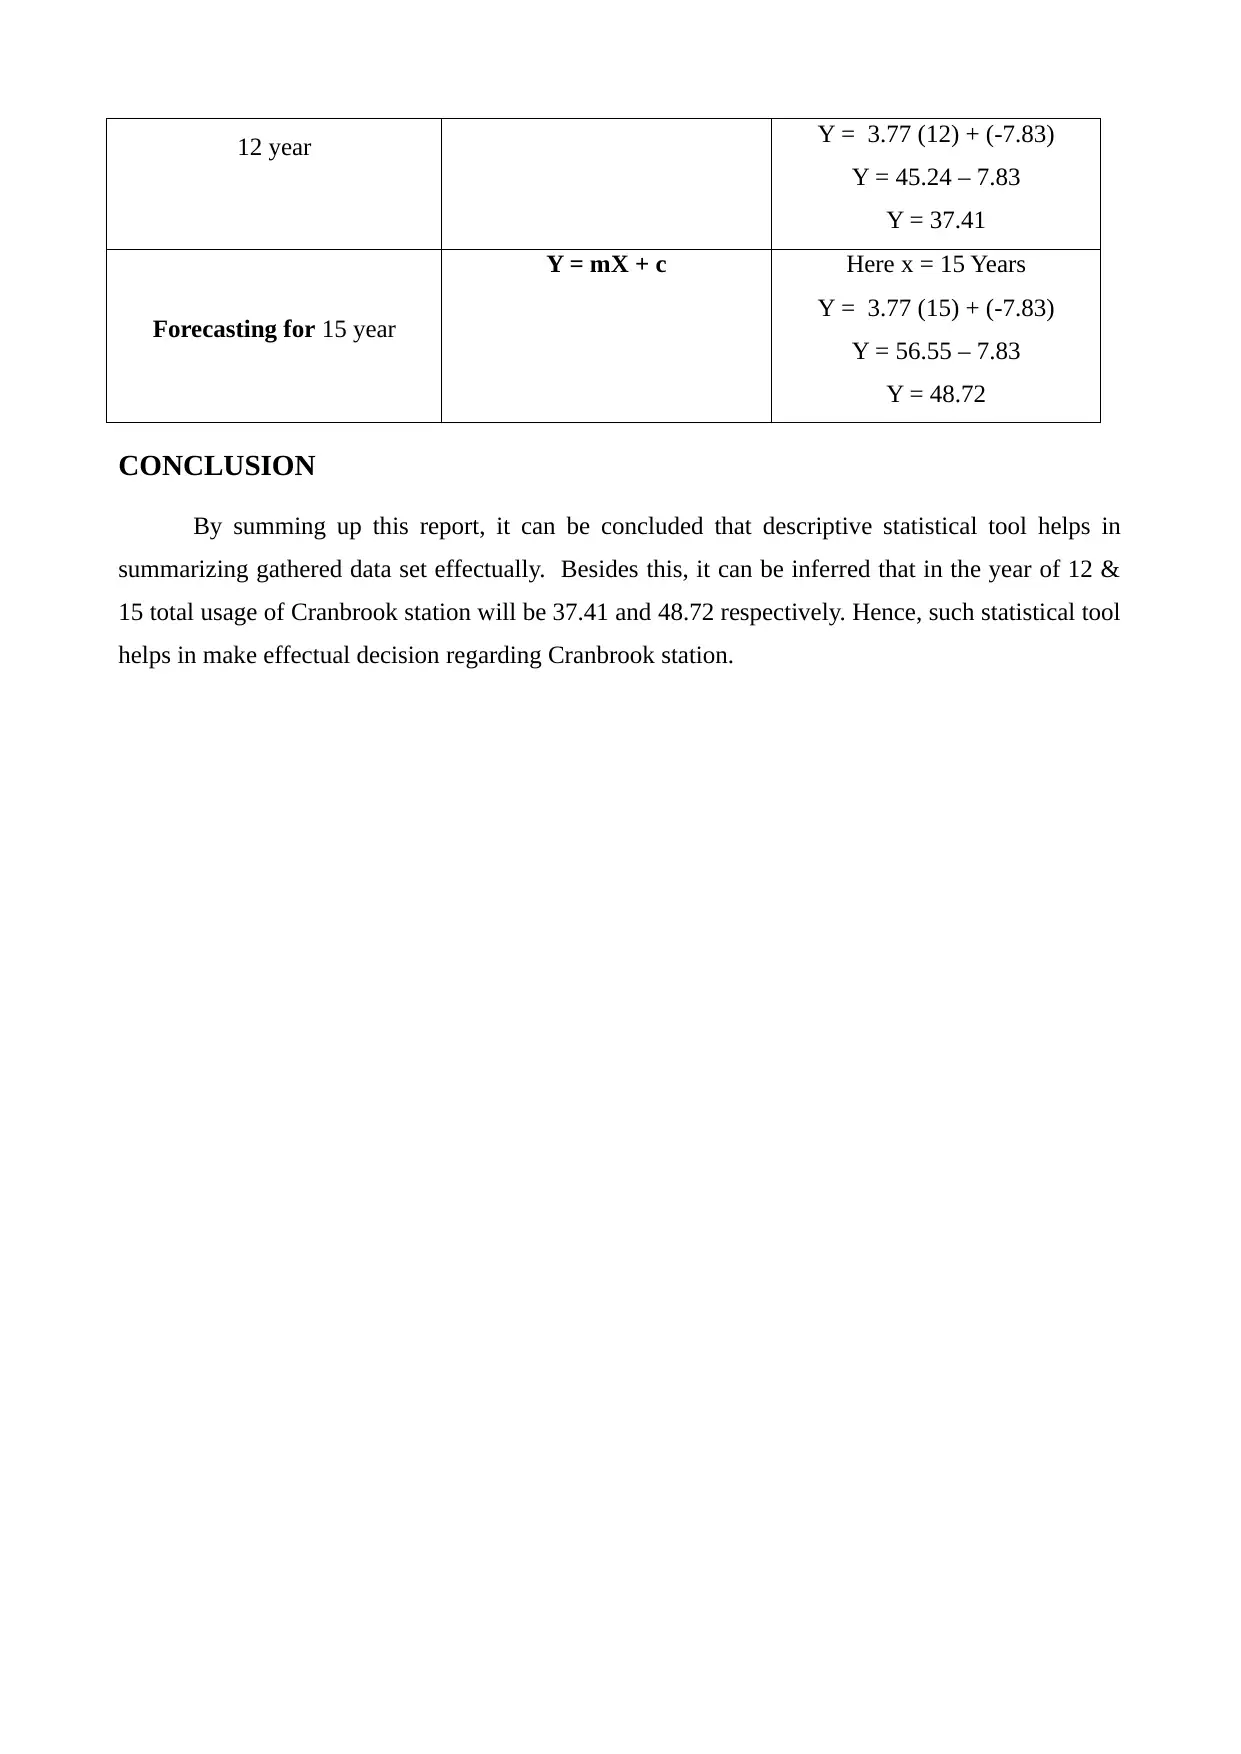
This report presents a comprehensive data analysis of train station usage, focusing on Cranbrook station. It begins by organizing the data in a tabular format and visualizing it through column and line charts. The main body delves into descriptive statistics, including the calculation of mean, median, mode, range, and standard deviation, providing step-by-step explanations for each. Furthermore, the report explores the calculation of the 'm' and 'c' values used in linear regression, essential for forecasting. Finally, the report applies these calculations to forecast station usage for 12 and 15 years, offering valuable insights for future planning and decision-making related to station management and resource allocation. The analysis is based on data from 2009-2019 and includes a conclusion summarizing the findings and their implications.
1 out of 11
Related Documents


Your All-in-One AI-Powered Toolkit for Academic Success.
+13062052269
info@desklib.com
Available 24*7 on WhatsApp / Email
![[object Object]](/_next/static/media/star-bottom.7253800d.svg)
Copyright © 2020–2026 A2Z Services. All Rights Reserved. Developed and managed by ZUCOL.